Thesis for Degree of Master of Science in Biotechnology
Effects of nicotine sensitization on GABA
A
subunit expression in the rat brain
Veronica Bergenheim
Supervisors:
Associate Professor Helgi B. Schiöth Doctor Christopher Pickering
Department of Neuroscience, Pharmacology Uppsala Universitet
Examiner:
Senior lecturer Magnus Neumüller
Department of Biology and Chemical Engineering Mälardalen University
Abstract
Smoking is a worldwide problem and it is the second major cause of death. People often try to quit, but few succeed mainly because of withdrawal symptoms such as irritability, anxiety, increased appetite, hyperventilation and difficulty concentrating.
The overall aim of this project was to study neurochemical changes in the brain following sensitization to nicotine which could give more information about what causes an individual to go from using drugs to abusing the drugs. Therefore, we investigated messenger ribonucleic acid (mRNA) expression of several genes known to be involved in the mesolimbic dopamine pathway in the nucleus accumbens, caudate putamen, prefrontal cortex and medial prefrontal cortex using real-time polymerase chain reaction (real-time PCR).
The results showed that in the nucleus accumbens, mRNA expression of gamma-aminobutyric acid (GABA) Aα1 subunit receptor and GABA transporter 3 (GAT-3) were significantly increased following nicotine administration, while in the caudate putamen no difference in expression was observed. In prefrontal cortex, the expression of adrenergic subunit receptor α2A was significantly increased following hexamethonium administration. In medial prefrontal cortex a significant decrease of expression of GAT-1 was shown following nicotine and hexamethonium administration, while a decrease of CART expression only was shown following nicotine administration.
Overall, these changes in the GABA system may help to explain the mechanism of nicotine sensitization.
Table of contest
ABSTRACT 1 LIST OF ABBREVIATIONS 4 INTRODUCTION 5 ADDICTION 5 NICOTINE 5 MECHANISMS OF ACTION 5 PHARMACOKINETICS 5 HEXAMETHONIUM 6THE MESOLIMBIC DOPAMINE SYSTEM 6
NICOTINE-DOPAMINE INTERACTIONS 6
SENSITIZATION 8
NICOTINIC ACETYLCHOLINE RECEPTORS 8
GABA RECEPTORS 9 GABA TRANSPORTERS 10 CART 10 ADRENERGIC RECEPTORS 10 SEROTONERGIC RECEPTORS 11 REAL-TIME PCR 11 AIMS 12
MATERIALS & METHODS 12
REAL-TIME PCR 12
MELTING CURVE ANALYSIS 14
HOUSEKEEPING GENES AND NORMALIZATION 14
ANIMAL TREATMENT AND TISSUE PREPARATION 15
EXPERIMENTAL SUBJECTS 15
SENSITIZATION 15
LOCOMOTOR ACTIVITY MEASUREMENT 15
BRAIN DISSECTION 15
RNA ISOLATION 15
DNASE TREATMENT AND DNA CONTAMINATION CONTROL 16
CDNA SYNTHESIS 16
REAL-TIME PCR 17
DATA ANALYSIS 17
RESULTS 19
BEHAVIOR 19
EFFECTS OF NICOTINE AND HEXAMETHONIUM ON NACHRS 25
EFFECTS OF NICOTINE AND HEXAMETHONIUM ON GABAA RECEPTORS 27 EFFECTS ON NICOTINE AND HEXAMETHONIUM ON GABA TRANSPORTER EXPRESSION 31
EFFECTS OF NICOTINE AND HEXAMETHONIUM ON CART 33
EFFECTS OF NICOTINE AND HEXAMETHONIUM ON ADRENOCEPTORS 35
EFFECTS OF NICOTINE AND HEXAMETHONIUM ON SEROTONIN RECEPTORS 37
DISCUSSION 38
EFFECTS OF NICOTINE ON BEHAVIOR 38
EFFECTS OF NICOTINE AND HEXAMETHONIUM ON NACHRS 38
EFFECTS OF NICOTINE AND HEXAMETHONIUM ON THE GABA SYSTEM 39
EFFECTS OF NICOTINE AND HEXAMETHONIUM ON CART AND ADRENOCEPTORS 39
EFFECTS OF NICOTINE AND HEXAMETHONIUM ON SEROTONIN RECEPTORS 40
FUTURE PERSPECTIVES 41
ACKNOWLEDGEMENTS 41
REFERENCES 42
List of Abbreviations
ANOVA Analysis of variance β-act β-actin
β-tub β-tubulin
CART Cocaine and amphetamine regulated transcript cDNA Complementary deoxyribonucleic acid Ct Threshold cycle
CPu Caudate putamen CNS Central nervous system Cyclo Cyclophilin
DA Dopamine
5-HT Serotonin
gDNA Genomic deoxyribonucleic acid GABA Gamma-Aminobutyric Acid
GAPDH Glyceraldehyde-3-phosphate dehydrogenase GPCR G protein-coupled receptor
HKG Housekeeping gene H3b Histone H3b i.p. Intraperitoneal
mPFC Medial prefrontal cortex mRNA Messenger ribonucleic acid NA Nucleus accumbens
nAChR Nicotinic acetylcholine receptor PNS Peripheral nervous system PCR Polymerase Chain Reaction PFC Prefrontal cortex
RPL19 Ribosomal protein 19 s.c Subcutaneous
GAT GABA Transporter VTA Ventral tegmental area WHO World Health Organization
Introduction
About 650 million people worldwide use tobacco. It is the second major cause, after malaria , of death in the world and causes about 5 million deaths each year (Mansvelder and McGehee 2002). By 2020, it will cause some 10 million deaths per year if the current trend continues (WHO 2007). Tobacco use increases the risk of acquiring cardiovascular diseases, stroke and cancer (Mansvelder and McGehee 2002).
People often try to quit but few are successful, mainly because of withdrawal symptoms such as irritability, anxiety, increased appetite, hyperventilation and difficulty concentrating (Nestler, Hyman et al. 2001). Pharmacological treatments available today are nicotine replacement therapy (i.e. nicotine inhaler, chewing gum, transdermal patch) and the antidepressant drug bupropion. Both treatments appears to be equally effective, but bupropion has fewer side effects (Rang, Dale et al. 2007).
Addiction
Drug addiction is a condition characterized by compulsive drug intake, craving and seeking, despite negative consequences associated with drug use (Nestler, Hyman et al. 2001).
Nicotine
Mechanisms of action
Nicotine is the principal psychoactive compound found in tobacco. Its effects include mood elevation, decreased anxiety, decreased appetite, muscle relaxation, increased arousal, improved attentiveness and cognitive enhancement (Pierce and Kumaresan 2006). Nicotine binds to nicotinic acetylcholine receptors in the central nervous system (CNS).
Pharmacokinetics
The amount of tobacco is, on average, about 0.8 g per cigarette, while nicotine accounts for about 9-17 mg of this (Fig.1). About 10 % of this amount is normally absorbed by the smoker (the fraction of the absorbed amount varies greatly with the habits of the smoker and also the type of cigarette).
When nicotine enters the lungs, it is quickly absorbed, while very little is absorbed from the mouth or the nasopharynx. A cigarette, smoked over a period of 10 minutes, gives a plasma concentration of about 15-30 ng/µl(100-200 nmol/l) which falls to about half of this within the next 10 minutes and then more slowly the next couple of hours. The first rapid decline depends mostly on the redistribution of nicotine between the blood and other tissues. The second, more slow decline depends mostly on hepatic metabolism where nicotine is being oxidized to the inactive ketone metabolite continin (Rang, Dale et al. 2007).
Hexamethonium
Hexamethonium is a quaternary nicotinic cholinergic antagonist that does not easily cross the blood-brain barrier. Some hexamethonium may cross the blood-brain barrier but most stay in the periphery from where it may modify projections to the brain and affect neurotransmission (Ericson 2000) (Fig. 2). It has been used for therapeutic purposes (for example hypertension) but it has been replaced by more specific drugs. It is still used in research (PubChem 2007, May), in particular when comparing central versus peripheral effects of treatments.
Figure 2. Molecular structure of hexamethonium (PubChem, 2007)
The mesolimbic dopamine system
The mesolimbic dopamine (DA) system, also known as “the reward pathway”, is implicated in emotions and reward (Di Chiara 2000). It projects from the ventral tegmental area (VTA) via the hypothalamus to the nucleus accumbens (NA) shell (considered a part of the extended amygdala) and core (more associated with the striatum) (Kosowski 2005; Pickering 2006) (Fig. 3 and 4).
It has been established that the rewarding properties of addictive substances such as nicotine, cocaine and alcohol as well as natural stimuli such as food and opportunities for mating increases extracellular dopamine release in the nucleus accumbens. The release of dopamine within the VTA/NA circuit is required for natural stimuli to be rewarding (Hyman 2005). Dopamine targets dopamine receptors (D1-D5) that influence motor activity, cognitive processes, emotion and motivation (Rang, Dale et al. 2007).
Less is known about how addictive drugs induce addiction. One theory is that the reward system acts as a hedonic signal (signaling pleasure) and that addictive drugs have an advantage over natural rewards in that they can produce a significantly higher release of dopamine with prolonged stimulation and thus give a higher well-being state (Hyman 2005).
The reward systems involvement in learning is designed to promote survival. It is crucial for animals to remember, for survival aspects, where palatable food is located whenever there is shortage (Kelley 2004). These natural rewards shape a behavior in the animal to look for food where it was last found and it is believed that addictive drugs mimic these effects of natural rewards which in turn shape a drug taking behavior (Hyman 2005).
Nicotine-dopamine interactions
transmission (Pierce and Kumaresan 2006). In the NA, the nicotinic receptors are found on dopaminergic terminals as well as GABAergic and glutamatergic terminals (Pierce and Kumaresan 2006).
Nicotine stimulates nicotinic receptors on dopaminergic terminals in the NA which induces dopamine and glutamate release. Nicotine also increases firing rates of dopaminergic neurons (Schilstrom, Rawal et al. 2003). Nicotine-induced dopamine release in the NA can persist for over one hour (Pierce and Kumaresan 2006).
Figure 3. Schematic illustration of different brain regions in rat seen from the side. The mesolimbic dopamine system projects from the ventral tegmental area via hypothalamus to the nucleus accumbens.
Figure 4. Front part of the rat brain seen from above. It shows the locations of different brain areas such as the nucleus accumbens shell and core subdivisions to where the mesolimbic dopamine pathway projects. Picture adapted from Di Chiara (Di Chiara 2000).
Sensitization
Sensitization is thought to model the transformation from drug use to drug abuse in humans (Robinson and Berridge 1993). Sensitization to a drug occurs when repeated exposures to the same dose produce greater responses. In animals, sensitization to nicotine and many other substances of abuse (i.e. morphine, alcohol, cocaine, amphetamine and methamphetamine) manifests as increased locomotor activity (Balfour, Benwell et al. 1998; DiFranza and Wellman 2006). Sensitization to nicotine begins with the first dose and is maximal within 5-7 days in animals. Sensitization involves several neurotransmitters, receptors and brain areas (DiFranza and Wellman 2006). The mechanism responsible for sensitization to nicotine or other drugs has not been established. However, sensitization can be blocked by antagonists (Biala 2003).
Nicotinic acetylcholine receptors
The neuronal nicotinic acetylcholine receptors (nAChRs) belong to the cys-loop super family along with GABAA, the serotonin type 3 receptor (5-HT3) and the glycine receptor (Campagna-Slater and Weaver 2007). These receptors are ligand-gated cation channel receptors with a pentameric structure consisting of homomeric or heteromeric combinations of 12 different subunits (α2–α10, β2–β4) that form a central pore which are permeable to Na+, K+ and Ca2+ (Gotti and Clementi 2004; Kosowski 2005) (Fig. 5). There are two neuronal nAChRs that are more abundant than others; the α4β2-subtype and the α7-subtype (Gotti and Clementi 2004) (Fig. 5). These two receptors differ in their amount of binding sites where the homo pentameric receptors (e.g. α7) have five identical ACh-binding sites per receptor molecule (one on each subunit interface) and the heteropentameric receptors have two binding sites per molecule located between an α and a β subunit (Gotti, Zoli et al. 2006).
Neuronal nAChRs are located both pre-and post-synaptically and they play an important role in many physiological and pathological processes such as neuron development, learning and memory and reward (Wang and Sun 2005). They are widely and differentially distributed throughout the CNS and peripheral nervous system (PNS) and is activated and controlled by the endogenous neurotransmitter acetylcholine (ACh) or exogenous ligands such as nicotine (Gotti, Zoli et al. 2006) which both conduct rapid neuronal transmission in the CNS (Davies 2003).
Nicotinic receptors can exist in several different functional states. They exist largely in (1) a closed (resting) state before an agonist binds to the receptor, (2) briefly open while the channel is conducting cations and (3) desensitized or inactivated following agonist exposure. There are several factors that contribute to which functional state the receptor will exist in, namely; nAChR subtype, the agonist concentration and rate of agonist binding where long-time exposure of agonists will cause desensitization. Even if the concentration of agonists is low it can cause desensitization because the desensitized receptor has a higher affinity for the agonist then a resting or open receptor (Dani and Heinemann 1996).
Figure 5. Neuronal nicotinic acetylcholine receptors in which acetylcholine binding triggers the opening of the pore which allows Na+, K+ or Ca2+ to rapidly influx into the neuron.
Picture adapted from Georgi (Georgi 2007, May).
GABA receptors
GABA is the major inhibitory neurotransmitter of the brain and it acts on γ-amino butyric acid receptors of type A (ligand-gated ion channels) (Fig. 6) or type B (G protein-coupled). GABA receptors are inhibitory because their activation leads to influx of chloride ions into the neuron which hyperpolarizes the neuron (opposite to nAChR since Cl- is negatively charged) and thereby reduces its excitability (Davies 2003; Benarroch 2007).
The GABAA receptors are transmembrane ligand-gated ion channels with a pentameric structure and a conserved disulphide-bridge present in the extracellular domain of each subunit isoform (Davies 2003; Campagna-Slater and Weaver 2007). GABAA receptors have several subunits which include combinations of 6α, 4β, 3γ, 2ρ, δ, ε, θ and π and they occur primarily post-synaptic.
The GABAB receptors belong to the superfamily of G protein-coupled receptors and contain seven transmembrane domains. GABAB receptors are expressed on both presynaptic and postsynaptic membranes (Nestler, Hyman et al. 2001). They exert their effects by inhibiting voltage-gated calcium channels which reduces transmitter release and by opening potassium channels which reduces postsynaptic excitability (Rang, Dale et al. 2007).
Figure 6. The GABAA receptor in which GABA binding, in the interface of α and β subunits, triggers the
opening of the pore which allows Cl- to rapidly flux into the neuron.
GABA transporters
After the release of GABA into the synaptic cleft, the transmitters are relocalized into cells by GABA transporters (GAT). This enables the actions of GABA to be brief and localized (Borden 1996). Four different GAT subtypes have been identified; GAT-1, GAT-2, GAT-3 and BGT-1 and they are Na+- and Cl+- dependent plasma membrane neurotransmitter transporters (Chen, Reith et al. 2004). GAT-1 is localized presynaptically on neurons and on glia cells (Conti, Minelli et al. 2004) and is the most abundant GABA transporter in the brain. GAT-1 has high expression in the neocortex, hippocampus, cerebellum, basal ganglia, brainstem, spinal cord, olfactory bulb and retina (Chen, Reith et al. 2004). GAT-2 shares 52% homology with GAT-1 and is localized both pre- and post-synaptically and on glia cells. GAT-2 is found in brain with significant expression in meninges, ependyma and choroid plexus, but it does not overlap with markers of GABAergic signaling. GAT-3 also shares 52% homology with GAT-1 and is localized on glia cells (Chen, Reith et al. 2004).
CART
CART (cocaine- and amphetamine-regulated transcript) is a peptide that is involved in signal transduction in connection with feeding, drug reward, stress, cardiovascular function and bone remodeling and is distributed in a majority of reward-associated regions (Vicentic and Jones 2007). It has been shown that there is an upregulation of CART mRNA in the ventral tegmental area following acute administration of cocaine and amphetamine (Douglass, McKinzie et al. 1995). Due to the fact that CART seems to be involved in drug reward mechanisms, it would be interesting to see if nicotine or hexamethonium could affect its mRNA expression.
Adrenergic receptors
Adrenergic receptors are G protein-coupled receptors. The α and β subtypes exist as α1 and α2 (with further A, B, D and A, B, C respectively) subtypes and β1, β2 and β3 (Rang, Dale et al. 2007). The α1-adrenergic receptors play an important role in the regulation of physiological responses mediated by norepinephrine and epinephrine, particularly in the cardiovascular system (Chen and Minneman 2005). α2 receptors inhibit noradrenaline and acetylcholine transmitter release from autonomic nerves (Rang, Dale et al. 2007). Both α1 and α2 receptors are involved in cognition and learning (Arnsten, Mathew et al. 1999) and α1b mediates locomotor stimulation of cocaine in the prefrontal cortex (Drouin, Darracq et al. 2002).
Serotonergic receptors
Serotonin is also known as 5-hydroxytryptamine (5-HT). There are seven types of serotonin receptors (5-HT1-7) which are further subdivided into subtypes A-D. All are, except for the 5-HT3 receptor which is a ligand-gated ion channel, G-protein coupled receptors (Rang, Dale et al. 2007). The functional relevance of different receptor compositions is not yet clarified (Faerber, Drechsler et al. 2007).
Serotonergic neurons project from the dorsal raphe to the cortex, thalamus, and striatal regions including the caudate putamen, nucleus accumbens, substantia nigra and ventral tegmental area and they also project from the medial raphe to the hippocampus, amygdala and other limbic structures (Nestler, Hyman et al. 2001). Serotonin is involved in mood, sleep, feeding and appetite (Rang, Dale et al. 2007). 5-HT3 receptors are located
predominantly in CNS regions that are involved in the integration of the vomiting reflex, pain processing, the reward system and anxiety control (Faerber, Drechsler et al. 2007).
Real-time PCR
Real-time PCR is a very sensitive and fast method for gene expression studies. Up to 96 different reactions can be performed simultaneously and mRNA levels can be estimated with high accuracy. This makes it one of the most reliable methods for quantifying gene expression.
Other methods used for expression studies are northern blot, RNase protection assay, in-situ hybridization and RNA microarray analysis. Northern blot has the disadvantage of being quite insensitive (Alwine, Kemp et al. 1977), time consuming and having a complicated set-up. RNase protection assay is more sensitive than northern blot, but it is difficult to quantify from gels. In-situ hybridization is very time consuming, particularly optimizing the assay. The gene of interest must also be expressed in significant amounts for the transcription level to be detected. The advantage of in-situ hybridization is that it visualizes where a specific gene is expressed in different brain regions. Real-time PCR only detects if the gene is expressed in specific tissues. RNA microarray analysis produce the same information as real-time PCR, but this technique is very expensive and has statistical difficulties, such as false positives. Overall, real-time PCR is the method of choice when it comes to analyzing RNA expression.
A disadvantage when using real-time PCR in studying mRNA expression is that there is not always a correlation between the amount mRNA produced and the amount protein produced.
Aims
The overall aim of this project was to study neurochemical changes in the brain following sensitization to nicotine which could give more information about what causes an
individual to go from using drugs to abusing the drugs (i.e. how drug dependence develops)
Several drugs induce dopamine release, and these might introduce changes or adaptations in the mesolimbic dopamine pathway. The brain areas nucleus accumbens, prefrontal cortex and medial prefrontal cortex were chosen because they are involved in this
pathway. The caudate putamen (striatum) was included as a control region, since it is not directly involved in drug reinforcement.
More specifically the aims cover questions like:
• Does repeated nicotine exposure alter the inhibitory GABA system?
• Does hexamethonium also affect neurotransmitter systems in the brain, despite its peripheral actions?
• Does nicotine-induced locomotor activity involve adrenoceptors and the neuropeptide CART in a way similar to psychostimulants?
Materials & Methods
Real-Time PCR
Real-time PCR is a very versatile, powerful tool for the quantification of mRNA expression (Bengtsson, Karlsson et al. 2003; Kubista, Andrade et al. 2006). It is very sensitive and reproducible and has the advantage of being fast and having high throughput (Vandesompele, De Preter et al. 2002). The principle of the technique is to detect and quantify the products as they accumulate. Real-time PCR was developed by Higuchi et al (Higuchi, Dollinger et al. 1992). The major limiting property of original PCR is that it produces essentially the same amount of product, independently of the amount of initial DNA concentration present, which makes it difficult to analyze the product. Another limitation is that it is not possible to monitor the amplification of DNA during the PCR process.
Real-time PCR is performed as original PCR with the difference that it uses a fluorescent reporter that binds to the product and reports its presence by fluorescence. The fluorescent signal reflects the amount of product being formed (Kubista, Andrade et al. 2006). The most commonly used fluorophore is SYBR Green I (Bengtsson, Karlsson et al. 2003) which only fluoresces when it binds to unspecific double stranded DNA. The fluorescence increases during amplification which is proportional to the amount of specific product being produced (Fig. 7) (van der Velden, Hochhaus et al. 2003). Other fluorescent reporters that can be used are Taqman probes or Beacon primers.
Figure 7. SYBR Green I. As SYBR Green I binds to double-stranded DNA, the fluorescence increases enormously. More and more SYBR Green I will bind to the PCR product during the extension phase resulting in an increased fluorescence (van der Velden, Hochhaus et al. 2003).
Picture adapted from the University of Strathclyde (Strathclyde 2007, May).
During the first cycle, the fluorescent signal is weak and cannot be distinguished from the background, but as more products accumulate the signal increases. Product accumulates in an exponential manner until the reaction runs out of some critical component (i.e. primers, the reporter, or dNTPs) at which the signal levels off at a plateau (Fig. 8).
The separation of response curves, in the growth phase, reflects the difference in initial concentration of template present in the samples. The difference is quantified by comparing the number of amplification cycles required for the sample´s response curve to reach a particular threshold fluorescence signal level. The number of cycles required to reach threshold is called the Ct value (Fig. 8). The Ct value reflects the transcriptional activity of that gene in that particular sample (Kubista, Andrade et al. 2006).
Figure 8. Real-time PCR response curves. A threshold level is set sufficiently above background and number of cycles required to reach threshold, CT, are registered. (Kubista, Andrade et al. 2006)
Melting curve analysis
To be sure that a specific PCR product has been produced, a melting curve analysis is performed. If only one product has been amplified, only one peak will appear in the melting curve (Fig. 9).
Figure 9. The melting curve gives information about the specific products in each reaction vessel. Here two samples are being compared. The first, lower curve represents the unspecific product (e.g primer dimer) and the second curve represents the specific product. The data are plotted as negative derivate of the relative fluorescence units (-d(RFU)/dt) against temperature (oC).
Housekeeping genes and normalization
Comparing samples requires normalization to compensate for differences in the amount of biological material in the tested samples. The purpose of normalization is to remove the sampling differences (such as quantity and quality) in order to identify real gene-specific variation. This can be done by the use of housekeeping genes (HKG) also known as internal control genes with different metabolic functions.
The expression of housekeeping genes should not vary in tissues or cells under investigation or in response to experimental treatment. Evidence shows that one should use at least three HKGs for the calculation of a normalization factor (Kubista, Andrade et al. 2006) because there have been reports that demonstrate that classical HKG expression can vary extensively (Huggett, Dheda et al. 2005).
To determine which HKGs are the most stable the program geNorm, a visual basic application for Microsoft Excel, can be used. geNorm calculates the gene expression stability measure M for a reference gene as the average pairwise variation for that gene with all the other tested reference genes (Vandesompele, De Preter et al. 2002).
The variation between the HKG should be as minimal as possible (Kubista, Andrade et al. 2006).
Animal treatment and tissue preparation
Experimental subjects
Animal experiments were performed by Dr. Mia Ericson at the Department of Psychiatry and Neurochemistry of Göteborg University. Experiments were approved by the Ethical Committee for Use of Animal Subjects at Göteborg University and all animal care procedures followed the guidelines of Swedish legislation on animal experimentation (Animal Welfare Act SFS1998:56) and EU legislation (Convention ETS123 and Directive 86/609/EEC).
Thirty male Wistar rats were used in the experiment. The animals were housed in groups of 4 per cage with climate-controlled conditions for temperature (22oC), humidity (50%) and a 12 hour light-dark cycle (lights on at 07.00). After transport from Scanbur BK AB (Sollentuna, Sweden) the animals were given 1 week to acclimatize to the animal facilities. Food and water were provided ad libitum throughout the experiment.
Sensitization
The animals were divided into three groups (n=10) and injected with saline (0.9% NaCl), nicotine (1 mg/kg s.c. nicotine tartrate) or hexamethonium (10 mg/kg i.p.) for 18
consecutive days.
Locomotor activity measurement
The locomotor response to a challenged dose of nicotine was measured for 60 minutes in the saline and nicotine group. This method has previously been discussed (Molander and Soderpalm 2003). Briefly, the animals are given 30 minutes to habituate to the open field and then nicotine is injected subcutaneously. The activity is then measured for an
additional 30 minutes.
Brain dissection
The animals were killed by decapitation following experimental closure. The brains were rapidly removed and dissected according to the method of (Heffner, Hartman et al. 1980). All tissue samples were rapidly immersed in RNA Later (Ambion) and stored in -20oC.
RNA isolation
The brain tissues that were stored and fixed in RNA Later were removed and homogenized in 400 µl of TRIZOL (Invitrogen, Sweden) by ultra sonication using a Branson sonifier (Branson Ultrasonic Corporation, Germany). An additional 600 µl of TRIZOL was added to the samples and they were left for incubation at room temperature for five minutes. The TRIZOL reagent maintains the integrity of the RNA while disrupting cells and dissolving cell components. To separate the organic phase from the aqueous phase 200 µl of chloroform was added and samples were vigorously shaken for about 15 seconds and then incubated for about three minutes at room temperature. The samples
were centrifuged for 20 minutes at 11200 rpm at 4oC, where the mixture separates into a lower red, phenol-chloroform phase, an interphase, and a colorless upper aqueous phase, where the RNA remains exclusively. The aqueous phase was carefully removed and the RNA was precipitated by adding 500 µl of isopropyl alcohol and left for incubation for two hours or over night (in -20o), depending on tissue size. The samples were centrifuged for 10 minutes at 11200 rpm at 4oC and the supernatant was carefully discarded. The RNA pellets were washed twice with 1000 µl of 75 % ethanol followed by centrifugation for five minutes at 8600 rpm at 4oC. The RNA pellets were left to air dry for about 20 minutes and then re-dissolved in 15-20 µl of 1xDNAase Buffer, depending on pellet size.
DNAse treatment and DNA contamination control
To remove residual genomic DNA from the samples, a DNAse I treatment was performed as follows; 1 µl of DNAse (Roche Diagnostics) was added to each sample of RNA and left for incubation at 37oC for about two hours in a heat block. The DNA digestion was terminated by heating the samples to 75oC for 15 minutes and cooled on ice. To control that all DNA had been digested, a PCR followed by electrophoresis was performed.
The PCR was performed in a total reaction volume of 10 µl for each sample, with a mastermix volume of 9.5 µl and a template volume of 0.5 µl. The mastermix consisted of 6.75 µl RNA free water, 1 µl 10x buffer, 0.3 µl MgCl2 (50 mM), 0.25 µl Tween (1x1%), 0.1 µl dNTP (20 mM), 1 µl of forward and reverse primer (10 pmol/µl) and 0.1 µl DNA Taq Polymerase (Invitrogen, Sweden). Rat genomic DNA (gDNA) (100 ng/µl) and RNA free water was used as template for positive and negative control, respectively. The PCR was performed according to following settings: 95oC for 3 minutes, 35 cycles at 95oC for 30 seconds, 58oC for 30 seconds and 72oC for 45 seconds followed by 72oC for 5 minutes. The PCR product was analyzed by performing an electrophoresis, on a 2% agarose gel containing ethidium bromide in 1x TAE buffer (one liter 50x TAE contain 242 g Tris base; 57.1 ml Glacial Acetic Acid; 10 ml 0.5 M EDTA (pH8); dH2O).
Each sample was mixed with 6x loading Dye Solution before loading on gel. GeneRulerTM 100 base pair DNA ladder plus was used as a marker with a concentration of 0.5 µg DNA/µl. The Gene Ruler contains three different plasmids and has 14 separated fragments. The electrophoresis was performed at 130 V for 30 minutes. The nucleic acid was visualized by exposing the gel to ultraviolet light.
cDNA synthesis
Prior to the complementary DNA (cDNA) synthesis the concentration of RNA had to be determined, to be sure that cDNA concentration would be similar for all samples. The concentration was determined by the use of a Nanodrop® ND-1000 spectrometer (NanoDrop Technologies, USA). The concentration was measured (µg/µl) and the ratio of absorbance at 260 and 280 nm was assessed to determine the purity of RNA.
Based on the concentration of RNA present in each sample, 5 µg of RNA was reverse transcribed for about one hour at 37oC followed by inactivation at 95oC for 15 minutes and cooled on ice. The cDNA synthesis was performed in a total reaction volume of 20 µl for each sample, with a mastermix volume of 8 µl and a template volume of 12 µl where
the mastermix consisted of 4 µl 5x FS Buffer, 2 µl 0.1M DTT, 0.5 µl dNTP (20 mM), 0.5 µl Random Hexamer (1/6.25) and 1 µl Reverse transcriptase (Invitrogen, Sweden).
To verify cDNA synthesis, a control PCR followed by gel electrophoresis was performed using the same protocol as after RNA isolation. The cDNA samples were diluted to a final concentration of 5 ng/µl with autoclaved RNase free water and stored at -20oC.
Real-time PCR
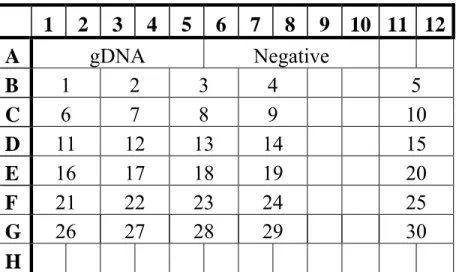
The 96-well plate panel (Fig. 10) contains cDNA from 30 different tissue samples in duplicate. Quantitative real-time PCR was used to determine the relative mRNA levels of the genes examined in different brain regions. The real-time PCR was performed in a reaction volume of 20 µl; 5 µl cDNA and 15 µl mastermix, using a MyIQ iCycler real-time detection instrument (Bio-Rad Laboratories, Sweden). SYBR Green I /fluorescein (1:1) (Invitrogen) were used as fluorescent reporters.
A mastermix was prepared according to the following recipe per plate, 850 µl of RNase-free water, 160 µl 10x Buffer, 128 µl MgCl2, 16 µl dNTP, 32 µl SYBR-Green/flourescein, 6 µl DNA Taq Polymerase and 4 µl each of primer forward and reverse. The real-time PCR settings were as follows; 95 oC for 5 min, 50 cycles at 95 oC for 15 sec, 52-60 oC (depending on each primer pair) for 15 sec, 72 oC for 20 sec and 80 cycles at 55oC for 10 sec for the melt curve analysis. A list of the forward and reverse primers for each gene is listed in Table 1 (Appendix 1).
To determine optimal annealing temperature and evaluate primer effectiveness a gradient real-time PCR was performed on a 96-well plate, where each row has different temperatures ranging from 51.0-61.0 oC. Four different primer pairs can be tested on each 96-well plate at a time. Primers were run in duplicates with genomic DNA (gDNA) or cDNA as template and RNase-free water as negative control. The mastermix for primer evaluation consisted of 297.4 µl of RNase-free water, 56 µl 10x Buffer, 44.8 µl MgCl2, 11.2 µl SYBR-Green/flourescein, 2.2 µl DNA Taq Polymerase, 1.4 µl each of primer forward and reverse and 5.6 µl dNTP. The PCR settings were as follows; 95 oC for 5 min, 50 cycles at 95 oC for 15 sec, 51-61 oC gradient for 15 sec, 72 oC for 20 sec, 70oC for 10 sec and 50 cycles at 70oC for 10 sec for the melt curve analysis.
The data provided was analyzed in iCycler™ iQ, Optical System Software, version 3.0a (Bio-Rad Laboratories, Sweden).
Data analysis
For each tissue, real-time PCR was first performed for the six housekeeping genes (HKGs). The number of selected HKGs were validated and normalization factors calculated by the use of geNorm. Real-time PCR was then performed with selected genes of interest for each tissue. The PCR efficiency was determined by the use of the LinReg program (Ramakers, Ruijter et al. 2003). The LinReg program uses linear regression to model the relationship between a dependent variable, independent variables and a random term. The PCR efficiency values provided by LinReg were then calculated by the use of Grubb’s test for outliers (an Excel macro) to determine if there were any outliers that could be excluded. Grubb's test calculates a P value only for the value furthest from the
rest. The Grubbs program provides a mean value and standard deviation that can be used for calculating corrected Ct-values which are used to calculate normalized Ct-values.
The normalized Ct-values were then used in Prism (GraphPad Prism 4) for one-way analysis of variance (one-way ANOVA) to determine if there was any significant difference in mRNA expression overall. If the p-value of the ANOVA was less than 0.05, a post-hoc test (Bonferroni`s Multiple Comparison Test) was performed to indicate significant differences between the groups.
1 2 3 4 5 6 7 8 9 10 11 12
A
gDNA Negative
B
1 2 3 4
5
C
6 7 8 9
10
D
11 12 13 14
15
E
16 17 18 19
20
F
21 22 23 24
25
G
26 27 28 29
30
H
Figure10. Plate setup. cDNA from 30 tissue samples were run in duplicate. Five positive (genomicDNA) and five negative (RNA free water) controls were run on each plate.
Results
Behavior
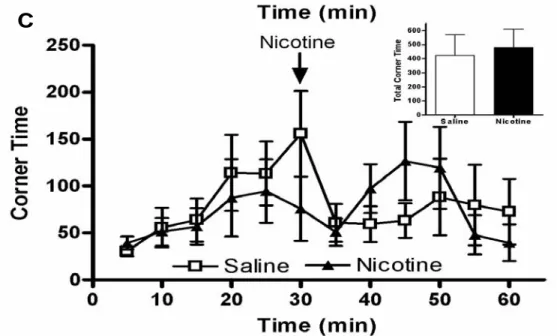
To verify that the nicotine treatment did induce locomotor sensitization, activity of the animals was tested after a challenge dose of nicotine (Fig. 11). Animals pre-treated with nicotine for 18 days had significantly increased locomotor activity and rearing activity compared to saline-treated controls, while no differences were observed for corner time.
A
B
B
C
Figure 11. Response to nicotine treatment on (A) locomotor activity, (B) rearing activity and (C) corner time measured on day 18 (n=10). The small figures inserted above each curve shows the total activity (A), total rearing activity (B) and total corner time (C) when comparing nicotine treated animals with saline treated animals.
Housekeeping gene validation and calculation of normalization factors
Five to six (Fig. 12-15) housekeeping genes were validated and stability factors were calculated for each tissue by the use of geNorm. Average stability value (M) below 1.5 was used for calculation of normalization factors.
A
Average expression stability values of remaining control genes
0.3 0.35 0.4 0.45 0.5 0.55
RPL19 b-tubulin Cyclo GAPDH H3b
b-actin <::::: Least stable genes Most stable genes ::::>
A v e rag e e x p res si on st a b il it y M B
Determination of the optimal number of control genes for normalization
0.138 0.100 0.086 0.078 0.000 0.020 0.040 0.060 0.080 0.100 0.120 0.140 0.160 V2/3 V3/4 V4/5 V5/6 Pairwise Variations
Figure 12. Determination of the optimal number of housekeeping genes for normalization in the nucleus accumbens. (A) The average stability values M and (B) the pairwise variation (vn/n) analysis to determine the number of housekeeping genes required for accurate normalization (calculated by geNorm). All six housekeeping genes were used for calculations of normalization factors.
A
Average expression stability values of remaining control genes
0.3 0.35 0.4 0.45 0.5 0.55 0.6
b-tubulin b-actin RPL19 H3b Cyclo
GAPDH <::::: Least stable genes Most stable genes ::::>
A v e rag e e x p res si on st a b il it y M B
Determination of the optimal number of control genes for normalization
0.114 0.110 0.101 0.103 0.090 0.095 0.100 0.105 0.110 0.115 0.120 V2/3 V3/4 V4/5 V5/6 Pairwise Variations
Figure 13. Determination of the optimal number of housekeeping genes for normalization in the caudate putamen. The average stability values M and (B) the pairwise variation (vn/n) analysis to determine the number of housekeeping genes required for accurate normalization (calculated by geNorm). Five housekeeping genes were used for calculations of normalization factors, β-tubulin was excluded.
A
Average expression stability values of remaining control genes
0.2 0.21 0.22 0.23 0.24 0.25 0.26 0.27 0.28
RPL19 b-tubulin H3b Cyclo b-actin
GAPDH <::::: Least stable genes Most stable genes ::::>
A v e rag e e x p res si on st a b il it y M B
Determination of the optimal number of control genes for normalization
0.066 0.056 0.049 0.042 0.000 0.010 0.020 0.030 0.040 0.050 0.060 0.070 V2/3 V3/4 V4/5 V5/6 Pairwise Variations
Figure 14. Determination of the optimal number of housekeeping genes for normalization in the prefrontal cortex. A) The average stability values M and (B) the pairwise variation (vn/n) analysis to determine the number of housekeeping genes required for accurate normalization (calculated by geNorm). All six housekeeping genes were used for calculations of normalization factors.
A
Average expression stability values of remaining control genes
0.3 0.32 0.34 0.36 0.38 0.4 0.42 0.44 0.46 0.48 0.5
GAPDH Cyclo b-actin RPL19 H3b
b-tubulin <::::: Least stable genes Most stable genes ::::>
A v e ra g e e x p re ss io n st a b ility M B
Determination of the optimal number of control genes for normalization
0.129 0.094 0.094 0.072 0.000 0.020 0.040 0.060 0.080 0.100 0.120 0.140 V2/3 V3/4 V4/5 V5/6 Pairwise Variations
Figure 15. Determination of the optimal number of housekeeping genes for normalization in the medial prefrontal cortex. (A) The average stability values M and (B) the pairwise variation (vn/n) analysis to determine the number of housekeeping genes required for accurate normalization (calculated by geNorm). All six housekeeping genes were used for calculations of normalization factors.
Effects of nicotine and hexamethonium on nAChRs
Administration of nicotine and hexamethonium had no significant effect on mRNA expression on two of the nAChR subunits nAChR α4 and nAChR α7, in all of the four brain areas; nucleus accumbens (Figure 16A: α4 F2,27=0.027; p=0.97 and 16B: α7 F2,27: 0.31; p=0.73), caudate putamen (Figure 17A: α4 F2,27: 0.15; p=0.86 and 17B: α7 F2,27=0.44; p=0.65), prefrontal cortex (Figure 18A: α4 F2,27=0.54; p=0.59 and 18B: α7 F2,27=1.17; p=0.85) and medial prefrontal cortex (Figure 19: α4 F2,26=0.006; p=0.99). No result was obtained for the α7 receptor in the medial prefrontal cortex because this receptor is not expressed in significant amount in this brain tissue.
nAChRα4
Saline Nicotine Hexamethonium
0 20 40 60 80 100 120 % o f S a lin e nAChRα7
Saline Nicotine Hexamethonium
0 20 40 60 80 100 120 % o f S a lin e A B
Figure 16. Nicotinic acetylcholine receptor subunit expression in the nucleus accumbens. There was no significant difference in mRNA expression for (A) nAChR α4 or (B) nAChR α7 in either nicotine or hexamethonium treated animals relative to saline treated animals.
nAChRα4
Saline Nicotine Hexamethonium 0 20 40 60 80 100 120 140 % o f S a lin e nAChRα7
Saline Nicotine Hexamethonium 0 20 40 60 80 100 120 140 % o f S a lin e A B
Figure 17. Nicotinic acetylcholine receptor subunit expression in the caudate putamen. There was no significant difference in mRNA expression for (A) nAChR α4 or (B) nAChR α7 in either nicotine or hexamethonium treated animals relative to saline treated animals.
nAChRα4
Saline Nicotine Hexamethonium 0 20 40 60 80 100 120 % of S al ine nAChRα7
Saline Nicotine Hexamethonium 0 20 40 60 80 100 120 % o f S a lin e A B
Figure 18. Nicotinic acetylcholine receptor subunit expression in the prefrontal cortex. There was no significant difference in mRNA expression for (A) nAChR α4 or (B) nAChR α7 in either nicotine or hexamethonium treated animals relative to saline treated animals.
nAChRα4
Saline Nicotine Hexamethonium 0 20 40 60 80 100 120 % of S al ine
Figure 19. Nicotinic acetylcholine receptor subunit expression in the medial prefrontal cortex. There was no significant difference in mRNA expression for nAChR α4 in either nicotine or hexamethonium treated animals relative to saline treated animals.
Effects of nicotine and hexamethonium on GABA
Areceptors
Compared to the saline group, the GABAA subunit α1 was significantly increased (Fig. 20A: F2,27=4.19; p=0.027: Bonferroni`s post-hoc test p<0.05) in the nucleus accumbens following nicotine administration, whereas the other subtypes; α3 (Fig. 20B: F2,27= 2.77; p=0.081), α4 (Fig 20C: F2,27= 0.63; p=0.54) and α5 (Fig. 20D: F2,27=0.57; p=0.57) were unaffected by both nicotine and hexamethonium administration.
GABAAα1
Sal ine Nicotine Hexam ethonium 0 25 50 75 100 125 150 175 % o f S a lin e * GABAAα3
Sal ine Nicotine Hexam ethoni um 0 25 50 75 100 125 150 % o f S a lin e GABAAα4
Sal ine Nicotine Hexam ethoni um 0 25 50 75 100 125 % of S a line GABAAα5
Sal ine Nicotine Hexam ethoni um 0 25 50 75 100 125 % of S a line A B C D
Figure 20. GABA receptor subunit expression in the nucleus accumbens. There was a significant increase in mRNA expression for (A) GABAA α1 in nicotine treated animals relative to the saline treated animals,
but no significant difference for (B) GABAA α3 (C) GABAA α4 or (D) GABAA α5 in either nicotine or
hexamethonium treated animals relative to saline treated animals. *p<0.05 Bonferroni's Multiple Comparison Test.
Both nicotine and hexamethonium administration had little effect on mRNA expression in the caudate putamen of GABAA subunits α1 (Fig. 21A: F2,27=0.21; p=0.81), α3 (Fig. 21B: F2,27=1.53; p=0.23), α4 (Fig. 21C: F2,27=1.01; p=0.38) and α5 (Fig. 21D: F2,27=0.04; p=0.95).
GABAAα1
Saline Nicotine Hexamethonium 0 25 50 75 100 125 % of Sal ine GABAAα3
Saline Nicotine Hexamethonium 0 25 50 75 100 125 150 % of Sal ine GABAAα4
Saline Nicotine Hexamethonium 0 25 50 75 100 125 150 % o f S a lin e GABAAα5
Saline Nicotine Hexamethonium 0 25 50 75 100 125 % o f S a lin e A B C D
Figure 21. GABA receptor subunit expression in the caudate putamen. There was no significant difference in mRNA expression for (A) GABAA α1, (B) GABAA α3 (C) GABAA α4 or (D) GABAA α5 in either
Similarly in the prefrontal cortex, no significant differences in mRNA expression across the treatment groups of the GABAA subunits; α1 (Fig. 22A: F2,27=2.2; p=0.13), α3 (Fig. 22B: F2,27=1.58; p=0.22), α4 (Fig. 22C: F2,27=1.27; p=0.298) and α5 (Fig. 22 D: F2,27=0.04; p=0.96) were observed.
GABAAα1
Saline Nicotine Hexam ethonium 0 25 50 75 100 125 150 175 % of S al ine GABAAα3
Saline Nicotine Hexamethonium 0 25 50 75 100 125 150 175 200 % of S al ine GABAAα4
Saline Nicotine Hexam ethonium 0 50 100 150 200 250 % o f S a lin e GABAAα5
Saline Nicotine Hexamethonium 0 25 50 75 100 % o f S a lin e A B C D
Figure 22. GABA receptor subunit expression in the prefrontal cortex. There was no significant difference in mRNA expression for (A) GABAA α1, (B) GABAA α3 (C) GABAA α4 or (D) GABAA α5 in either
In the medial prefrontal cortex, there were also no significant changes in mRNA expression across the three groups of GABAA subunits; α1 (Fig. 23A: F2,26=0.08; p=0.93), α3 (Fig. 23: F2,26=2.33; p=0.12), α4 (Fig. 23C: F2,26=1.10; p=0.35) and α5 (Fig. 23 D: F2,26=0.39; p=0.68).
GABAAα1
Saline Nicotine Hexamethonium 0 25 50 75 100 125 % o f S a lin e GABAAα3
Saline Nicotine Hexamethonium 0 25 50 75 100 125 % o f S a lin e GABAAα4
Sal ine Nicotine Hexamethoni um 0 25 50 75 100 125 % o f S a lin e GABAAα5
Saline Nicotine Hexamethonium 0 25 50 75 100 125 % o f S a lin e A B C D
Figure 23. GABA receptor subunit expression in the medial prefrontal cortex. There was no significant difference in mRNA expression for (A) GABAA α1, (B) GABAA α3 (C) GABAA α4 or (D) GABAA α5 in
Effects on nicotine and hexamethonium on GABA transporter
expression
In the nucleus accumbens, nicotine and hexamethonium administration had no significant effect on expression of the GABA transporter GAT-1 (Fig. 24A: F2,27=1.47; p=0.25). However, nicotine significantly increased expression of GAT-3 (Fig. 24B: F2,27=3.41; p=0.048).
GAT-1
Saline Nicotine Hexamethonium
0 25 50 75 100 125 150 % o f S a lin e GAT-3
Saline Nicotine Hexamethonium
0 50 100 150 200 250 300 % o f S a lin e * A B
Figure 24. GAT transporter expression in the nucleus accumbens. There was no significant difference in mRNA expression for (A) GAT-1 in either nicotine or hexamethonium treated animals, but (B) GAT-3 was significantly increased in nicotine treated animals relative to saline treated animals. *p<0.05 Bonferroni's Multiple Comparison Test.
In the caudate putamen, none of the administered drugs affected expression of GAT-1 (Fig. 25A: F2,27=1.93; p=0.17) or GAT-3 (Fig. 25B: F2,27=0.58; p=0.61).
GAT-1
Saline Nicotine Hexamethonium 0 25 50 75 100 125 150 175 % of S a line GAT-3
Saline Nicotine Hexamethonium 0 25 50 75 100 125 150 % of S a line A B
Figure 25. GAT transporter expression in the caudate putamen. There was no significant difference in mRNA expression for (A) GAT-1 or (B) GAT-3 for either nicotine or hexamethonium treated animals relative to saline treated animals.
In the prefrontal cortex, none of the administered drugs affected GAT-1 (Fig. 26A: F2,27=0.12; p=0.89) or GAT-3 (Fig. 26B: F2,27=0.61; p=0.51) expression.
GAT-1
Sali ne Nicotine Hexam ethoni um 0 25 50 75 100 125 % of Sal ine GAT-3
Saline Ni cotine Hexam ethonium 0 25 50 75 100 125 % of Sal ine A B
Figure 26. GAT transporter expression in the prefrontal cortex. There was no significant difference in mRNA expression for (A) GAT-1 or (B) GAT-3 in either nicotine or hexamethonium treated animals relative to saline treated animals.
One nicotine animal was excluded for GAT-1 in medial prefrontal cortex according to the Grubbs test for outliers. Nicotine and hexamethonium administration significantly decreased expression of 1 (Fig. 27 A: F2,26=4.69; p=0.018) but did not effect GAT-3 (Fig. 27 B: F2,26=0.49; p=0.62) compared to saline treated animals.
GAT-1
Sal ine Nicoti ne Hexamethoni um 0 25 50 75 100 125 % o f S a lin e * * GAT-3
Sali ne Nicoti ne Hexamethoni um 0 25 50 75 100 125 % o f S a lin e A B
Figure 27. GAT transporter expression in the medial prefrontal cortex. There was a significant decrease in mRNA expression for (A) GAT-1 in both nicotine and hexamethonium treated animals (*p<0.05 Bonferroni's Multiple Comparison Test), but no significant difference in expression for (B) GAT-3 relative to saline treated animals.
Effects of nicotine and hexamethonium on CART
Nicotine and hexamethonium treatment did not significantly change mRNA expression in the nucleus accumbens (Fig. 28: F2,27=0.11; p=0.899), caudate putamen (Fig. 29: F2,27= 0.65; p=0.529) or prefrontal cortex (Fig. 30: F2,27= 0.19; p=0.83). However, nicotine significantly decreased expression of CART mRNA in the medial prefrontal cortex (Fig. 31: F2,27= 4.65; p=0.018: Bonferroni´s post-hoc test p<0.05).
CART
Saline Nicotine Hexamethonium
0 20 40 60 80 100 120 % o f S a lin e
Figure 28. CART mRNA expression in the nucleus accumbens. There was no significant difference in mRNA expression for CART in either nicotine or hexamethonium treated animals relative to saline treated animals.
CART
Saline Nicotine Hexamethonium
0 20 40 60 80 100 120 140 % o f S a lin e
Figure 29. CART mRNA expression in the caudate putamen. There was no significant difference in mRNA expression for CART in either nicotine or hexamethonium treatment animals relative to saline treatment animals.
CART
Saline Nicotine Hexamethonium
0 20 40 60 80 100 120 % o f S a lin e
Figure 30. CART mRNA expression in the prefrontal cortex. There was no significant difference in mRNA expression for CART in either nicotine or hexamethonium treated animals relative to saline treated animals.
CART
Saline Nicotine Hexamethonium 0 20 40 60 80 100 120 % o f S a lin e *
Figure 31. CART mRNA expression in the medial prefrontal cortex. There was a significant decrease in mRNA expression for CART in nicotine treated animals but not in hexamethonium treated animals relative to saline treated animals. *p<0.05 Bonferroni's Multiple Comparison Test.
Effects of nicotine and hexamethonium on adrenoceptors
In the prefrontal cortex, there was no significant difference between the three treatments for the adrenoceptor subtypes α1A (Fig. 32A: F2,27= 1.26; p=0.299) and α1B (Fig. 32B: F2,27= 0.23; p=0.795). However, a significant increase of α2A (Fig. 32C: F2,27= 4.69; p=0.018: Bonferroni`s post-hoc test p<0.05) was observed in the hexamethonium group.
α1A
Saline Nicotine Hexamethonium 0 20 40 60 80 100 120 % of S al ine α1B
Saline Nicotine Hexamethonium 0 20 40 60 80 100 120 % of S al ine α2A
Saline Nicotine Hexamethonium 0 20 40 60 80 100 120 140 160 % of S al ine * A B C
Figure 32. Adrenoceptor subtype expression in the prefrontal cortex. There was no significant difference in mRNA expression for (A) α 1A or (B) α 1B in either nicotine or hexamethonium treated animals relative to saline treated animals. There was however, a significant increase for (C) α2A in hexamethonium treated animals relative to saline treated animals. *p<0.05 Bonferroni's Multiple Comparison Test.
In the medial prefrontal cortex, there was no significant difference between the three treatments for the adrenoceptor subtypes α1A (Fig. 33A: F2,26= 0.14; p=0.0.871) and α1B (Fig. 33B: F2,26= 0.26; p=0.77) or α2A (Fig. 33C: F2,26= 0.81; p=0.456).
α1A
Saline Nicotine Hexamethonium 0 20 40 60 80 100 120 % of S al ine α1B
Saline Nicotine Hexamethonium 0 20 40 60 80 100 120 140 % of S al ine α2A
Saline Nicotine Hexamethonium 0 20 40 60 80 100 120 % o f S a lin e A B C
Figure 33. Adrenoceptor subtype expression in the medial prefrontal cortex. There was no significant difference in mRNA expression for (A) α1A, (B) α1B or (C) α2A in either nicotine or hexamethonium treated animals relative to saline treated animals.
Effects of nicotine and hexamethonium on serotonin receptors
There was no significant difference induced in 5-HT3 mRNA expression in either prefrontal cortex (Fig. 34: F2,27= 0.89; p=0.421) or medial prefrontal cortex (Fig. 35: F2,26=1.07; p=0.3579).
5-HT3
Saline Nicotine Hexamethonium 0 20 40 60 80 100 120 % o f S a lin e
Figure 34. Serotonin receptor subtype expression in prefrontal cortex. There was no significant difference in mRNA expression for 5-HT3 in either nicotine or hexamethonium treated animals relative to saline
treated animals.
5-HT3
Saline Nicotine Hexamethonium 0 20 40 60 80 100 120 % of Sal ine
Figure 35. Serotonin receptor subtype expression in medial prefrontal cortex. There was no significant difference in mRNA expression for 5-HT3 in either nicotine or hexamethonium treated animals relative to
Discussion
Effects of nicotine on behavior
The inset of Figure (11) shows the total activity for the final 30 minutes of measurement. The challenge dose of nicotine induced twice as much locomotor activity in nicotine pre-treated animals compared to the saline group and this indicates a clear development of sensitization to nicotine.The development of locomotor induced sensitization has
previously been seen by Alexander Kosowski (Kosowski and Liljeqvist 2005) and Vezina (Vezina and McGehee et al. 2007) among others. Therefore, changes in the mRNA expression are likely to be associated with the development of sensitization.
Effects of nicotine and hexamethonium on nAChRs
The two subtypes of nicotinic receptors that were tested are the most abundant nicotinic receptors in the brain. As nicotine binds specifically to these receptors, a change of mRNA expression could have occurred. However, we found no significant difference in mRNA expression in either of the two nicotinic subtype receptors in the different brain areas (Fig. 16-19). It has previously been shown that chronic nicotine treatment does not significantly change mRNA expression (Kawai and Berg 2001). However, it has been shown that the proteins of neuronal nicotinic subtypes at the cell surface are upregulated by chronic exposure to nicotine (Clementi, Fornasari et al. 2000; Buisson and Bertrand 2002). The upregulation at the cell surface between the different subtypes seems also to be dependent on the concentration of nicotine in the blood. When comparing the α4β2-subunit with the α7-α4β2-subunit, the α4β2-α4β2-subunit is upregulated by a smaller blood nicotine concentration then the α7-subunit (Clementi, Fornasari et al. 2000).
Due to the fact that there is no significant change in mRNA expression and still an upregulation of nicotinic receptor subtypes at the cell surface, it is suggested that the upregulation is a post-transcriptional mechanism affecting only the protein (Kawai and Berg 2001; Wang and Sun 2005). Another possibility is that there could be a pre-existing pool of receptors that could supply the cell surface with more receptors when needed. This was proven not to be the case because receptor upregulation was blocked when administrating tunicamycin which is a protein synthesis and protein glycosylation blocker (Wang and Sun 2005).
Hexamethonium did not significantly change mRNA expression either. This result was expected as this substance does not easily cross the blood-brain barrier.
Effects of nicotine and hexamethonium on the GABA system
GABA is the main inhibitory transmitter in the brain and it has previously been shown that nicotine can affect the release of various neurotransmitters including GABA (Clementi, Fornasari et al. 2000).
The GABAA receptors containing the α1 subunit mediate sedation, α3 has been shown to provide anxiolysis and α5 provide memory enhancement (Rudolph and Mohler 2006). The α4 subunit is insensitive to diazepam in contrast to α1, α2, α3 and α5 which are highly sensitive to diazepam. Upregulation of α4 subunit has shown to be implicated in epilepsy (Lagrange, Botzolakis et al. 2007). There where no significant differences in mRNA expression in the different subunits of caudate putamen, prefrontal cortex or medial prefrontal cortex (Fig. 21-23). However, in the nucleus accumbens a significant increase of GABAA α1 due to nicotine exposure was shown (Fig. 20A).
GABA transporters (GAT) transport released GABA from the synaptic cleft to pre– and post- synaptic neurons or to glia cells. GAT-1 is the most abundant of all GABA trasnporters and is localized on pre-synaptically neurons and on glia cells, whereas GAT-3 is localized only on glia cells. GAT-1 and GAT-GAT-3 have different affinities for GABA (GAT-3 has the highest) and they are largely dependent on expression systems (Dalby 2003). We found that there was a significant increase in mRNA expression of GAT-3 in the nucleus accumbens (Fig. 24A). Even hexamethonium exerted some effect on this transporter even though it was not significant (Fig. 24B). The results also showed that there was a significant decrease of GAT-1 in medial prefrontal cortex in nicotine and hexamethonium treated animals (Fig. 27A).
Focusing on the nucleus accumbens, mRNA expression of both the GABAA α1 subunit and the high-affinity GAT-3 transporter was upregulated by repeated nicotine treatment (Fig. 20A och 24B). Therefore, the GABA system is apparently changed by nicotine. An increase in GABAA α1 suggests a presence of more GABA receptors in the nucleus accumbens which could lead to additional influx of Cl-ions into the neurons. This would hyperpolarize the neuron and make it less likely to fire. These hyperpolarized neurons could be those interneurons linking back to the ventral tegmental area which would ultimately increase activation of the reward pathway (i.e. a decrease in inhibition of dopaminergic neurons in the VTA). Upregulation of the GAT-3 transporter could be an adaptation to counteract excess release of GABA. This would be similar to the upregulation of glutamate transporters to counteract glutamate release (Pickering, Gustafsson et al. 2006). Overall, these results may explain how the reward pathway becomes sensitized following repeated nicotine injections.
Effects of nicotine and hexamethonium on CART and adrenoceptors
It has been shown that nicotine administration affects CART mRNA expression in the hypothalamus (Kramer, Kramer et al. 2007). According to the results of our study, nicotine also affects mRNA expression in the medial prefrontal cortex, since nicotine administration significantly decreased CART mRNA expression (Fig. 31). Despite its stimulant effects, nicotine does not affect CART mRNA expression in the same way as cocaine or other psychostimulants which increase CART mRNA expression (Jaworski and Jones 2006).
The α1-adrenergic receptors play an important role in the regulation of physiological responses mediated by norepinephrine and epinephrine, particularly in the cardiovascular system (Chen and Minneman 2005) and they are also involved in the locomotor effects of cocaine (Drouin, Darracq et al. 2002).
There where no significant different expression of the three adrenergic subtypes in the prefrontal cortex and medial prefrontal cortex (Fig. 32-33). Only α2A was significantly increased in the prefrontal cortex followed by hexamethonium administration (Fig. 32C). α2 receptors inhibit noradrenaline and acetylcholine transmitter release from autonomic nerves (Rang, Dale et al. 2007). Therefore a blocking of α2A following hexamethonium administration, most likely by a peripheral mechanism, would give an excitatory effect because more noradrenaline and acetylcholine would be released. An upregulation of expression may be to compensate for the loss of functionally receptors caused by receptor antagonism.
Effects of nicotine and hexamethonium on serotonin receptors
The functional relevance of the different serotonin receptor compositions has not yet been clarified. Agonists binding to 5-HT3 receptor give effects like nausea and anxiety while an antagonist gives anxiolytic effects (Faerber, Drechsler et al. 2007). The results of our study showed that there were no significant differences in mRNA expression of 5-HT3 in either the prefrontal cortex or the medial prefrontal cortex (Fig. 34-35). Nicotine and hexamethonium may not produce significant increases or decreases in serotonin levels or the changes occur in other 5-HT subtypes or at the protein level.
Future perspectives
In summary our study indicates that the GABA system is changed by nicotine administation and this may explain how the reward pathway becomes sensitized
following repeated nicotine administration. Our study also confirm earlier studies that the mRNA expression of nicotine receptors are highly unaffected by the administation of nicotine or hexamethonium even though it has been shown that there is an increase in receptor density at the cell surface following nicotine administration.
To confirm that the expression of RNA from the genes studied reflects the biological activity of the gene products it would be interesting to investigate the levels and the activities of the proteins encoded by the genes studied.
Further analysis would be to perform radioligand binding which provides information on the number of receptors on cell surface (the number of binding sites), and their affinity and accessibility for various drugs.
Acknowledgements
First of all I would like to thank Helgi B. Schiöth for making this project possible.
A special thanks to my supervisor Dr. Christopher Pickering for his support and encouragingly words throughout the entire project. I am especially grateful for all the help in making this thesis as good as possible.
I would also like to thank Olga Stephansson for all her help in teaching me the experimental methods and all the others in the department for being helpful and creating a pleasant atmosphere.
Last, but certainly not least, a huge thanks to Elin Wikman and Kristin Brohmé with special thanks to Thomas Sievertsson for all the fun times together.
References
Alwine, J. C., D. J. Kemp, et al. (1977). "Method for detection of specific RNAs in agarose gels by transfer to diazobenzyloxymethyl-paper and hybridization with DNA probes." Proc Natl Acad Sci U S A 74(12): 5350-4.
Arnsten, A. F., R. Mathew, et al. (1999). "Alpha-1 noradrenergic receptor stimulation impairs prefrontal cortical cognitive function." Biol Psychiatry 45(1): 26-31. Balfour, D. J., M. E. Benwell, et al. (1998). "Sensitization of the mesoaccumbens
dopamine response to nicotine." Pharmacol Biochem Behav 59(4): 1021-30. Benarroch, E. E. (2007). "GABAA receptor heterogeneity, function, and implications for
epilepsy." Neurology 68(8): 612-4.
Bengtsson, M., H. J. Karlsson, et al. (2003). "A new minor groove binding asymmetric cyanine reporter dye for real-time PCR." Nucleic Acids Res 31(8): e45.
Biala, G. (2003). "Calcium channel antagonists suppress nicotine-induced place preference and locomotor sensitization in rodents." Pol J Pharmacol 55(3): 327-35.
Borden, L. A. (1996). "GABA transporter heterogeneity: pharmacology and cellular localization." Neurochem Int 29(4): 335-56.
Buisson, B. and D. Bertrand (2002). "Nicotine addiction: the possible role of functional upregulation." Trends Pharmacol Sci 23(3): 130-6.
Campagna-Slater, V. and D. F. Weaver (2007). "Molecular modelling of the GABAA ion channel protein." J Mol Graph Model 25(5): 721-30.
Chen, N. H., M. E. Reith, et al. (2004). "Synaptic uptake and beyond: the sodium- and chloride-dependent neurotransmitter transporter family SLC6." Pflugers Arch
447(5): 519-31.
Chen, Z. J. and K. P. Minneman (2005). "Recent progress in alpha1-adrenergic receptor research." Acta Pharmacol Sin 26(11): 1281-7.
Clementi, F., D. Fornasari, et al. (2000). "Neuronal nicotinic acetylcholine receptors: from structure to therapeutics." Trends Pharmacol Sci 21(2): 35-37.
Conti, F., A. Minelli, et al. (2004). "GABA transporters in the mammalian cerebral cortex: localization, development and pathological implications." Brain Res Brain Res Rev 45(3): 196-212.
Dalby, N. O. (2003). "Inhibition of gamma-aminobutyric acid uptake: anatomy, physiology and effects against epileptic seizures." Eur J Pharmacol 479(1-3): 127-37.
Dani, J. A. and S. Heinemann (1996). "Molecular and cellular aspects of nicotine abuse." Neuron 16(5): 905-8.
Davies, M. (2003). "The role of GABAA receptors in mediating the effects of alcohol in the central nervous system." J Psychiatry Neurosci 28(4): 263-74.
Di Chiara, G. (2000). "Role of dopamine in the behavioural actions of nicotine related to addiction." Eur J Pharmacol 393(1-3): 295-314.
DiFranza, J. R. and R. J. Wellman (2006). "Sensitization to nicotine: How the animal literature
might inform future human research." Official journal of the Society for Research on Nicotine and Tobacco 9(1): 13.