Research
Identifi cation of Brittle Deformation
Zones and Weakness Zones
2012:71
SSM perspective
Background
In preparation for the review of Swedish Nuclear Fuel and Waste Manage-ment Company’s (SKB) license application for disposal of spent nuclear fuel, Swedish Radiation Safety Authority (SSM) is conducting studies to evaluate the performance of the multi-barrier principle on which the KBS-3 concept is based. Copper canisters containing the spent nuclear fuel are placed into granitic bedrock at about 500 m depth and embed-ded in bentonite clay. Thus, the rock, the clay and the copper canister are acting as barriers in order to retard the possibility of spent fuel to escape the repository and reach the biosphere.
The proposed area for the repository is surrounded and affected by de-formation zones. Knowledge of the zones at depth is obtained from drill cores. No common methodology of identification of the brittle deforma-tion zones exists. The concepts of “respect distances” and “full perimeter intersection criteria” developed by SKB are based on the understanding of fracture extension and the definition of deformation zones. A common methodology in identification of deformation zones is therefore desirable. Objectives
For SSM, the goal of this study is to improve the scientific knowledge of identification of deformation zones from drill cores. The purpose of this study is also to draw attention to the different viewpoints in the defini-tions of deformation zones and to the different classification systems. Results
This study showed that an analyzing tool for characterization of brittle de-formation zones is needed. It also showed that a methodology of defining different parts of the zones is needed. One method in identifying brittle deformation zones is suggested in this study. It is based on the concept of clustering fractures due to their separation seen from the drill core. The methodology is based on fixed steps and gives a good resolution. While comparing this methodology with others good consistency is shown. Need for further research
Further research in the area of identification and definition of deforma-tion zones is desirable.
Project information
Contact person SSM: Lena Sonnerfelt Reference: SSM 2010/3895
2012:71
Author: Sven A. Tirén
Geosigma AB, Uppsala, Sweden
Identification of Brittle Deformation
Zones and Weakness Zones
This report concerns a study which has been conducted for the Swedish Radiation Safety Authority, SSM. The conclusions and view-points presented in the report are those of the author/authors and do not necessarily coincide with those of the SSM.
Contents
1. Introduction ... 9
Objective of the study ... 9
Organization of the report ... 9
2. Classification of brittle structures in boreholes – Methodology applied in this study ... 11
Character of deformation zones ... 11
Brittle deformation zones and weakness zones ... 12
Base data for identification of brittle deformation and weakness zones ... 12
The framework of brittle structures in the bedrock ... 14
Nomenclature ... 14
Review of SKB Geological Single Hole Interpretations and location of zones ... 17
Classification system for identification of brittle deformation zones and weakness zones in boreholes ... 19
The objective of the classification system ... 20
Input data ... 20
Systematic and uniform classification... 20
Clear steps in the classification process ... 20
Sensitivity tests ... 21
Presentation of results ... 21
Step by step performance – identification of sections with increased fracturing in boreholes ... 21
Input data ... 24
Data handling ... 24
Performance ... 24
3. Description of borehole data and zone intersections ... 27
Investigated area – structures and boreholes ... 28
Character of studied borehole sections ... 34
KFM01B - section 15 to 120 m borehole length ... 34
KFM01C - section 0 to 150 m borehole length ... 66
KFM02A - section 350 to 490 m borehole length ... 82
KFM02B - section 360 to 480 m borehole length ... 96
KFM04A - section 160 to 280 m borehole length ... 111
KFM05A - section 100 to 165 m borehole length ... 128
KFM10A - section 350 to 500 m borehole length ... 142
Comments ... 156
Character of zone ZFMA2 ... 156
Fracturing in Forsmark reflected by seven borehole sections ... 156
The boundaries of zone ZFMA2 ... 157
Zone ZFMA2 – its variability in character ... 157
Zone ZFMA2 – short summary ... 160
4. Discussion ... 161
Definition of deformation zones... 161
Sensitivity test ... 162
Fracture distribution ... 162
Character of brittle structures in sections of increased deformation 163 Zone ZFMA2 in KFM10A ... 168
From cluster classification to identification of brittle deformation
zones ... 177
Fracture clusters ... 178
Clusters of fractures and brittle deformation zones ... 184
Fractures and borehole geophysics ... 195
Selection of borehole KFM09A ... 195
Structural description of the rock penetrated by borehole KFM09A 196 Structural and geophysical parameters included in the test ... 197
Discrete fractures and geophysical clusters ... 198
Geophysical clusters and fracture clusters ... 200
Tectonic zones and geophysical clusters ... 202
Alteration of bedrock and geophysical clusters ... 202
Interpreted brittle deformation zones and geophysical clusters ... 203
Summary ... 203
5. Results and conclusions ... 211
Detection of zones ... 211
Proposed methodology ... 212
A gently inclined brittle deformation zone and associated weakness zones ... 220
Abstract
In cratonic areas such as Scandinavia, brittle deformation zones formed in the crystalline Precambrian basement rocks have in most cases a long and sometime complex history. The history may contain healing events and events of reactivation. This implies that the present state of a brittle defor-mation zone differs from when it was formed. Consequently, parts of the brittle deformation zone may be stiff, while other parts can be soft and out-line weakness zones. The objective of this study is to locate brittle defor-mation zones and weakness zones, mainly based on geological borehole data (core log data).
In order to do this there must be applicable definitions of the concepts of brittle deformation zones and weakness zones as well as systematic ap-proaches to identify such zones. Existing definitions of the two types of zone have been applied. However, it was found that there is a need for a systemat-ic methodology to locate and describe the zones. To develop such a meth-odology, which aims to identify and characterize brittle deformation zones and weakness zones in analogous ways, both types of zones are here treated to consist of core/-s and disturbed zones. Furthermore, complementary in-formation needed regarding zones include criteria for the location of the boundary between the core zone and the disturbed zone as well as between the disturbed zone and the host rock.
A fundamental part in the identification of brittle deformation zones and weakness zones is how to describe the intensity of brittle deformation asso-ciated with the zones. In this study, the fracture frequency is not calculated by dividing the borehole (scan line) into fixed length intervals. Instead, the separation between fractures along boreholes is used together with the num-ber of fractures needed to outline a zone, i.e. to form a cluster of fractures. The approach developed in this study to locate and describe brittle defor-mation zones and weakness zones consist of six steps, all bringing basic data along, and many of the steps involve distinct questions giving a transparency to the process:
Step 1. Sorting of base data (regarding discrete fractures – while features mapped as zones are excluded at this stage, e.g. zones of crushed rock). All data are brought along as a general reference. Perform selection of groups of data to outline brittle deformation zones and weakness zones.
Step 2. Calculate separation of fractures for selected groups of fractures and all fractures. Select cluster parameters (minimum mutual separation of frac-tures and number of fracfrac-tures to outline core zones and disturbed zones – two categories of clusters). Identify clusters of fractures.
Step 3. Sensitivity test. What are the effects of alternative selections of input data and cluster parameters?
Step 4. Locate brittle deformation zones and weakness zones and their inter-nal parts (core/-s and disturbed zones). This is an interactive repetitive pro-cess consisting of merging of clusters. Present the applied basic concept for merging clusters (clusters appearing in swarms, for example widths of clus-ters in relation to separations) and the basis for stopping the process (mini-mum fracture frequency in the core zone/-s and disturbed zones) unless it stops by itself. Give also the premises to locate boundaries of different parts of zones. Start with merging clusters outlining zone core/-s. Introduce sec-tions of intense deformation such as crushed rock in the core zones. Merge sections that represent disturbed zones. Is the result plausible?
Step 5. Present the results by, for example, visualization (composite logs showing the relation between brittle deformation zone, weakness zones and other geological features /such as ductile deformation, alteration/, indicated groundwater flow and geophysics) as well as in tables and text.
Step 6. Compile the characteristics of different sets of zones. This is part of a learning process that forms the basis for three-dimensional modelling of structures and tests the general knowledge of a site by comparing predictions versus outcome of further investigations/excavations.
The information used in this study is mainly geological borehole information acquired by the Swedish Nuclear Fuel and Management Co (SKB) during their detailed characterization of the Forsmark site located in north-northeastern Uppland, eastern central Sweden. The present investigation has used selected borehole section, especially in seven boreholes penetrating a gently inclined zone at different depths, from shallow to depths of more than 300 m.
Key words: fracture, fracture characteristics, core log, brittle deformation zone, weakness zone, definition, nomenclature and zone identification.
Kortfattad sammanfattning
Föreliggande studie har som syfte att ge en fristående beskrivning av struk-turer undersökta med kärnborrhål. För att få en översikt i hur strukstruk-turer kan variera i karaktär utmed dess utbredning är det en fördel att de studerade strukturerna genomborras av ett flertal borrhål.
Denna studie omfattar bland annat en av de flacka spröda deformationszo-nerna som identifierats vid Svensk Kärnbränslehantering ABs (SKB) plats-undersökning i Forsmarksområdet beläget i nordöstra Uppland. Zonen (SKBs benämning är ZFMA2) har genomborrats av sju kärnborrhål och har en lateral utbredning i sidled på cirka 4 km vid markytan samt stupar flackt (cirka 25°) söderut. Dess mäktighet bedöms variera mellan 9 till 45 m med en medeltjocklek på 23 m. Dominerande sprickor i zonen är subhorisontella. Att utföra en jämförande studie, dvs. i detta fall en jämförelse av egenskaper hos olika delar av ett objekt, kräver en systematisk analysmetodik samt att objektet skall vara klart definierat. Med det sistnämnda menas i detta fall att termen spröd deformationszon skall vara klart definierad. Detta är speciellt viktigt i en geologisk miljö där objektet självt, den studerade spröda deform-ationszonen, ej är allena förekommande utan omges av ett geologiskt brus av strukturer.
Definitionen av spröd deformationszon skall kunna användas för att av-gränsa zoners rumsliga utbredning och dess olika komponenters omfattning. Detta innebär att fastlägga zoners mer deformerade delar (kärna/-or) och övergångar från kärnan till det ostörda sidoberget, den så kallade övergångs-zonen eller störda övergångs-zonen. Vid tillämpandet av en given definition (t.ex. den som använts i Forsmark av SKB) framgår det att det behövs ett analysverk-tyg för att på ett reproducerbart sätt karaktärisera en spröd deformationszon och dessutom måste principer tas fram för att fastlägga var avgränsningar av zoners olika delar skall sättas.
Spröda deformationszoner i berggrunden är föränderliga och har påverkats, på ett eller annat sätt, alltsedan de bildats och kan påverkas alltjämt. Under statiska förhållanden kan man förvänta sig att zoner läks genom utfällningar i sprickor och hålrum, medan justeringar (avlastning av lagrade spänningar) kan ske då belastningen av strukturer förändras. Sådana avlastningar kan hålla delar av befintliga strukturer öppna, dvs. den svaghet i berget som finns relaterat till en struktur kan ha en annan storlek och karaktär än vad den ur-sprungliga spröda deformationszonen hade. Plana till semiplana strukturer som har signifikant lägre hållfasthet än omgivande berg anges som svaghets-zoner.
Det skulle vara fördelaktigt med en gemensam metodik för att identifiera spröda deformationszoner och svaghetszoner. Detta kan göras om spröda deformationszoner och svaghetszoner har analoga definitioner, dvs. baseras på hela eller delmängder av samma basdata samt att de två strukturerna har samma typ av intern uppbyggnad (kärna/-or samt övergångszon/störd zon). Det som skiljer de sprickgrupper som används för att identifiera spröda de-formationszoner och svaghetszoner är att i den föregående ingår öppna, par-tiellt öppna och läkta sprickor medan vid utskiljning av svaghetszoner ingår
ej sammanläkta sprickor (i Forsmarksfallet har valts att endast öppna om-vandlade sprickor skall ingå). Framtagen metodik innehåller fasta steg och dessa innehåller i sin tur tydliga valsituationer och dessa val testas i ett sepa-rat steg som omfattar känslighetsanalys.
Basprincipen för här utvecklad metodik för identifiering av spröda deformat-ionszoner och svaghetszoner vilar på identifiering av sprickkluster (anhop-ningar av sprickor) utgående från minimiseparation mellan sprickor samt lägsta antal sprickor som ett kluster skall innehålla. Vidare görs hela arbetet på så sätt att all originaldata för valda sprickgrupper följer med under ana-lysens framskridande – resultat lämnas plats för och skrivs in basdatatabel-ler. Metodiken innehåller sex steg och dessa är i stort:
1. Val av ingångsdata; innehåller analys av data för val av adekvat da-tamängd.
2. Val av klusterparametrar och lokalisering av sprickkluster: Minsta antal sprickor och minimiseparation mellan sprickor som skall ingå i två typer av kluster. Dessa två har olika minimiseparation av sprick-or för att ssprick-ortera fram zonkärnsprick-or respektive störda zo-ner/övergångszoner. Utföra beräkning av separationer, klassning av separationer och lokalisering av kluster.
3. Känslighetsanalys: Vad händer om man ändrar ingångsdata eller klusterparametrar?
4. Läge på spröda deformationszoner och svaghetszoner samt deras in-terna delar: Detta steg är en interaktiv iterativ process och kräver be-slut om premisser för att sätta yttre gräns för zoner (här har valts att den skall utgöras av ett kluster), samt villkor för att slå samman när-liggande kluster (t.ex. relation mellan klusterbredd och separation mellan intilliggande kluster). Företrädesvis slås först de kluster samman som utgör zoners kärnor (partier med krossat berg och an-nat berg omformat i samband med förkastningsrörelser tas med i detta skede) och därefter sammanbinds kluster innehållande den störda zonen/övergångszonen. Denna iterativa process avslutas då inga fler kluster kan slås samman eller då kärnzoner och störda zo-nen/övergångszonen når sina gränsvärden avseende sprickfrekven-ser. För att förenkla används här medelvärden på sprickfrekvenser i identifierade zonkärnor och störda zoner/övergångszoner över flertal avsnitt av borrkärnor (djupintervall), avsnitt som tillsammans inne-håller ett flertal lokala strukturer.
5. Sammanställning och presentation av resultat. Detta ges som tabel-ler, figurer (loggar som visar zoner i relation till olika andra geodata, t.ex. kärnförluster, förkastningsbergarter inklusive plastiska struk-turer, förekommande vittring, grundvattenflöden och geofysik) samt beskrivande text.
6. Sammanställning av egenskaper hos olika grupper (set) av zoner. Även denna del är en interaktiv del eftersom kunskapen om struk-turer är en del av en lärandeprocess. Detta underlag användes däref-ter som underlag för modellering av strukturer och vid predikdäref-tering
av utfall av ytterligare undersökningar (t.ex. borrhål eller bergbygg-nationer).
Den geologiska miljön i Forsmark avseende på spricktäthet varierar både i lateral och vertikal led. På grund av markant förhöjd allmän spricktäthet i vissa ytnära delar av berget kan det vara osäkert att bestämma läget för zo-nen ZFMA2 utgående från den generella sprickfrekvensen i berggrunden. Framtagen metodik ger i stort en god överenstämmelse mellan här framtagna och av SKB angivna bredder på zonen. Det skall noteras att den framtagna metodiken har god upplösning och är kapabel att identifiera strukturer med ringa bredd. Den största skillnaden mellan denna klassning av zoner och den som presenteras av SKB är att relativt stora delar av de spröda deformations-zonerna här klassas som zonkärnor, dvs. deformationen är relativt fokuserad. De andelar av den spröda deformationszonen ZFMA2 som kan klassas som svaghetszoner är i stort beroende på zonens djupläge i berggrunden. För ytliga lägen förekommer ett flertal svagare partier spridda inom zonen me-dan vid djupare lägen synes de svagare delarna av zonen utgöras av ett fåtal tunna strukturer (vanligen någon decimeter breda; meterbreda i extremfall).
Nyckelord: spricka, sprickkaraktär, sprickdata, spröd deformation, svaghets-zon, definition, nomenklatur, analysmetodik.
1. Introduction
The strength, deformability and hydraulic properties of a tectonic discontinu-ity in the bedrock are unlikely to be homogenous across or along the discon-tinuity. For example, consider a structure mapped as a brittle deformation zone, for which the spatial variability in properties is related to the evolution of the structure. This is reflected in the internal structural pattern in the zone and the interference with pre-existing as well as overprinting structures. In addition, the character of a tectonic discontinuity changes with time (evolu-tion) due to the interplay between sealing processes and re-activation (in-cluding all types and magnitude of differential movements). Thus, the pre-sent character of a tectonic discontinuity reflects the evolution of the struc-ture.
From a geological point of view, to locate sections with increased fracturing (potential locations of brittle deformation zones), all discrete fractures need to be considered. From a rock mechanical and hydrogeological point of view fractures parting the core are of primary interest, as they indicate fractures with low in situ cohesion. However, such fractures may include fractures that are mechanically broken up during drilling or handling of the core, i.e. they are fractures that in a natural state are closed/sealed. Therefore, among all open fractures, those that are mapped as open and having indicated weathering of the fracture surface or/and the fracture fill are of importance to locate weak sections in the rock.
Objective of the study
The objective of the study is to present geological parameters and to eluci-date variation in rock mechanical properties along deformation zones and differences between the character of zones and the host rock. Of special in-terest is to locate weaker parts of the rock and structures along which groundwater flow occurs.
A special aim of the present study is to present a methodology/tool to locate and characterize sections with increase fracturing and sort out sections that at present time represent weak rock.
Organization of the report
The report consists of four chapters in addition to the introduction.
The following chapter (Chapter 2) presents the concept of brittle defor-mation zones, SKB’s approach to identify brittle defordefor-mation zones, the data used in this study and the methodology used during the present investigation to characterise brittle structures based on borehole data (scan-line surveys). The concept of weakness zone in contrast to brittle deformation zone is also discussed.
Chapter 3 is extensive and comprises descriptions of seven borehole sections across a gently inclined brittle deformation zone at the SKB site at Forsmark in northeastern Uppland, eastern Sweden. Intersections of two steeply dip-ping brittle deformation zones are also described, although these zones are only observed in single boreholes. In the last section of this chapter a sum-mary of the general fracturing in the seven investigated borehole sections are given together with a short description of the gently inclined brittle defor-mation zone.
Chapter 4 is the discussion section and it brings the methodology of charac-terizing sections of increased fracturing further compared to Chapter 3. Dis-cussed are, for example, sensitivity tests, location of boundaries of defor-mation and weakness zones, and correlation between clusters of fractures and borehole geophysics.
Chapter 5 presents the results and conclusions. The presented approach to identify and characterize brittle deformation zones and weakness zones is based on the methodology presented in Chapter 2, applied in Chapter 3 and further developed in Chapter 4. The last section of this chapter contains a presentation of the character of the investigated gently inclined brittle de-formation zone and its associated weakness zones.
2. Classification of brittle
structures in boreholes –
Methodology applied in
this study
Character of deformation zones
The characterization of a deformation zone may have at least two purposes:
To increase the structural geological understanding of site structures, including a description of geometrical relations and characters of struc-tures formed on different scales (i.e. includes also the internal character of zones) and how the rock is affected by the formation of the defor-mation zones – a base for predictions.
To develop a classification system that steers the layout, function and possible also the monitoring of a bedrock facility. Such a system may provide information about structures that are not allowed to intersect the bedrock facility and construction restrictions for other structures (layout criteria) to minimize adverse effects on the function of the bedrock facil-ity.
The geological understanding of the formation of structures in an area is the basis for the identification of zones, the prediction of their extension and the relation to other structures. The process is interactive with increasingly re-fined understanding during the progress of the site investigation. Well ex-posed bedrock helps to characterize the variation in the character of geologi-cal structures along their extension. However, even though the thickness of the soil cover, the overburden, may locally be relatively thin (may topically exceed 15 m though the ground surface is flat), excavations are needed to map deformation zones as naturally exposed bedrock, outcrops, generally represent rock of better quality, i.e. less fractured rock.
Outcrops are in most cases small and analyses of self-similarity (scale invar-iance) of structures may compensate for the limited scale of exposed rock. Furthermore, the present character of a deformation zone is a product of its geological history (cf. Milnes 2006). Reactivations, especially partial reacti-vations, of geological structures are common. They may have occurred dur-ing different geological conditions than durdur-ing the initial formation of the structure. The partial reactivation of deformation zones may result in con-trasting properties of the structures along their extensions. A geological structure could, for example be a planar discrete structure and it could also be a non-planar feature formed by the linkage of partly reactivated segments of structures that intersect each other. A good geological understanding of the geological evolution may also be used as basis for an engineering, rock mechanical classification of structures (cf. Hagros 2006).
Syntheses of the characteristics of deformation zones, with their internal structural pattern and bifurcations (splays), overlaps, bridges, damage zones etc. as exemplified by Kim et al. (2004), are rarely described for the SKB sites and Posiva sites (Finland).
To classify deformation zones, minimum information include data on the deformation intensity across the deformation zones together with quantifica-tion of the minimum extension of the zones. To determine whether a struc-ture should be avoided within a bedrock facility, such as a deep geological repository for radioactive waste, the geological characterization of the zone need to be complemented by engineering geological considerations.
Brittle deformation zones and weakness
zones
The framework of structures existing in the bedrock today is the accumulat-ed effect of the geological history on the baccumulat-edrock. The structural pattern can be observed on different scales, from regional scale to microscopic scale. The character of the structural pattern may have similarities (self-similar patterns) but characterization of parameters describing the bedrock may be better achieved at some scales than others. The objective of the present study is to present a methodology that indicates location of fractured borehole sections that may represent brittle deformation zones and weakness zones.
Base data for identification of brittle
de-formation and weakness zones
A basic concept in identification of geological features is that the character of each studied features is known or can be quantified. In an optimal case, the bedrock is well exposed and the character of different types of structural features can be studied in detail along their extensions and the relation be-tween the studied objects and other structural features can be investigated and described. Such information can then be summarized and a general de-scription of, e.g., a set of brittle deformation zones can be made. This can then be used to indicate the existence of deformation zones where the scale of observation is restrained to, e.g. boreholes. However, this study has to rely solely on primary data from borehole investigations.
All data used in this study is from the SKB Forsmark site selected as a po-tential area for hosting a deep geological repository for radioactive waste and within which subsurface based investigations will be performed (SKB Doc ID 1207622; 2009.06.04). The available information consists of:
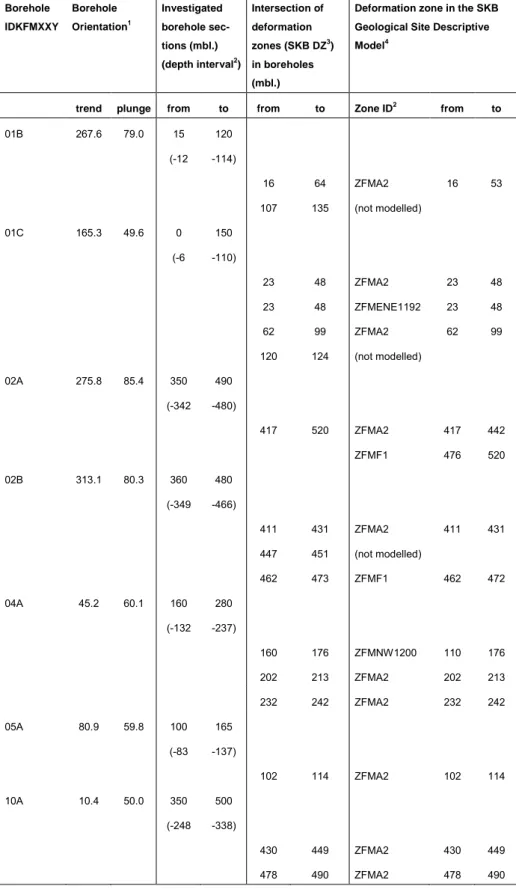
1. Primary geological borehole data from selected cored boreholes (bore-holes KFM01B, 1C, 2A, 2B, 4A, 5A and 10A) ) and constitute tran-scripts extracted from the SKB database SICADA:
KFM orient and length.xls – data on boreholes.
p_core_loss-KFM – sections in the boreholes where no core is re-trieved.
p_rock-KFM – rock types in section greater than 0.5 mbl.1
p_rock_occur-KFM – rock types occurring in section less than 0.5 mbl.
p_fract_core-KFM – discrete fractures.
p_fract_crush-KFM – sections of crushed rock.
p_rock_struct_feat-KFM – orientation of tectonic structures.
p_fract_sealed_nw-KFM – sections with sealed fractures, network of hairline fractures.
p_rock_alter-KFM – sections with altered rock, type of alteration is given.
2. Geophysical borehole data:
p_radar_direct –KFM – borehole radar data, reflectors with absolute orientation.
3. Interpreted geological and geophysical borehole data:
p_eshi p_shi – interpreted locations of deformation zones (DZ). 4. Data on flowing sections in boreholes (Posiva Flow Logs /PFL/) are
extracted from SKB reports (no data from KFM01A and 01B; data from borehole KFM02A in SKB 04-188 and 05-37; KFM02B in SKB P-07-83; KFM04A in SKB P-04-190; KFM05A in SKB P-04-191; KFM10A in SKB P-06-190, also available in SICADA plu_pfl_inferr_anom.xls).
5. Three-dimensional geologic and structural models of the Forsmark site (SKB model database SIMON, rvs-files).
6. Main references used for the description of the geological model are SKB reports SKB R-07-45 and R-08-64 complemented by descriptions of kinematic indicators (SKB P-06-212, P-07-101 and P-07-111).
For each investigation method, SKB have published a method description (in Swedish), in this case:
Method description - Boremap (SKB MD 143.006 Version 2.0, 2005).
Nomenclature – Boremap (SKB MD 143.008, version 1.0, 2004).
Geological Single Hole Interpretation (SKB MD 810.003 version 3.0,
2006).
All data were kindly provided by SKB. The borehole data are from the SKB database SICADA and the structural models are stored in the SKB model database SIMON. The published reports (SKB series TR, R and P) are avail-able in digital format on SKB’s website (www.skb.se).
The framework of brittle structures in the
bedrock
The framework of fractures indicated in, e.g., boreholes is, as pointed out above, the result of the structural history and constitutes a wide range of events and processes that have deformed and also sealed the rock. In meta-morphic gneissic terrains, such as Forsmark in northern Uppland, brittle deformation zones seldom predate the peak of metamorphism. However, the bedrock may have had juvenile structures that have acted as precursors for brittle deformations or structural pattern that in some other way steered the formation of the brittle deformations. This implies that there may have exist-ed structures (ductile or brittle) that prexist-edates the main period of formation of brittle deformation zones and that those structures are reactivated as brittle deformation zones. The zones may later on be sealed and thereafter again reactivated or overprinted by other brittle structures. The character of a brit-tle deformation as seen in a borehole reflects the deformation of the rock where the borehole intersects the zone; some fractures are related to the zones while others might not be.
Nomenclature
The nomenclature concerning brittle deformation zones presented by Munier et al. (2003) and meant to be used by SKB in the site characterization work (Fig. 2-1) is adopted in the present report in order to have a uniform basis for the discussion of results. In the SKB concept of brittle deformation zones2, fixed values of fracture density are used to distinguish between fractures occurring in the host rock (less than 4 fractures/m) and fractures inside the brittle deformation zone (4 or more fractures per m). The core of the brittle deformation zone has a fracture density greater than 9 fractures per metre. In the special SKB task (Step 2 of the SHI) considering analysis of kinematic indicators the SKB concept of deformation zones is slightly modified (Nordgulen and Saintot 2006 and 2007, Saintot and Nordgulen 2007). “The term fracture zone is used to denote a brittle deformation zone without any specification whether there has or has not been a shear sense of movement along the zone. A fracture zone that shows a shear sense of movement is referred to as a fault zone” (Nordgulen and Saintot 20063). However, in their following works, no distinction between brittle deformation zones and fault zones is noted (cf. Nordgulen and Saintot 2007, Saintot and Nordgulen 2007). The occurrence of fault rocks is also presented in the zone definition by Munier et al. 2003. Nordgulen and Saintot (2006) clarify that “The term fault zone is generally used for brittle structures in which loss of continuity
2 The definition of brittle deformation zones has a dual character as it contains both structures that are qualita-tively and quantitaqualita-tively measurable (e.g. fractures) in terms of fracture density and structures that are not (e.g. crushed rock and fault gouge). Note that Munier et al. 2003 do not present any written definition of the term. Why the fixed values 4 fr/m and 9 fr/m are chosen as limits for the boundaries of brittle deformation zones and the core zones, respectively, are not discussed.
3 The classification scheme for faults (containing structures that are non-cohesive, have secondary cohesion or are cohesive) suggested by Braathen et al. 2004 (cf. Sibson 1977) is use in kinematic studies. Structures in the bedrock all have their geological history. This implies that fault rocks belonging to the category of struc-tures that are cohesive or have a secondary cohesion may indicate location of fault cores that deviates from fault cores defined by, for example fractures and crushed rock.
Figure 2-1: Brittle deformation zone; host rock – transition zone – core—transition zone—host rock. (From Munier et al. 2003 and modified by Nordgulen and Saintot 2006). The transit zone corresponds to the dam-age zone (cf. Kim et al. 2003 and 2004) and damdam-age zone is generally used in the text.
and slip occurs on several discrete faults within a band of definable width”. There are no limitations concerning the widths of structures denoted brittle deformation zones or fault zones. Furthermore, the fracture densities can be measured in scan-lines surveys (in boreholes). However, for optimal posi-tioning of the location of the borders of a brittle deformation zones (external borders /zone to host rock/ and internal borders /damage zone to core zone/) a tool, how to measure, and guide lines, were to locate, are required.
The classification of brittle deformation zones applied by SKB does not give any information about how and where to locate the borders between the host rock and the transition (damage) zone and between the transition (damage) zone and the core zone (Fig. 2-1), respectively. Again, a methodology to do this is needed to obtain a uniform description of the architecture of defor-mation zones. However, this task is not simple as the defordefor-mation along a zone may be heterogeneous and the observed structural pattern may be af-fected by interference with pre-existing and over-printing structures.
For example, Caine et al. (1996) in their description of “fault zone architec-ture and permeable strucarchitec-tures” use the terms fault core and damage zone to describe the hydraulic properties in different part of a fault zone. They point-ed out that fault cores (according to their definition of the term) may consist of:
Single fault surfaces.
Unconsolidated clay-rich gouge zones.
Brecciated and geochemically altered zones.
Highly indurated cataclastic zones.
Structures which hydraulic character may vary from a localized conduit to a localized barrier.
The damage zone (Caine et al. 1996) is a “network of subsidiary structures that bound the fault core and may enhance fault zone permeability relative to fault core and the undeformed protolith” (the host rock).
Four types of fault zone architecture were distinguished (Caine et al. 1996) based on the hydraulic character of the core zone and the width of the dam-age zone (unsealed fractures). The end members are (cf. Fig 2-2):
Localized Conduit (core zone and no damage zone; I).
Distributed Conduit (conductive core zone and damage zones; II).
Combined Conduit-Barrier (conductive damage zone and tight core zone; IV).
Localized barrier (tight core zone and no damage zone; III).
Figure 2-2: Conceptual scheme for fault-related fluid flow. Four main groups of fault zones related to density and distribution of fracture and fault gouge (Caine and Foster 1993).
Although Cain et al. (1996) introduce a fault zone indices based on the widths of the fault core and damage zones. However, they do not discuss how the widths should be measured. Furthermore, the conceptual fault zone model presented by Caine et al. (1996) always contains a core zone. Kim et al. (2003 and 2004) discuss in more detail the concept of fault damage zone. The brittle deformation zone nomenclature presented by Munier et al. (2003) is not genetic. However, where core zones appear in a SKB brittle deformation zone model they are denoted fault cores (Stephens et al. 2008, Appendix Table A-4). Furthermore, Munier et al. (2003) include in their schematic illustration of brittle deformation zones also fault rocks in the core zone, e.g. fault gouge, without a discussion whether the fault rock is cohesive (sealed) or not. The character of fault rocks has been described and discussed by, for example Sibson (1977), Braathen et al. (2004) and Milnes (2006). Once again, many early ductile deformation zones have also acted
as precursor for brittle deformation, i.e. all deformed rock found within a brittle deformation zone may not be brittle in character.
All structures formed in the bedrock are more or less affected by the geolog-ic evolution since the structures were formed. Precipitation of fracture min-eral and weathering of fracture walls and fills are example of processes that decreases the water permeability in fractures, while changes in the stress field may cause disturbances that keep structures open or reopen structures. Furthermore, when characterizing a brittle deformation zone it is an ad-vantage to have the structure well exposed so the structural relation between different parts of the structure can be studied and also how structures inside the zone is related to structures in the host rock outside the zone. Such knowledge is useful when performing structural interpretation of borehole data.
The strength of the rock within, for example, a brittle deformation zone is generally not uniform (cf. Fig. 2-2). This is, as pointed out above, partly due to the interplay between fragile deformations and sealing processes. In rock engineering and construction the main concerns are related to the actual properties and behaviour of the rock (Palmstrøm 1995), especially zones of weakness. The general term “weakness zone” denotes "a part or zone in the ground in which the mechanical properties are significantly lower than in the surrounding rock mass. Weakness zones can be faults, shears/shear zones, thrust zones, weak mineral layers, etc." (Norwegian Rock Mechanics Group, 2000, Palmstrøm and Broch 2006). This implies that weakness zones may fully coincide with or only form a minor part of brittle defor-mation zones. If a brittle defordefor-mation zone is sealed then it may not form a zone of weakness (although it will form a scar). However, brittle zones may reactivate and the probability for reactivation of sealed zones is very little studied (not known to the author). What is described is that reactivations occur.
An alternative methodology (cf. SKB geological Single Hole Interpretation, SHI, described in the following section) to identify sections of fractured and weak rock in boreholes is given in subsequent sections. First a review of the SKB approach is given.
Review of SKB Geological Single Hole
In-terpretations and location of zones
The main aim of the SKB geological Single Hole Interpretation (SHI: SKB MD 810.003, version 3.0) is to support the construction of deterministic three-dimensional geological models and stochastic DFN modelling of frac-tures in the rock outside brittle deformation zones. The input data are geo-logical and geophysical borehole data (and borehole TV; BIPS) and the clas-sification of data embrace rock units (RU; rock type) and possible defor-mation zones (DZ). Interactive control of interpretation by visual inspection of the core is performed to refine the classification. The process of interpre-tation of deformed rock within the SHI investigation is made in two steps:
Step 1: A general description of the character of deformation zones (DZ’s; e.g. brittle, ductile or transitional) and a detailed description of
parameters supporting the identification of each zone. The confidence of the zone interpretation is also given (3 classes: high, medium and low). Step 2: Focused on characterization of zones with high confidence (step 1) regarding the following parameters: type of deformation across zones, characterization of fault rock, location of core zones and kinematic anal-ysis. The parameter information should be complemented with a short interpretation of the structural evolution of the zone. The second step is reported separately.
It is stated that the Single Hole Interpretation (SHI) is the first action regard-ing zone interpretation and it is separated from a second action (the Extend-ed Single Hole Interpretation; ESHI) when more precise locations of defor-mation zones are determined. The ESHI is performed during the actual mod-elling of structures in three dimensions. For identification of SHI/ESHI there is no limitation regarding the size of their extension along the boreholes. In the Geological Single Hole Investigation the fracture frequency statistics is presented as floating averages (e.g. 5 m window and 1 m steps) for all tures, open fractures, partly open fractures, sealed fractures and sealed frac-ture networks. The floating average statistics has a smoothing effect on the fracture frequency curves.
In summary, the SHI and ESHI classification should be better described by SKB regarding systematics and applied methodology in the classification process to obtain a uniform classification process that is fully transparent and reproducible. This holds especially for the ESHI classification as it appears not to have a comprehensive method description. The results of the SHI/ESHI (the location of interpreted structures) are stored in the SKB data-base SICADA.
In the Forsmark area the number of indicated intersections of brittle defor-mation zones in boreholes (KFM01A-10A; 23 cored boreholes with a total length of about 15 km) was 114 in the first SHI step and they constitute 24.5 percent of the total mapped core length. The second classification step (ESHI) introduced 12 more potential zone intersections and adjustments of the position of 10 SHIs. Thereby the length of potential intersections of brit-tle deformation zones in the boreholes increased by slightly less than ten percent (9.8) so that the ESHI intersections occupies about 26.9 percent of the total length of mapped cores (ESHI; range in width from 0.5 to 215 mbl. and the mean value is 32 mbl.). The shallower part of the bedrock in the Forsmark area is notably more fractured than its deeper parts and in spite of this about 46 percent of all ESHI are located at depth below 300 m a.s.l.4, note that most boreholes are target-drilled. However, it is beyond the scope of this study to elaborate on this further.
In the study of kinematic indicators to identify shear displacement along faults a selected number of SHI DZ sections (84) were studied (cf. Appendix Table A-4 in Stephens et al. 2008) and the more intensely deformed sections forming the fault core (cf. Fig. 2-1) were identified. Amongst the studied SHI DZ sections 52 percent contain fault cores (no tables compiling width and location of fault cores was found by the author) and 79 percent of the
investigated SHI DZ sections were included in the 2.3 version of the geolog-ical SDM for Forsmark.
A final remark is that the all SHI DZ are used as input data in the SKB struc-tural modelling process, i.e. the construction of the geological Site Descrip-tive Model (SDM). The boundaries of the zones may be adjusted during the modelling (transformed to ESHI) and all SHI DZ sections in boreholes may not be included in the presented model. Due to criteria for including struc-tures about 35% of the number of all SHI DZ sections, i.e. about 19 percent of the total length of all SHI DZ sections in boreholes, are not included in the 2.3 version of the geological SDM for Forsmark. However, in the geo-logical SDM several structures are not intersected by boreholes but indicated by ground geophysics only.
Classification system for identification of
brittle deformation zones and weakness
zones in boreholes
During an initial stage of the present study, an attempt to increase the resolu-tion in the interpretaresolu-tion of fracture data from boreholes was made by study-ing fracture frequency in intervals of 0.5 mbl. The idea is simple and as-sumes that an increase in the resolution in the interpretation will increase the understanding of the distribution of fractures along the boreholes. However, by applying fracture statistics, averaging data, the direct coupling between base data and fracture characteristics was lost. Furthermore, averaging over fixed distances may suppress structures that are thinner than the interval width used in the statistics.
Instead of using intervals along which fracture characteristics can be aver-aged, the mutual separation between fractures is used to identify clusters of fractures. This is to apply a fracture-scale resolution. Separation between fractures can be transformed into fracture densities/frequencies, when such measures are needed. Calculation of mutual separation between observations can be made in the base data tables (in this case in an added column for data in the worksheet) maintaining the coupling between the separation of frac-tures and the character of fracfrac-tures in the base table. This ensures optimum resolution in the classification of data.
A classification system should require the following: 1. The classification system should be objective.
2. Input data should be available in a treatable format; data to classify and information that might affect the classification system (data on the geo-logical environment within which the object for classification is located). 3. The classification should be systematic and uniform, i.e. being
transpar-ent and reproducible.
4. Clear steps in the classification process and presentation of refinements of the classification for each step.
5. Simple to make sensitivity tests, i.e. test outcome against chosen param-eters steering the classification.
6. Presentation of results is a communication process and should be cus-tomised and observation regarding relations between data sets (geomet-ric or genetic) be described and visualized.
The objective of the classification system
The objective of the classification system presented in this study is to sort out sections along boreholes that may represent structures in the bedrock that affect its mechanical strength and the flow of groundwater, i.e. weakness zones. At the same time, sections with a general increase in fracture density (considering all fractures) that may represent brittle deformation zones are located. However, the effort is not to identify extensive discrete fracture planes (cf. large fractures, SKB 2010).
Input data
Basic input data comprise the fracture logs (including discrete fractures, crushed rock, and core loss). Data describing the geological environment are lithological logs (including rock types, orientation of lithological contacts, and alteration of the bedrock), data on ductile deformation (foliation and ductile shear zones), data on zones formed by brittle deformation (brittle-ductile shear zones, cataclastic rock, breccia, “sealed network of fractures”, crushed rock and core loss), borehole radar data (absolute orientation of re-flectors) and data on fluid transport into or out from the borehole (flow logs /e.g. PFL/). Borehole TV-logs (BIPS) have been used during the SKB map-ping of the cores to orient structural features. The BIPS method can be used to obtain detailed in situ pictures of structural relationships. However, BIPS data have unfortunately not been used in the present study to support the presented classification of drill cores. In this study, classified fracture data are presented in composite logs together with locations of water-conductive structures.
Systematic and uniform classification
Important in all classification systems is that the nomenclature and classifi-cation procedure are well defined and the system is applicable within a wide range of fracture densities. The simpler a classification system is the higher is its reproducibility and transparency. However, the identification of sec-tions of increased fracturing can be based on relative increases in fractures frequencies (relative to the general fractures density in investigated bore-hole) or by using fixed absolute values regarding fracture separation (used here, however, by choosing small numbers the difference will be minor) when setting class boundaries. Progressive refinement in the classification procedure may be conducted (cf. item 4 in first part of this section).
Clear steps in the classification process
A stepwise performed classification procedure will enhance the understand-ing of data and it also demands arguments for each performed step.
Interac-tivity in the process provides feedback and forms the base for refinements of the classification.
Sensitivity tests
Tests of sensitivity can be made part of the classification system. This is simple when the classification is based on one parameter but becomes more intricate when the classification is based on two or more parameters. For fracture distribution and identification of clusters, three parameters should be considered:
1. Minimum number of fractures in a cluster. 2. Minimum mutual distance of fractures.
3. Selection of fracture population (for example; all, open or sealed frac-tures and fresh versus altered fracture and sets of fracfrac-tures or a combina-tion of these fracture characteristics).
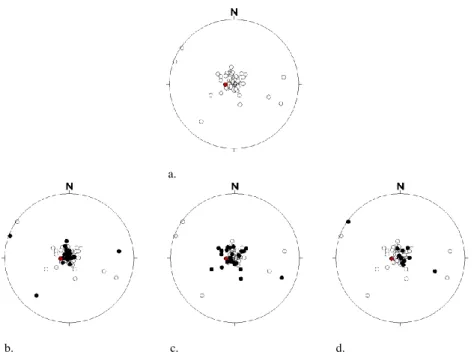
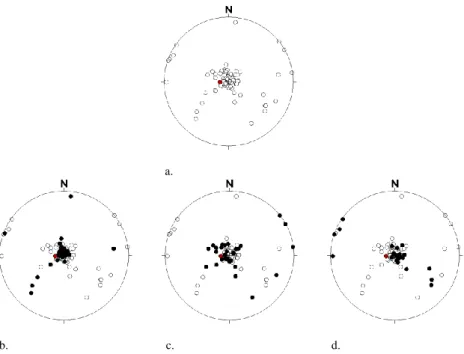
The sensitivity test performed in this study (Chapter 4 Discussion) considers all fractures in one borehole section (KFM10A). The test consists of chang-ing the minimum number of fractures to form clusters (4±1) and also varies the minimum mutual separation between fractures to outline clusters (from 0.1 and 0.2 to 0.5 mbl.; the latter corresponding to a minimum fracture fre-quency of 2 fractures per metre borehole length5).
Presentation of results
The presentation of results should be performed is such manner that the re-sults can be easily used by other geodisciplines and also in such a way that it communicates the essence of the result of the classification. The former can be done by presenting tables while the latter can be made by visualization of results (composite logs or three dimensional figures showing, e.g. structural relationships). Both presentations should be accompanied by descriptive text.
Step by step performance – identification
of sections with increased fracturing in
boreholes
Classification of brittle deformation may in well exposed areas be based on continuous mapping of structures along their extent. However, such areas are relatively rare. Deformation zones are often more easily eroded than the host rock why they form depressions in the bedrock surface and often are, evenly in relatively well exposed areas, covered by soil.
The classification procedures used (Chapters 3, 4 and 5) are based on bore-hole data and consist of sequences of steps. The first step (cf. section Data handling below) involves selection of data to base the classification on. The
subsequent steps consider how to locate sections in the borehole representing possible locations of brittle deformation zones and weakness zones.
The use of relative density of fractures to identify potential location of brittle deformation zones requires good overview regarding the general homogenei-ty of fracturing along the boreholes. The SKB definition of a brittle defor-mation zone (Fig. 4-2) applies fixed values on fracture frequencies. A brittle deformation zone may have core zone/-s for which the density of fractures is set by SKB to be greater than 9 fractures per metre6. However, this fracture frequency cannot directly be compared with, for example, the RQD (Rock Quality Designation, see Formula 1 below) as the RQD considers fractures parting the core. For core sections with core pieces equal to or shorter than 0.10 m the RQD is zero. Furthermore, some of the fractures breaking the core may be broken up during drilling and handling of the core.
RQD (Deere 1964) is defined as the quotient in percent:
(Formula 1) lsum of 100= Sum of length of all core sticks longer than 100 mm measure along the centre line of the core (in the measured section)
ltot core run= total length of core run (the measured section).
However, it is not apparent what fractures are to be considered in the SKB definition of brittle fractures (all fractures?). In the classification presented here, all fractures are used initially to locate possible positions of brittle de-formation zones. On the other hand, to locate weakness zones open altered fractures are used7, i.e. a sub-group of all fractures parting the core (cf. RDQ). However, using all fractures to identify fracture zones may be cum-bersome in bedrock with high average fracture densities, especially when the fracture population is composed of a mix of several sets of fractures (cf. Chapter 3). That is, the clusters may represent, for example, cross-cutting zones or a more or less random interference of fracture sets. In such cases, each set of fractures are to be treated separately. Furthermore, identification and characterization of zones is a learning exercise. During the interpretation supporting data on potential zones should be kept together with data (e.g. in the same worksheet) on fractures outside the zone. By comparing fracture sets inside and outside a zone, fractures that may predate or overprint the zone may be indicated.
In this work, one approach is to let fracture clusters with a fracture frequency of 10 or more4 open altered fracture per metre borehole length to be used to
6 The definition of brittle deformation zones presented by Munier et al. (2003) considers both the fracture density and the occurrence of fault rock (cf. Sibson 1977, Milnes 2006). The fault rocks, except for sections mapped as crushed rocks are in the Forsmark site cohesive, i.e. form different types of rock, cf. tectonite. Crushed rock is by the definition applied by SKB composed of open fractures while “sealed network of frac-tures” appears as a system of hair-line fractures and breccia is a fragmented rock held together by mineral cement or fine-grained matrix.
7 However, the selection of fractures can be discussed. Fractures mapped as open can be: a. open fresh without fracture minerals, b. open fresh with fracture minerals, c. open altered without fracture minerals and d. open altered with fracture minerals. Fresh fractures may either been broken up during drilling or handling of drill cores or representing non-connected fractures or fractures that have been open up very late. Open altered fractures have been chosen as such fractures have been affected by the groundwater. This issue is treated further in the Chapter 4 Discussion, section Sensitivity test.
indicate the core zone of weakness zones. Similarly, the core zone of a brittle deformation zone should be defined as fracture clusters contain 10 or more fractures per metre considering open, partly open and sealed fractures to-gether. Sections of crushed rock are initially not considered. However, they are at a later stage in the process considered as parts of core zones.
As a guide to locating the contact between the core zones and the outer rim of a brittle deformation zone (the damage/transition zone), clusters with a fracture density that is half the density of fractures in clusters outlining the core zone/-s can be applied for the damage zone (i.e. in this case fracture separation of 0.20 m or less; cf. 4 fr/m is suggested by Munier et al. 2003 for the transition zone).
However, the separation of fractures along a borehole is related to the angu-lar relation between the borehole and the fractures (the alpha angle). This relation can be considered by separate analysis of sets of fractures and re-calculate the separation of fractures along the borehole to true separations (separation along borehole = (true separation)/sin; 8 is the intersection between the borehole and the fracture; cf. sampling bias, Terzaghi 1965). In the classification system presented in this study the separation between fractures is used as a relative measure. The advantage of this is that it gives precise locations for sections classified as brittle deformation zones or weakness zones. When a section of increased fracturing is identified its frac-ture frequency can be calculated. Furthermore, the original data are retained during the classification and the character of fractures within each outlined interval can be directly described. This holds also for fractures outside and adjacent to zones.
The next parameter in the classification system is the number of fractures needed to “identify” a zone. Definition of brittle deformation zones does generally not give a unique number regarding the number of fracture needed (in a cross section). A fault zone must contain at least one fracture along which displacement has taken place (Caine et al. 1993, cf. Fig. 2.2). Three fractures are needed to outline two sections in the core. Choosing three frac-tures gives a high resolution but it may, however, comprise large parts of the fractures in the core. However, it gives the possibility to check the sensitivity of the classification system as sections with four and more fractures will be listed simultaneously (part of the sensitivity test, cf. Chapter 4). However, in the base case clusters formed by at least four fractures was performed in this study (Chapter 3).
The last step is to join adjacent cluster to outline zones (Chapter 4) according to the applied definition of zones. This step need also, except from the min-imum magnitude of fracture frequencies in core and damage zones, guidance regarding how to locate the boundaries of zones. This step also draws atten-tion to inhomogeneity in zones.
Input data
The SKB fracture log (SKB SICADA base; data file p_fract_core-KFMXXY9) contains several fracture parameters, for example Borehole ID10*, position in borehole (adjusted secup*), if the core is bro-ken/unbroken* and if fractures are open/partly open/sealed*, width and aper-ture(*) of fractures, confidence in the presented aperture (3 classes), types of fracture fills*, morphology of fractures (planar to irregular), roughness of fracture surfaces, indication of displacement along fractures, fracture altera-tion*, orientation (strike/dip*), type of host rock and absolute coordinates of observations.
Data handling
The identification of clusters of fractures along the borehole is best made using a worksheet (e.g. Excel). During the analysis all base data for each analysed group of fracture are kept and the space for noting the outcome of analysis is obtained by adding columns in the base data table.
The steps in the data handling are as follows:
1. Select a group of fractures (e.g. all, open, partly open or sealed or set of fractures – in this case all and thereafter open altered fractures are cho-sen and in some cases also sets of fractures).
2. Calculate the mutual separation between fractures along the core for the selected group of fractures.
3. Give the parameters for the cluster identification (minimum number of fractures and maximum separation between the fractures; in this case minimum 4 fractures and 0.10 and 0.20 m => the two cluster parame-ters to identify core zone and damage zone, respectively) and apply these parameters to the data. Give upper position, lower position and number of fractures for identified clusters in separate columns.
4. If distinct fracture sets exist repeat the analysis for each set and consider the orientation bias when applying fracture separation for different clas-ses of clusters (i.e. repeat steps 1 to 3).
5. Compile cluster data obtained and present a summary table (for example Tables11 3-6, 3-12 or 3-16) and visualize the location of the clusters in a composite diagram (for example Figs.3 3-61, 3-101 and 3-132).
Performance
The step-wise analysis presented below (step A to E) and performed in Chapters 3 and 4 forms the base for the developed approach of localizing zones. The outcome of the performed analysis is presented in Chapter 5,
9 KFMXX: K=kärnborrhål (cored borehole), FM=Forsmark, and XXY is the number of the borehole, for in-stance 01A.
10 Parameters noted with * are used in this study. Fracture apertures(*) are only used in borehole KFM10A (Chapter 4; cf. Table 4-3).
11 Chosen examples give zone to borehole intersections at various depths and several groups of fractures /clusters are treated.
Results and conclusions, and a somewhat refined performance to locate and describe brittle deformation zones and weakness zones is presented.
Step A
This initial step considers all data and provides an overview of the spatial distribution of fractures along the borehole (cf. data handling above). The aim is to identify borehole sections that in geological time have been affected by brittle deformation. However, using all fractures may not indi-cate which section(s) of the borehole that today have potential to contain fractures with low tensile strength or water-conducting fractures. On the other hand, it may give information about fracture sets that together form the cluster and how the fracture pattern inside the clusters are related to the frac-ture pattern outside the clusters.
Step B
The data examined in the next step are all open fracture, i.e. including frac-tures breaking the core and where the core pieces do not exactly match. The base for this choice is an assumption that these discrete fractures contain the weak fractures (cf. Chapter 4; interpretation of broken sealed and altered open fractures) and the water-conductive fractures (number of weak fracture are greater or equal to the number of water conductive fractures?).
This step indicates the relative distribution of open fractures in relation to all fractures, i.e. it could give information about the present effective width of zones.
However, amongst the open fractures there are those with fresh surfaces and those with altered fracture surfaces. In most cases open fractures with fresh surfaces are subordinate and they have similar orientations as open altered fractures why this step is not performed in all boreholes (due to time and budget constraints).
Step C
In this step open altered fractures are analysed. These fractures represent weak fractures and the alteration of the fractures indicates that they have been in contact with fluids.
This step may indicate whether or not flowing groundwater has been focused along narrow sections in the rock.
Steps A and C are demonstrated in Chapter 3 for selected borehole sections; sections that are located in seven cored boreholes where they cross a gently inclined zone.
Step D
A sensitivity test checking the outcome (location and size of clusters) by using alternative criteria for the identification of clusters, i.e. use variable minimum number of fractures to be included and minimum mutual separa-tion of fractures to outline clusters. (In the present study only executed is the sensitivity test for fracture data in a selected section of borehole KFM10A, Chapter 4).
Step E
Steps A to D are performed to locate clusters, i.e. potential locations for brit-tle deformation zones and weakness zones. In the discussion chapter (Chap-ter 4) a next step (step E) is proposed regarding joining closely spaced clus-ters together in order to define the borders of potential zones. As pointed out already, this step needs rules for the location of zone borders. The identifica-tion of zones is a learning process and it is important to use reference struc-tures (mapped on exposed rock surfaces and/or experience gained during the construction of geological models) to support the interpretation of borehole structures.
Fractures with measurable apertures
In the Forsmark bedrock there are relative few fractures with apertures greater than the resolution of the BIPS instrument. However, many of these fractures appear as solitary fractures and are located outside clusters of frac-tures (cf. Chapter 4) and some of these fracfrac-tures are noted as fresh. Some comments on fractures having noted apertures greater than 0.5 mm are given in Chapter 4 (cf. Table 4-6).
3. Description of borehole
data and zone
intersec-tions
The selected area for the present study is the SKB Forsmark site in northern Uppland, about 120 km north of Stockholm. The area is one of the most studied areas in Sweden regarding location and character of deformation zones as it is the selected area for underground characterization of the bed-rock (SKB 2008 and references therein). It is the proposed site for building a final repository for high-level nuclear waste in Sweden.
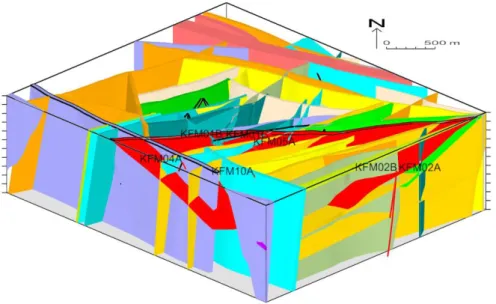
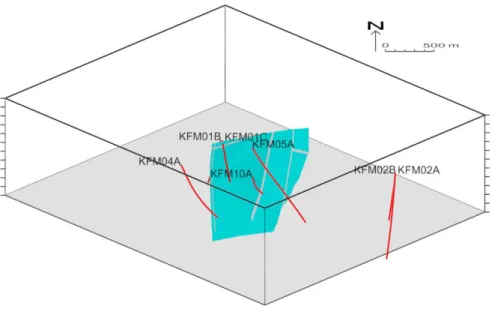
The investigation of the Forsmark area (Figs. 3.1 to 3-3) has indicated the existence of brittle deformation zones having relative large extensions. One of the zones (gently inclined) is penetrated by several cored boreholes at various depths (Table 3-1 and Figs. 3-1 and 3-5). This is advantageous in a method study, i.e. that the studied object is a single structure. However, the studied structure may not originally be uniform along its extent and it is clear that the structure locally interferes with other structures or has superimposed alteration. Still, it is the same structural unit that may have some common characteristic features conserved.
Examples to illustrate the character of the bedrock inside and in the vicinity of deformation zones are given in this chapter. The methodology using frac-ture separations to identify fracfrac-ture clusters, presented in the previous chap-ter, is applied (steps A to C). The main studied object is a gently inclined and extensive brittle deformation zone in the SKB Forsmark site; SKB brittle deformation zone ZFMA2 (Fig. 3-5; cf. Stephens et al. 2007, Stephens et al. 2008, and SKB 2008). Sub-vertical brittle deformations zones trending ENE and NW are also described when occurring adjacent to zone ZFMA2 in boreholes (Figs. 3-4, 3-6 and 3-7). Fractures described in this report are dis-crete fractures (SKB database SICADA files p_fract_core-KFMXXY.xls) if not nothing else is presented.
The locations of zone ZFMA2 and other SKB zones intersecting the investi-gated sections in the seven core-drilled holes are briefly described in the first section of this chapter and the second section (the main part of this report) presents the character of the seven investigated borehole sections.
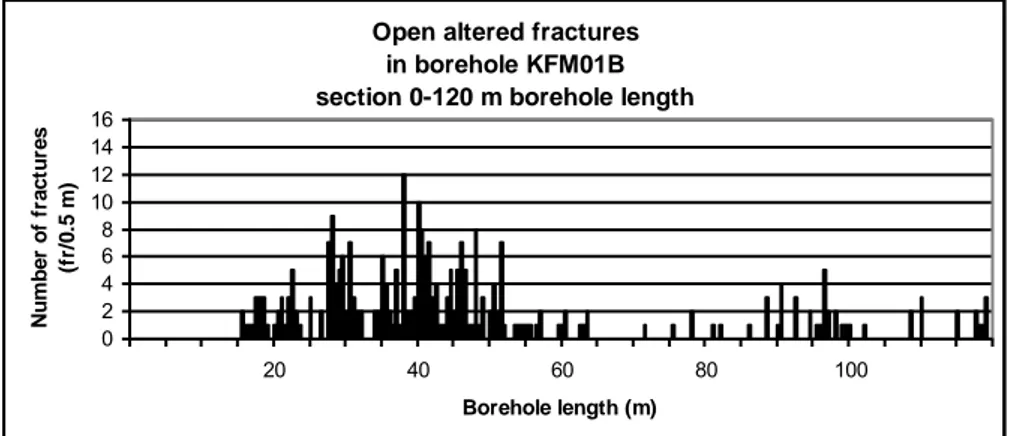
Borehole KFM01B, section 12.5-120 mbl., is described in more detail than the intersections in the other six boreholes. The reason for this is to select categories of fractures essential for identification and characterization of sections with brittle deformation affecting the present strength of the bed-rock and transport paths for groundwater. The borehole also emphasises the difference in fracture characteristics at shallow levels (depths less than 50 m) and at deeper levels of the bedrock.
The section describing fracture characteristics in borehole KFM04A is also extended as the borehole is located within the rim of a regional scale NW-SE