The infl uence of temperature and
fl uid pressure on the fracture network
evolution around deposition holes of a
KBS-3V concept at Forsmark, Sweden
2011:26
Author: Tobias BackersOve Stephansson
SSM perspective Background
In preparation for the review of SKB’s license application for disposal of spent nuclear fuel, SSM is conducting studies to evaluate the per-formance of the multi-barrier principle on which the KBS-3 concept is based. Copper canisters containing the spent nuclear fuel are placed into granitic bedrock at about 500 m depth and embedded in clay. Thus, the rock, the clay and the copper canister are acting as barriers in order to retard the possibility of spent fuel to escape the repository and reach the biosphere. During a very long time period (e.g. millions of years), the rock will be subjected to thermal, mechanical and hydraulic changes that can induce failure and propagation of the existing fractures provi-ding new pathways for the spent fuel to escape the repository.
Objectives
For SSM, the goal of this study is to improve the scientific basis for the evaluation of the performance of the bedrock as a barrier in the KBS-3 repository concept and enhance the knowledge about the thermal-mechanical-hydraulic processes affecting the bedrock. These simulation series focus on the natural and/or induced fractures in the bedrock surrounding the canister and their possibility to initiate or propagate due to the changes of stress and water pressure in the bedrock. These changes will be caused by the construction of the repository for spent nuclear fuel, its thermal phase and, in particular, by a glacial period af-fecting the bedrock at the repository site.
Results
According to the modeling results, during construction and thermal phase of the repository, no major alterations of the fracture network are expec-ted. However, a large increase of fluid pressure due to a glaciation period has a pronounced impact on the fracture network. In a high magnitude stress field, fractures tend to close and mobilize their frictional resistance. However, in a low magnitude stress field, existing fractures tend to propa-gate with consequent major changes the fracture network. In conclusion, the understanding of the magnitude of the in-situ stress field at Forsmark appears to be critical for the evolution of the fracture network.
Need for further research
More effort should be made in modeling the changes of the fracture net-work considering the effect of large fluid pressure onto the tunnel system at repository scale. Also the effect on the fracture network of large earth-quakes and surface rebound after glaciation should be studied by expli-citly taking into account fracture propagation. Several different realization of the discrete fracture network should be preferably considered.
Project information
Contact person SSM: Lena Sonnerfelt Reference: SSM 2010/1144
2011:26
Authors: Tobias Backers and Ove StephanssonGeomecon GmbH, Potsdam, Germany
The influence of temperature and
fluid pressure on the fracture network
evolution around deposition holes of a
KBS-3V concept at Forsmark, Sweden
This report concerns a study which has been conducted for the Swedish Radiation Safety Authority, SSM. The conclusions and
view-Contents
1. Summary ... 3
2. Introduction ... 3
3. Layout of the numerical campaign ... 5
4. Numerical tools ... 8
4.1. fracod2d ... 8
4.2. phase2 ... 9
5. Definition of the model ... 9
5.1. Geometry ... 9
5.2. Geomechanical properties ... 10
5.2.1. Intact rock and fracture properties ... 10
5.2.2. Rock mass properties ... 11
5.2.3. Thermal properties ... 12 5.3. Stress conditions ... 12 5.3.1. Stress model ... 12 5.3.2. Fluid pressure ... 16 5.3.3. Swelling pressure ... 16 5.3.4. Ice cover ... 16 5.4. Temperature conditions ... 17 5.4.1. In situ temperature ... 17
5.4.2. Temperature evolution and heating scheme ... 17
5.4.3. Ice cover ... 18
5.5. Discrete fracture network DFN ... 18
6. Model validation ... 20
6.1. Rock model ... 20
6.2. Distinct fracture network model ... 20
7. Results ... 21
7.1. Overview to simulation campaign ... 21
7.2. Effect of loading history without DFN (IM-2)... 22
7.3. Evolution of fracture network DFN I under high in-situ stress field ... 26
7.4. Evolution of fracture network under low in-situ stress field ... 27
7.5. The influence of the fluid pressure from an ice cover ... 28
7.6. Evolution of fracture network DFN II ... 29
7.7. Post glacial scenario ... 30
7.8. Comparison of simulation of models with and without fracture initiation ... 31
7.9. Influence of excavation of the deposition holes ... 32
8. Interpretation and Discussion ... 33
9. Conclusions ... 35 10. References ... 37 Appendix ... 38 11. Simulations ... 38 11.1. Simulation IM-6 ... 38 11.2. Simulation IM-7 ... 43 11.3. Simulation IM-9 ... 49 11.4. Simulation IM-10 ... 55 11.5. Simulation IA-1 ... 60 11.6. Simulation IA-2 ... 67
11.7. Simulation IA-3 ... 72
11.8. Simulation IA-4 ... 78
11.9. Simulation IIM-1 ... 84
11.10. Simulation IIA-1 ... 90
11.11. Simulation IMO-1 ... 95
11.12. Code listing examples ... 99
11.12.1. IM-2 ... 99
1. Summary
The extensive numerical modelling campaign aimed at simulating the devel-opment of the distinct fracture network under the variable geomechanical boundary conditions in a repository for spent nuclear fuel at Forsmark. The models mirrored the introduction of the KBS-3V deposition concept includ-ing the backfill of the tunnel, the readjustment of the water head, the swell-ing of the bentonite buffer and a full sequence of heat generation from the canisters. The temperature evolution was modelled from present in situ con-ditions up to 75°C rock wall temperature, including a cooling phase down to repository conditions of about 10°C.
In addition a glaciation scenario was added to the simulation campaign. The glaciation scenario included the increase in vertical load due to an ice sheet of 3km thickness and the increase of fluid pressure to 34MPa due to a hy-draulic connection from the surface of the ice cover.
The simulations were run for two different distinct fracture network models and two stress regimes, i.e. the stress models by Martin [2007] and Ask et al. [2007]. The understanding of the stress field at Forsmark appears to be criti-cal for the extension of the fractures. The low magnitude stress field (Ask et al. [2007]) enhances the propagation of existing fractures in the network. The high magnitude stress field (Martin [2007]) tends to close the fractures and mobilise the frictional resistance of the fracture faces.
The results showed that during the operation, closure and thermal phase of the repository no major DFN alterations are to be expected, that may lead to hydraulic connections of the excavations. However, an increase of water head might have the most pronounced impact on the distinct fracture net-work evolution. A limited number of models simulating the hydraulic effect from the excess groundwater pressure of an ice sheet resulted in severe frac-ture propagation and connection of the fracfrac-ture network.
2. Introduction
In classical rock mechanics, rock is viewed as a continuous flawless materi-al. Rock strength is often described by empirical criteria based on observa-tions of failure, mostly in the laboratory. The most frequently used criteria are the Mohr-Coulomb, Hoek-Brown, or Mogi criteria and modifications or extensions of them (Benz and Schwab [2008]).
The parameters defining the strength criteria of rock are determined by tests in the geotechnical laboratory, where the response is characterised only globally, i.e., based on measurements at the boundary that are assumed rep-resentative of the overall (homogeneous, continuous) sample response. Thus, behaviour according to classical theory may only be expected in the case of a perfectly homogeneous material undergoing perfectly uniform deformation.
However, the hypothesis of continuity does not hold for rock. Rock material is a discontinuous combination of solid matters, pores, flaws, cracks and fractures.
All analyses of the structural breakdown of rock and rock mass clearly show that a continuum based approach cannot provide a correct description of the mechanics of failure. The existence of a crack in an otherwise solid homoge-neous body reduces the strength of the structure considerably. Any load act-ing on the body is magnified several times at the tip of such a discontinuity, so when the stress concentration at the tip of the crack reaches a critical lev-el, it propagates. Thus, failure is governed by pre-existing discontinuities. Discontinuities are an important feature of rock and rock mass and control not only the hydraulic properties of rock and rock mass by well-connected networks (Quesada et al. [2008]), they also govern the mechanical behav-iour. When the stresses in a rock mass are altered, whether by depletion of a reservoir, sequestration of liquid or gas, increase of pressure by enhanced oil recovery operations, thermal loads or the introduction of a new excavation, the pre-existing discontinuities may grow. Their growth may create new pathways for fluid flow or, if pre-existing fractures propagate and coalesce to form larger fracture networks that intersect with an excavation or another free surface under these circumstances, the structures may lose integrity and fail.
The existence of discontinuities in rocks together with fracture and fragmen-tation processes limits the applicability of continuum-based models to ad-dress rock engineering problems. A way forward in understanding the over-all mechanical performance of rock mass is to explicitly simulate the initia-tion, growth and interaction of the distinct fracture network (Backers [2010]). The software fracod2d is one of the few options to provide such analysis. fracod2d is able to explicitly simulate the development of the frac-ture network under varying semi-coupled THM conditions.
In a fracture mechanics modelling study performed by GeoFrames GmbH for SKI in 2008 it was shown, that extension of the pre-existing fractures and fracture sets in the rock mass can potentially lead to a hydraulic connection between neighbouring deposition holes (Backers and Stephansson [2008]). For some configurations of deposition holes and DFN, pre-existing fractures are propagating due to the increased stress field around the excavations, that leads to interconnected fractures linking up neighbouring deposition holes. These connected fractures may act as potential pathways for fluid flow and transport, not only between the deposition holes, but also between deposition holes and the deposition tunnels.
In this study, the loading history to be expected on a repository for spent nuclear fuel in Forsmark is analysed by means of a fracture mechanics based geomechanical simulation campaign using fracod2d. The existing fracture network is explicitly represented in two examples and subject to the se-quence of loading cases in such a repository; e.g. excavation of the deposi-tion holes, backfill, rising of water head, swelling from compacted bentonite, and thermal stresses from the heating of the canisters. The growth of the
individual fractures due to the changes in stresses and temperatures is simu-lated yielding an understanding of the potential for the coalescence of frac-tures, that may lead to hydraulic connections between deposition holes caus-ing potential pathways for radionuclides. Special emphasis is also put on the possible effects of glaciation, which will add a vertical load and potentially an increase in fluid pressure to the repository.
3. Layout of the numerical campaign
The numerical campaign aims at mirroring the key boundary conditions and input parameters that may influence the activation of the existing DFN at Forsmark, Sweden. Some simplifications had to be made in this overview study, in particular when modelling the thermal loads, but the cornerstones of the loading path are met.
The numerical campaign comprises the following steps, which are presented in Figure 1:
generation of the geomechanical / geometrical model and DFN model insertion of the excavations
application of swelling pressure from the high-compacted bentonite application of constant temperature in increasing increments at deposition
holes
decrease of temperature in increments increase of vertical stress from ice load
consideration of water head as caused by ice load assuming there is a hy-draulic connection
Figure 1. Workflow of the numerical simulation campaign. At first the geometry, the geomechanical models and the distinct fracture network (DFN) are defined from published data on Forsmark. The DFN model and the strength model are calibrated and verified against observations. After that the closure of the repository including the heat radiation from the canisters is simulated. Finally a cycle of ice cover is modelled and the excess water head is allowed to influence the stress condition in the repository.
The geomechanical model is set up from literature information presented by SKB. The model assumes elastic material properties up to the fracture initia-tion level. The fracture initiainitia-tion is due to a Mohr-Coulomb criterion. Frac-ture propagation is modelled using a fracFrac-ture mechanics based criterion in-corporating fracture toughness under tensile and shear loadings. The geome-chanical model includes the stresses as reported for the 420m level at For-smark; two stress models are compared (Ask et al. [2007], Martin [2007]). The geomechanical model was validated against stable configuration. The existing distinct fracture network (DFN) was derived from Fredriksson and Olofsson [2005]. Two DFN examples were extracted for this simulation campaign. A verification of the DFN was performed for two depth levels anticipating that no fracture propagation would occur.1
The geometrical model comprises two individual deposition holes at a centre point distance of 6m. The model domain is set to a 12m times 6m window. A variation analysis of the domain size and additional deposition holes yielded no significantly altered static stress fields. The geometrical model was vali-dated assuming that no fracture initiation occurs in a DFN free rock mass. The initial rock temperature of the deposition hole walls is assumed to be constant at 14.5°C.
After closure of the repository two processes take place. As the tunnel is backfilled, the tangential stress around the tunnel is reduced, yielding at a reduction of the stress acting on the deposition holes. This was included in the simulations by reducing the stress acting normal to the axis of the deposi-tion hole. Further, the water head will be increased in the repository and the bentonite backfill in the deposition holes will start swelling. This is included in the simulations also. Two different swelling pressures at constant water head pressure were simulated.
Subsequently, due to the canister heating, the temperatures in the vicinity of the deposition holes will increase and introduce thermal stresses. The com-plete heating sequence is not included due to computational constraints. However, a constant temperature is applied to the deposition hole walls in increasing steps (15, 15, 50, 75°C). The temperature is always keep constant for a period of 700e6s, assuming the peak temperature after roughly 150a. After each heating step the fracture propagation is simulated and the new stress state is determined and eventual fracture propagation defined. As the heating capacity of the canisters is decaying, this is modelled by re-ducing the deposition hole wall temperature again stepwise (75, 50, 25, 10°C), this time applying for 9e10s. This loading sequence allows registra-tion of remaining deformaregistra-tion following a heating and cooling cycle. For Sweden an ice age can be expected in future, hence the model includes the increase of vertical load due to an ice cover of thickness 3km. This in-crease in vertical load is assumed not to introduce lateral stress inin-crease. For
1 It needs to emphasised, that the results are valid for the given DFN and geomechanical situations only,
although the results are assumed to be instructive and typical for Forsmark. Likely there exist DFN configura-tions that deliver more favourable or less favourable results.
the lateral stress increase several models exist, but this would have exceeded the aim of this study. A sensitivity analysis of the stress fields resulting from ice cover could be run as an extension to this study. The increase in vertical load results in a change of the tangential stress of the deposition tunnel. Depending on the existence of permafrost in the soil, it might happen that the full water head of the ice cover will act on the repository. This is includ-ed in the simulations by adding a water pressure increase in the fractures that is equivalent to the thickness of the ice cover. Further, after the reduction of the ice cover the fluid (over-) pressure in the repository might not be reduced instantaneously; this is also considered in a simulation.
4. Numerical tools
Two software packages were used for the analysis. The software phase2 was used on selected stress analyses for calculation of the redistribution of the stresses around the access tunnel. The fracture mechanics based software fracod2d is used for most of the simulations.
4.1. fracod2d
In the context of this study the software fracod2d is used. fracod2d is a code designed to simulate fracture initiation, propagation and coalescence in hard rocks. The two-dimensional boundary element code was designed with the aim of predicting the fracture propagation and interaction of randomly dis-tributed fractures in an elastic rock medium. It can handle both tensile and shear failures and it makes use of the Displacement Discontinuity Method (DDM). fracod2d can also be applied to study materials like concrete, glass and ceramics.
The fracture propagation criterion by Shen and Stephansson [1993] is incor-porated into the code. In this criterion the resistance to fracture propagation, the fracture toughness, K, at the fracture tip is divided into two parts, one due to Mode I deformation (tensile) and one due to Mode II deformation (shear). The sum of their normalised values is used to determine the failure load and direction of fracturing. Both tensile and shear fracture propagation have been successfully simulated by fracod2d and verified by laboratory and field tests.
The input data includes the model geometry and geometry of pre-existing fractures, boundary conditions, far-field stresses, strength and elastic proper-ties of the rock mass, fracture toughness, fracture stiffness of pre-existing and created fractures, fracture friction and cohesion. The code has the capac-ity of predicting fracture initiation, propagation and coalescence of pre-existing joints and newly formed fractures in the vicinity of excavations. The code has been used in a number of research projects for the Swedish nuclear waste deposition, including the Äspö Pillar Stability Experiment
(APSE). It has also been used in modelling borehole breakouts and for the design of a drilling campaign (Moeck et al. [2007]).
4.2. phase2
For the analysis of the tangential stress of the access tunnel the commercial code phase2 by Rocscience Ltd (http://www.rocscience.com/home.asp) was used. phase2 is a 2D elasto-plastic finite element stress analysis program designed in particular for underground or surface excavations in rock or soil. It can be used for a wide range of engineering projects and includes support design, finite element slope stability and groundwater seepage analysis.
5. Definition of the model
This section summarises the geometrical model, the stress field models, the geomechanical models, input parameters and distinct fracture network used for the simulations.
5.1. Geometry
Figure 2 displays the geometry of the simulation domain. The basic layout is defined according to SKB [2009b]. The centres of the deposition holes are 6m apart, the diameter of the holes is 1.8m. The deposition holes are 8m deep. A bevel is not considered and would require an additional analysis. It is assumed that the bevel will introduce additional fracturing as it acts as a stress concentrator.
It is anticipated that the deposition tunnel is oriented parallel with the maxi-mum horizontal stress SH, i.e. Sxx = SH, Syy = Sh, and Szz = Sv, unless otherwise stated. An analysis of the influence of deposition tunnel orienta-tion on the acting stress profile along the deposiorienta-tion holes is given in Eriks-son et al. [2009] and SKB [2009b]. For a deposition tunnel orientation paral-lel with SH, the influence of excavation is the least and the redistributed stresses at the deposition hole wall are below the assumed spalling strength. Section 5.3 derives the stresses as acting on the deposition holes from the tangential stress of the access tunnel.
The monitoring window for cross sectional simulations will be 12m x 6m wide, i.e. spanning (-6.0 ; 3.0) to (6.0 ; -3.0), fracture initiation and propaga-tion are allowed on a reduced window size of (-4.5 ; 2.5) to (4.5 ; -2.5).
Figure 2. Geometrical layout of the model. The cross sectional cut of the model provides a computational window of 12m times 6m; fracture initiation is limited to a 9m times 5m window. The deposition holes are aligned centred with the direction of Sxx = SH (maximum rock stress) and are 6m apart.
5.2. Geomechanical properties
5.2.1. Intact rock and fracture properties
fracod2d uses a Mohr-Coulomb based criterion for fracture initiation. The fracture deformability is described by a linear stiffness model, and the frac-ture propagation is governed by a fracfrac-ture toughness based fracfrac-ture mechan-ics model. The rock behaviour is assumed linear elastic up to meeting the requirements for fracture initiation.
The values for deformation and strength properties of the intact rock material were chosen for the dominant rock type 101057 (granite to granodiorite, metamorphic, medium grained) at Forsmark site and are summarised in Ta-ble 1 (Glamheden et al. [2008], SKB [2008], SKB [2009a]). The average values are used in the models unless otherwise stated.
Table 1. Deformation and strength properties of the intact rock material (granite to granodiorite 101057) in fracture domain FFM 01. (Tab. 7-3. TR-08-05, SKB [2008]).
The fracture mechanics parameters were determined as reported in Backers and Stephansson [2008] and are summarised in Tables 2 and 3. The Mode I and Mode II fracture toughness have been measured at ambient pressure and temperature conditions. The fracture normal stiffness has been measured on tensile fresh fractures. The fracture normal stiffness is about 3·1011 Pa/m. The shear stiffness is estimated from experience to 1.5·1011 Pa/m. The fric-tion angle of newly formed fractures is set to 30°, the cohesion to 0 MPa. Table 2. Fracture mechanics properties of the intact rock material (Backers and Stephansson [2008]).
Table 3. Fracture properties of the rock material (Tab 7-4. TR-08-05, SKB [2008]).
5.2.2. Rock mass properties
The values for deformation and strength properties of the rock mass were chosen for the dominant rock type 101057 (granite to granodiorite, meta-morphic, medium grained) and are summarised in Table 4 (Glamheden et al. [2008], SKB [2008]). The rock mass properties are not used in the models, as the fractures are explicitly simulated.
Table 4. Rock mass properties (granite to granodiorite 101057) in fracture domain FFM 01. (SKB [2008]).
5.2.3. Thermal properties
The thermal properties are reproduced from SKB [2008] and SKB [2009a] and are given in Table 5. The average values are used in the models unless otherwise stated.
Table 5. Thermal properties for rock type 101057 (SKB [2008], SKB [2009a]).
5.3. Stress conditions
5.3.1. Stress model
The SKB stress model for Forsmark is given in Table 6 based on Table 7-7 in SKB [2008]. The most likely values for the stresses are based on Martin [2007]. This model is used in this study unless otherwise stated. For the sake of completeness the model of Ask et al. [2007] is included in the analysis on selected simulations.
Table 6. Stress model for domains FFM01. (Ask et al. [2007], Martin [2007], SKB [2008]).
Eriksson et al. [2009] have analysed the influence of the stress redistribu-tions around deposition tunnels on the deposition holes. Figure 3 show the tangential stress along the vertical deposition hole axis at positions 0°, 90° and 180° from the deposition tunnel direction. Please note that the bevel is included in the analysis. The influence of the bevel on the stresses reaches considerably down into the rock mass around the deposition holes. The bevel is not considered in this study, but could be analysed in terms of its fractur-ing potential in a dedicated study.
Figure 3. Figures A1 (left) and A4 (right) from Eriksson et al. [2009].
This campaign simulates cross sections through two neighbouring deposition holes. For this the stress redistribution from the deposition tunnel must be acknowledged. The major horizontal stress is assumed to act along the tun-nel axis, and the stress redistribution from the tuntun-nel in that direction is ne-glected, i.e. SH = Sxx. However, the Syy component in the model is influ-enced by the presence of the deposition tunnel.
Figure 4 shows the results from a simple phase2 simulation applying a stress state as predicted by Martin [2007] at 420m to a horse shoe tunnel of 4.2 times 4.8m. The horizontal stress below the tunnel floor varies between 30.1MPa and 22.5MPa for the interval 0 - -8m. For the modelling campaign in this study the stress at 2m below the floor will be used, i.e. 28.2MPa. The influence of a bevel is ignored.
Figure 4. Horizontal stress below tunnel floor from stress redistribution at depth 420m following the stress model by Martin [2007]. green - open excavation, blue - excavation filled with bentonite.
Figure 5 shows the results from a simple phase2 simulation applying a stress state as predicted by Ask et al. [2007] at 420m to a horse shoe tunnel of 4.2 times 4.8m. The horizontal stress below the tunnel floor varies between 12.4MPa and 10.0MPa for the interval 0 - -8m. For the modelling campaign in the study the stress at 2m below the floor will be used, i.e. 12.2MPa. Also for this case a bevel is ignored.
Figure 5. Horizontal stress below tunnel floor from stress redistribution at depth 420m following the stress model by Ask et al. [2007]. green - open excavation, blue - excavation filled with bentonite.
A backfill with compacted bentonite (Young‘s modulus approx. 100MPa) reduces the resulting horizontal stresses (cf. Figures 4 and 5). At -2m the stress is reduced by roughly 3MPa.
5.3.2. Fluid pressure
The fluid pressure Pp is assumed to be hydrostatic after the introduction of the bentonite and the closure of the repository. No fluid motion is consid-ered. The fluid pressure for the respective models is set to Pp = 4MPa. For the fluid pressure Pp during the ice cover the reader is referred to the respec-tive modelling section.
5.3.3. Swelling pressure
High compacted bentonite is considered one of the barriers of the multi-barrier concept. It will be emplaced between the canisters and the rock mass. The swelling pressure of the bentonite was examined by Harrington and Birchall [2007]. It was reported to be about 5.5MPa to 7.2MPa at low back-ground pressures of the saturating fluid. The two swelling pressures are con-sidered in the simulations.
5.3.4. Ice cover
It is reported that Sweden will be potentially covered by an ice cover of 3,000m thickness. This will introduce an extra vertical stress of 30MPa on the repository that superimposes to the given in situ vertical stress Sv = Szz. In the models only an increase of Syy is considered, ignoring other stress increasing of relieving effects. Figure 6 shows a phase2 FEM analysis look-ing at the influence of an ice cover dead load of increaslook-ing magnitude, i.e. 1.000m, 2.000m and 3.000m. The influence is highest below the tunnel floor, but equilibrates below -2m for the different ice cover thicknesses. For simulating the ice cover an increase of Syy to 24.5MPa is anticipated; Sxx is kept constant ignoring potential isostatic effects.
If the soil will be frozen during the ice cover period, no significant fluid pressure increase will act on the repository levels. If the ground is not frozen the ice melting at the ground of the cover might add a fluid pressure to the reservoir that is a high as the water column at the repository depth. Hence a fluid pressure increase of ΔPp = 30MPa is considered.
Assuming that at an early stage of the ice age the full fluid pressure was developed, and at a later stage the soil was frozen, so the increased fluid pressure is trapped at almost full magnitude, this might introduce hydraulic fracturing at the unloading accompanying the ice melting. A simulation highlighting this scenario is presented.
Figure 6. Influence of ice cover thickness on the Syy stress below the bentonite filled tunnel floor. Only an increase of the vertical load is considered. At a distance of -2m about 24 to 25 MPa is acting in the Syy direction. Blue - ice cover = 0m; 11MPa vertical; 21MPa horizontal, red - 1000; 21; 21, magenta - 2000; 31; 21, green - 3000; 41; 21.
5.4. Temperature conditions
5.4.1. In situ temperature
The in situ temperature is reported to be about 10.5°C at 400m to 12.8°C at 600m depth (SKB [2008], SKB [2009a]). The values are given in Table 7. These temperatures are used in the numerical simulations as starting temper-atures for the rock mass. The air temperature is estimated at about 15°C for all depth levels.
Table 7. In situ temperatures (SKB [2008], SKB [2009a]).
5.4.2. Temperature evolution and heating scheme
After the closure of the repository the waste will produce heat. It is antici-pated in this modelling campaign that the temperature at the bentonite / rock contact in the deposition holes reach up to 75°C. The increase and decrease in temperature is modelled in distinct steps, i.e. 15°C, 25°C, 50°C, 75°C, 50°C, 25°C, 10°C.
5.4.3. Ice cover
It is assumed that the ice cover will not freeze the ground at 400m below ground or deeper. The influence of the ice cover cooling effect on the reposi-tory is ignored.
5.5. Discrete fracture network DFN
The rock mass usually contains a number of fractures. They are geometrical-ly defined by length, orientation and persistence. These discontinuities may alter the fracturing behaviour of the rock mass surrounding the excavations. The fracture sets for this study are generated using the DFN by Fredriksson and Olofsson [2005]. Figure 7 shows their DFN which is used for the up-coming models. Within this DFN different locations for the excavations were tested, these are reproduced in Figures 8 and 9. Their location within the DFN model is given in Figure 10.
Figure 7. Fracture network by Fredriksson and Olofsson [2005]. SH is in vertical direction in their modelling campaign.
Figure 8. DFN I as used in the simulation campaign. The location within the DFN by Fredriksson and Olofsson [2005] as shown in Figure 7 is sketched in Figure 10. The numbering of the fractures refers to the numbering in the fracod2d files (Appendix).
Figure 9. DFN II as used in the simulation campaign. The location within the DFN by Fredriksson and Ol-ofsson [2005] as shown in Figure 7 is sketched in Figure 10. The numbering of the fractures refers to the numbering in the fracod2d files (Appendix).
6. Model validation
6.1. Rock model
The deposition holes are assumed to be stable at initial conditions, hence no significant fracture initiation should be assumed. This assumption is tested on a static model with the excavations introduced. The models show no frac-turing, hence the parameter set can be granted valid (c.f. Figure 11).
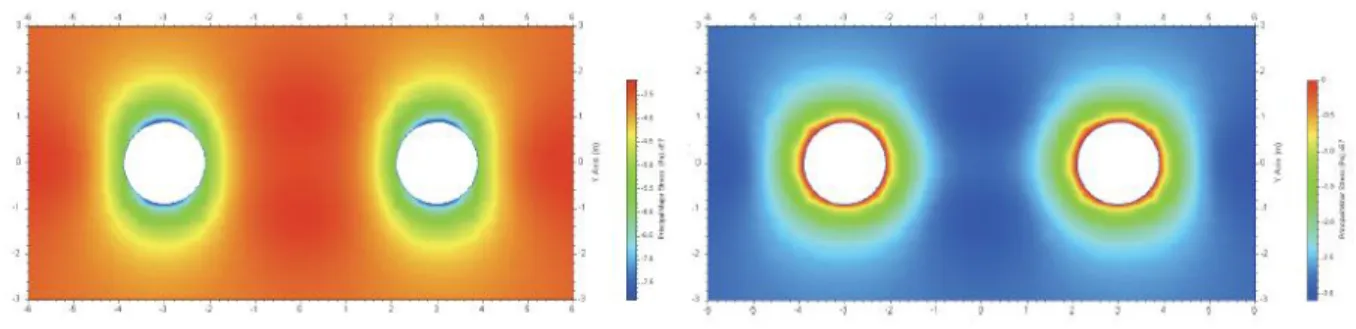
Figure 11. Simulation run with static conditions and without DFN showing no fracture initiation. The major principle stress S1 (left) and minor principle stress S3 (right) are depicted. Hence the input parameter set can be assumed valid.
From a simple Kirsch solution based calculation the maximum tangential stress σθ around the canister holes is
3SHSyy339MPa28MPa89MPa
which is well below the UCS of about 116MPa. Martin [2005] also con-firmed that no significant spalling is to be expected at the 400m level.
6.2. Distinct fracture network model
At the in situ conditions the fracture set without any excavations can be ex-pected to be stable, i.e. no fracturing is achieved.The DFN properties as given by SKB are used in the DFN models to test if stable conditions are achieved in the models, hence no significant fracture growth takes place. The DFN I and II (c.f. Figs. 8 to 10) were subject to the stress fields at 400m and 500m levels as given by Martin [2007] and Ask et al. [2007]. The input parameters were chosen as summarised in Chapter 5. Figure 12 displays exemplarily the DFN I at the highest stresses after the simulation showing no significant fracture growth. The same statement is valid for the other DFN model (see Tab. 8). Hence, the mechanical fracture properties as given by SKB may be used in the study.
Table 8. Results from the validation of the input parameters for the different DFN.
Figure 12. DFN I subject to the stress field at 500m depth as defined by Martin [2007]. No significant fractur-ing was introduced (i.e. only on two fractures one fracture increment) → compare to the input DFN I in Figure 8.
7. Results
7.1. Overview to simulation campaign
Table 9 summarises the simulations that are used in the results chapter. Be-sides, several test runs had to be performed for stability and verification rea-sons that yielded confirmation in the stability of the models and confidence in the results. The listings and detailed descriptions of the individual simula-tions are given in the appendix.
Table 9. Overview to simulations. Legend: 1) according Martin [2007]; 2) according Ask et al. [2007]; 3) unloading of ice cover load at constant high fluid pressure, appx: see appendix for figures.
7.2. Effect of loading history without DFN (IM-2)
The simulation campaign highlighted in this section shows the resulting stress and temperature fields from the boundary conditions specified. No DFN is considered in these simulations; however fracture initiation accord-ing to the specified Mohr-Coulomb model is allowed.
Table 11. Conditions of the simulation IM-2 subject to the stress field according to (Martin, 2007) with a swelling pressure of 5.5MPa.
Figure 13 shows the evolution of temperature and stress for the individual simulation steps.
The introduction of the excavations results in an increase of stresses around the deposition holes (Step A). The S1 stress field becomes elliptical due to the differential stress field applied from the access tunnel. Notice that the applied stress field mirrors a horizontal section two meters below the access
tunnel floor. The simulated temperature field is symmetric round the deposi-tion holes, with 15°C at the hole wall and 10.5°C in the rock mass.
After the closure of the access tunnel (Step B), the tangential stress from the tunnel acting on the deposition hole is reduced assuming a full backfill with a soft material. This minor reduction has no significant effect on the stress field.
After the closure of the repository with increase of water head the bentonite in the deposition holes will start to swell (Step C). This introduces a swelling pressure that reduces the magnitude of stress redistribution.
In Steps D to F the temperature of the deposition hole walls are increased quite rapidly to 75°C. The temperature in the rock mass increases and intro-duces increased stresses. The increase in max S1 is about ΔS1 = 20MPa. In Steps G to I the temperature of the deposition hole walls is slowly reduced to 10°C. The highest temperatures in the simulations are between the deposi-tion holes as a remnant of the higher temperatures at the deposideposi-tion hole walls. Max S1 is reduced by ΔS1 = -21MPa.
The application of the ice cover to the model results in a pronounced in-crease of S1 by ΔS1 = +50MPa (Step J). The subsequent inin-crease of water head reduces the S1 again (Step K).
During all steps no fractures were initiated.
Figure 13. Temperature and stress evolution of model without DFN (IM-2). Thickening of lines show application of a fluid pressure. For discussion refer to the description of the steps and the main text.
Step A. The excavations are introduced in the static stress field according to Martin [2007]. The rock mass temperature is 10.5°C and the air temperature in the unsupported deposition holes is 14.5°C. // max. T = 14.5°C, max S1 = 79MPa.
Step B. After the closure of the repository the applied stress is decreased due to the backfill of the tunnel. The temperature of the deposition hole walls is not changed. // max. T = 14.5°C, max S1 = 78MPa.
Step C. A swelling pressure (5.5MPa) and the recovery of the water head (4MPa) are applied. // max. T = 14.5°C, max S1 = 69MPa.
Step D. The temperature at the wall of the deposition holes is increased from the initial 14.5°C to 25°C. Exposition time approx. 22a. // max. T = 25°C, max S1 = 73MPa.
Step E. The temperature at the face of the deposition holes is increased to 50°C. Exposition time approx.22a. // max. T = 50°C, max S1 = 80MPa.
Step F. The temperature at the face of the deposition holes is increased to 75°C. Exposition time approx. 22a. // max. T = 75°C, max S1 = 89MPa. 134.101110.backers.09b2.fr | 73 | 10.11.2010 21.
Figure 13. Temperature and stress evolution of model without DFN (IM-2). Thickening of lines show application of a fluid pressure. For discussion refer to the description of the steps and the main text.
Step G. The temperature at the face of the deposition holes is decrease to 50°C. Exposition time approx. 3000a. // max. T = 51°C, max S1 = 82MPa.
Step H. The temperature at the face of the deposition holes is decreased to 25°C. Exposition time 9e10s. // max. T = 25.2°C, max S1 = 76MPa.
Step I. The temperature at the face of the deposition holes is decreased to 10°C. Exposition time 9e10s. //. T ~ 10°C, max S1 = 68MPa.
Step J. As for simulation of an ice cover of approx. 3km additional load of 24.5MPa (Syy due to redistribution around backfilled tunnel) is added. // T ~ 10°C, max S1 = 118MPa.
Step K. The water head is increased by 30MPa due to an assumed ice cover fully hydraulically connected to the repository. // T ~ 10°C,max S1 = 84MPa.134.101110.backers.09b2.fr | 73 | 10.11.2010 22
Figure 13. Temperature and stress evolution of model without DFN (IM-2). Thickening of lines show application of a fluid pressure. For discussion refer to the description of the steps and the main text.
7.3. Evolution of fracture network DFN I under high
in-situ stress field
The evolution of DFN I subject to the high in-situ stress field according to Martin [2005] was studied with the full heating sequence for two swelling pressures. The model parameters are given in Table 11.
Table 11. Conditions of the simulations subject to the stress field according to Martin [2007] with two swelling pressures.
Only few fractures propagate short distances due to the stress redistribution of the excavations. The swelling pressure introduces limited additional stable fracturing irrespective of magnitude. Neither the backfill nor heating se-quence results in significant fracture propagation. The increase in load from the ice cover introduces only minor fracturing. The increase in fluid pressure from the top of the ice sheet causes some fracturing that may lead to poten-tial flow paths between the deposition holes. Figure 14 shows an example of the developed fracture pattern.
Figure 14. Example of the fracture evolution in a stress field according to Martin [2005]. (simulation IM-9, last stage).
7.4. Evolution of fracture network under low in-situ
stress field
The evaluations of rock stresses at Forsmark by Ask et al. [2007] have yield-ed a significantly lower in-situ stress field comparyield-ed to Martin [2007]. As-suming the loading history will be the same from the reduced starting values of Ask et al. [2007], and as the ice age has shown to significantly enhance fracturing, a series of simulations at low in-situ stress values was conducted. The conditions of the model are given in Table 12.
Table 12. Conditions of the simulations subject to the stress field according to Ask et al. [2007] for two swell-ing pressures.
The introduction of the excavations and the reduction of Syy due to the backfill only show minor fracture propagation. But already the combination of swelling pressure and in particular water pressure after the closure of the repository results according to the simulations in significant fracture growth connecting the deposition holes. Addition of thermal loads enhances fracture growth. It appears that fracture growth at peak temperature seems to be un-stable2 - hence additional study of this case should be performed. Figure 15 shows an example of a developed fracture pattern.
2 The five cycles of fracture growth appear not to be sufficient to reduce the energy in the system sufficiently.
Hence, additional computing would be required to study the influence of the peak temperature. As an artefact of this instability of the computational step fracturing is proceeding in the cooling phase.
Figure 15. Example of the fracture evolution in a stress field according to Ask et al. [2007] with increased water head from an ice sheet. (simulation IA-2, last stage).
7.5. The influence of the fluid pressure from an ice
cover
The previous analyses have shown that the fluid pressure resulting from an ice cover has the highest impact on the fracture growth of DFN I. Therefore, the fluid pressure under ice cover load is stepwise increased in the following simulations. Table 13 summarises the boundary conditions.
Table 13. Conditions of the simulations aiming at studying the influence of the ice cover. Legend: 1) according
Martin [2007]; 2) according Ask et al. [2007].
At the conditions of high in-situ stress only few fractures propagate short distances due to the stress redistribution from the excavations. Neither the backfill, swelling pressure nor heating sequence gave significant fracture propagation. While the increase in load from the ice cover introduces only minor fracturing, the additional increase in fluid pressure introduces some fracturing that may lead to potential connection of the deposition holes. The hydraulic connection in the example is achieved above Pp > 44MPa. At low in-situ stress condition also only few fracture propagate short
dis-due to recovery of water head already introduces significant fracture propa-gation and DFN development. Hydraulic connection is already achieved at Pp < 4MPa. The increase in load due to the ice cover stabilises the fractures slightly, the increase in fluid pressure due to the ice cover introduces severe fracturing again. At some point almost all fractures have run into an arrester position so that a further increase in Pp does not introduce additional fracture propagation. As the initiation of new fractures is not activated it may be dis-cussed if new fractures would be created; this is beyond the scope of this study, as the applied Pp from the ice cover can already be assumed quite high.
It has to be emphasised that this is valid for the given DFN. The results so far have shown the great potential of this loading to introduce full hydraulic connection. Therefore additional simulations should be performed to deter-mine the potential of this scenario.
Figure 16 compares the DFN after a water head of 60MPa was applied.
Figure 16. Comparison of DFN development at high (left, Martin [2005], simulation IM-7) and low (right, Ask et al. [2007], simulation IA-4) in-situ stresses after application of additional water head up to 60MPa. Both models show hydraulic connection of the deposition holes.
7.6. Evolution of fracture network DFN II
For comparison DFN II (see Fig. 9) is implemented to see if the fracture evolution is changed due to the orientation of the majority of fractures per-pendicular to SH = Sxx. Table 14 summarises the boundary conditions. Table 14. Overview of simulations of the DFN II development. Legend: 1) according Martin [2007]; 2) according
Ask et al. [2007].
At the conditions of the stress field by Martin [2005] only few fractures propagate short distances due to the loading history until the increased water
pressure from the ice cover is applied. The water head from an ice cover might introduce hydraulic fracture growth of individual fractures.
At conditions of the low stress field Ask et al. [2007] few fractures propa-gate short distances due to the loading history until the ice cover induced increase in Syy. The Syy increase without increase in Pp resulted in some fracture growth. The additional water head from an ice cover might intro-duce severe hydraulic fracture growth. Due to the orientation of the fractures in DFN II perpendicular to Sxx a direct hydraulic connection is less pro-nounced as with DFN I.
Figure 17. Comparison of DFN II development at high (left, Martin [2005], simulation IIM-1) and low (right, Ask et al. [2007], simulation IIA-1) in-situ stresses after application of a complete 3km additional water head.
7.7. Post glacial scenario
Simulations of the scenario for glaciation so far has shown minor influence of the increase in vertical load, resulting in a tangential stress increase affect-ing the deposition holes, but a strong influence of the accompanied increase of water pressure on the fracture growth and in particular in the low in-situ stress scenario. The increase in vertical load from the ice sheet should com-pensate to some extend for the increase in water pressure. Assuming that on the melting of the ice cover the water pressure is not reducing as fast as is the vertical load, this might be e.g. due to a permafrost zone, a simulation is run that takes the vertical load due to the ice cover off the model, but main-tains the water pressure. The results are given in Figure 18.
The model in this simulation includes DFN I and is subject to the stress field by Martin [2007]. After the introduction of the excavations and the closure of the repository, the ice cover load is applied. No heating sequence was modelled, as this showed minor influence in comparable models. After the increase in Syy, the water pressure is increased to Pp = 34MPa, afterwards the Syy is reduced by 24,5MPa at maintaining the increased Pp at 34MPa. The simulation resulted in a complete hydraulic connection between the deposition hole. Although the loading sequence is extreme, it clearly shows the influence of a high pore pressure.
Table 15. Conditions of the simulations subject to the stress field according to Martin [2007] without heating scenario but reduction of Syy at high pore pressure.
Figure 18. Fracture network for an overpressure scenario from the glaciation. At full Pp = 34MPa the load of the ice cover is removed, hence the stress field is again as defined by Martin [2007]. However, the water pressure Pp is assumed trapped, introducing severe fracturing and formation of hydraulic connection of the deposition holes.
7.8. Comparison of simulation of models with and
without fracture initiation
The majority of simulations were run without the option of new fractures to be initiated. This was due to computational costs; without the fracture initia-tion opinitia-tion activated the simulainitia-tions took about 40% less computing time. Figure 19 depicts a comparison of two simulations that were run through the complete simulation at identical options except for the option of new frac-tures to be initiated. The general outcome of the two simulations is similar. In the immediate vicinity of the excavations some additional fractures were initiated, changing the general fracture pattern only minor. Comparison of the results of additional simulations on DFN I has confirmed the outcome. The deformation takes place mainly on the fractures, hence the increase in stresses close to the deposition holes is not so pronounced and hence no spalling is introduced.
Table 15. Conditions of the simulations subject to the stress field according to (Martin, 2007) with and without fracture initiation.
Figure 19. Comparison of DFN development in otherwise intact rock with and without fracture initiation. model IM-1 (left) vs IM-9 (right - with fracture initiation). The figures show the fracture network, and the type of fracture. Colour code: blue - currently not loaded, green - shear loaded, red - open. Thickening of lines show application of a fluid pressure. Note the initiation of minor fracturing at the right deposition hole in the (right) picture where fracture initiation was activated.
7.9. Influence of excavation of the deposition holes
Figure 20 compares for DFN I and DFN II the influence of the excavation of the deposition holes in the two stress scenarios. Irrespective of the in-situ stress scenario the fracturing is minor. The potential for fracture growth is low, as the fractures are predominantly neither loaded in shear nor in tensile; hence their activation potential is low.
Table 16. Conditions of the simulations subject to different stress fields and DFNs under consideration of the excavation of the deposition holes.
Figure 20. Excavation of the deposition holes generates only little fracture growth in the vicinity of the deposi-tion holes. Left from top to bottom: original DFN I - simuladeposi-tion IM-9, stress by Martin [2007] - simuladeposi-tion IA-1, stress by Ask et al. [2007]; right from top to bottom: original DFN II - simulation IIM-1, stress by Martin [2007] - simulation IIA-1, stress by Ask et al. [2007]. The figures show the fracture network, and the type of fracture. Colour code: blue - currently not loaded, green - shear loaded, red - open.
8. Interpretation and Discussion
The simulations incorporate the complete assumed loading history of a re-pository at Forsmark in the configuration of two neighbouring deposition holes. The loading sequence includes the closure of the repository including the backfill of the tunnel, the swelling pressure of the compacted bentonite in the deposition holes, a full thermal cycle up to 75°C and following cooling, and subsequently the increase of vertical in-situ stress from an ice cover of thickness 3,000m in combination with the increase in fluid pressure in the repository due to a hydraulic connection to the top of the ice sheet. The anal-ysis was performed for two stress scenarios; i.e. the scenarios by Martin [2007] and Ask et al. [2007].
In general it can be concluded that the increase of fluid pressure has the most significant influence on the development of the fracture network and hence has the highest potential to create fluid pathways for radionuclides between deposition holes. Figure 21 interprets the principle results.
Figure 21. Summary of the principle modelling results. The different phases of the simulation are given along the horizontal direction, while the two assumed DFN are given in the vertical. The bottom lines are for the stress field by Martin [2007], the top lines by Ask et al. [2007]. The diagram shows that DFN I subjected to water head increase during glaciation is the most severe case at both stress field scenarios. The low stress field scenario by Ask et al. [2007] enhances fracturing during the thermal cycle also.
The distinct fracture network was generated from the data provided by SKB. The DFNs were loaded with the provided in-situ stress conditions and showed no significant fracture growth, i.e. the DFNs are stable under the given conditions as should be expected for existing in-situ conditions. The majority of fractures showed no sign of tensile or tractile loading. Hence the DFN model used for this study is assumed valid. A sensitivity analysis of the different parameters describing the fractures of the DFNs is beyond the scope of this study.
The simulations have shown that the excavation of the deposition holes only activates few fractures in the vicinity of the deposition holes (Figure 20). The potential for fracture growth appears low. Spalling is also not predicted; the majority of deformations appear to take place on the fractures.
Also, the change of stress field as may be expected from backfill of the tun-nels shows no effect on the DFN. The backfill reduces the tangential stress on the access tunnel and hence reduces the Syy stress on the deposition holes. Although the difference in Syy and Sxx is reduced and hence changes the minimum and maximum tangential stress on the deposition holes no significant fracture growth was initiated.
The swelling pressure, irrespective of magnitude, reduces the tangential stresses on the deposition holes and no significant fracture growth was ob-served. However, rising of the fluid pressure in the repository to the hydro-static head resulted in fracture growth at the low in-situ stress scenario as reported by Ask et al. [2007].
beginning of the increase of temperature from the waste canisters in the sim-ulation sequence. The stepwise increase and decrease of temperature can be assumed to deliver realistic thermal stresses that may lead to fracture growth. However, the results show that the thermally introduced stresses in the vicin-ity of the deposition holes cause limited impact on the DFN development in case of the high in-situ stress field as presented by Martin [2007]. In con-trast, at low in-situ stresses the thermal load will propagate the fractures leading to a hydraulic connection between the deposition holes, this even without the relevelling of the hydrostatic pressure (simulation IA-5). The increase of Syy due to an ice load has in all models shown minor influ-ence on the DFN development. It has to be emphasised that the increase of vertical stress due to an ice cover has been considered without allowing for an increase of the horizontal stresses at deposition level. Hence, the influ-ence of the ice sheet loading on Sxx in the models is ignored. It can be as-sumed that the horizontal stress might be increased with implications for the DFN stability.
An increase of water head in combination with an ice cover from future gla-ciation has shown the most prominent effect on the DFN development. For the high in-situ stress regime (Martin [2007]) the hydraulically introduced fracture growth is moderate; under the assumption of low in-situ stresses (Ask et al. [2007]) the fracture network is severely extended forming poten-tial hydraulic connections between the deposition holes. Further, it was shown that if the increase in stress field from the ice cover is reducing faster than the fluid pressure there is a potential for hydraulic driven fracture growth also for the case of a high in-situ stress regime.
9. Conclusions
The numerical modelling campaign aimed at simulating the development of the distinct fracture network under variable geomechanical boundary condi-tions in a KBS-3V repository for spent nuclear fuel at Forsmark, Sweden. The models mirror the excavation of the deposition holes, the backfill of the tunnel, the readjustment of the water head, the swelling of the bentonite buffer and a full sequence of heat generation from the canisters. The temper-ature evolutions was modelled from in-situ conditions up to 75°C rock wall temperature, including a cooling phase down to repository conditions of about 10°C. The simulations were run for two different distinct fracture net-work models and two stress regimes, i.e. the stress models by Martin [2007] and Ask et al. [2007].
In addition a glaciation scenario was added to the modelling campaign. The glaciation scenario included the increase in vertical load due to an ice cover of 3km thickness and the increase of fluid pressure to 34MPa due to a hy-draulic connection with the ice cover.
The simulation results show that during the operation, closure and thermal phase of the repository no major DFN alterations are observed, that may lead to hydraulic connections of the excavations. An increase of water head has
been shown to have the most pronounced impact on the distinct fracture network evolution at the given boundary conditions.
The understanding of the stress field at Forsmark appears to be critical for the extension of the fractures. The low magnitude stress field (Ask et al. [2007]) enhances the propagation of existing fractures in the network. The high magnitude stress field (Martin [2007]) tends to close the fractures and mobilise the frictional resistance of the fracture faces.
10. References
Ask, D., F. Cornet, et al. (2007). Stress measurements with hydraulic meth-ods in boreholes KFM07A, KFM07C, KFM08A, KFM09A and KFM09B. SKB Report, SKB.
Backers, T. (2010). "Applications of fracture mechanics numerical model-ling in rock engineering." First Break 28.
Backers, T. and O. Stephansson (2008). Modelling of Fracture Initiation, Propagation and Creep of a KBS-3V and KBS-3H Repository in Sparsely Fractured Rock with Application to the Design at Forsmark Candidate Site. GeoFrames Report: 175.
Benz, T. and R. Schwab (2008). "A quantitative comparison of six rock fail-ure criteria." International Journal of Rock Mechanics and Mining Sciences 45(7): 1176-1186.
Eriksson, M., J. Petersson, et al. (2009). Underground design Forsmark Lay-out D2 - Rock mechanics and rock support. SKB Report, SKB: 54.
Fredriksson, A. and I. Olofsson (2005). Rock mechanics site descriptive model– theoretical approach. Preliminary site description Forsmark area – version 1.2. SKB Report, SKB: 56.
Glamheden, R., F. Lanaro, et al. (2008). Rock mechanics Forsmark Model-ling stage 2.3 - Complementary analysis and verification of the rock me-chanics model. SKB Report, SKB: 81.
Harrington, J. and D. Birchall (2007). Sensitivity of total stress to changes in externally applied water pressure in KBS-3 buffer bentonite. SKB Technical Report, SKB.
Martin, C. D. (2007). Quantifying in situ stress magnitudes and orientations for Forsmark. Forsmark stage 2.2. SKB Report, SKB: 95.
Martin, D. (2005). Preliminary assessment of potential underground stability (wedge and spalling) at Forsmark, Simpevarp and Laxemar sites. SKB Re-port, SKB.
Moeck, I., T. Backers, et al. (2007). Assessment of Mechanical Wellbore Stability by Numerical Analysis of Fracture Growth. EAGE 69th Conference & Exhibition. London, EAGE.
Quesada, D., D. Picard, et al. (2008). "The role of the interbed thickness on the step-over fracture under overburden pressure." International Journal of Rock Mechanics and Mining Sciences In Press, Corrected Proof.
Shen, B. and O. Stephansson (1993). "Modification of the G-criterion of crack propagation in compression." Int. J. Eng. Fract. Mech. 47: 177-189. SKB (2008). Site description of Forsmark at completion of the site investiga-tion phase, SDM-Site Forsmark. SKB Technical Report, SKB: 545.
SKB (2009a). Site engineering report Forsmark - Guidelines for under-ground design step D2. SKB Report, SKB: 142.
Appendix
11. Simulations
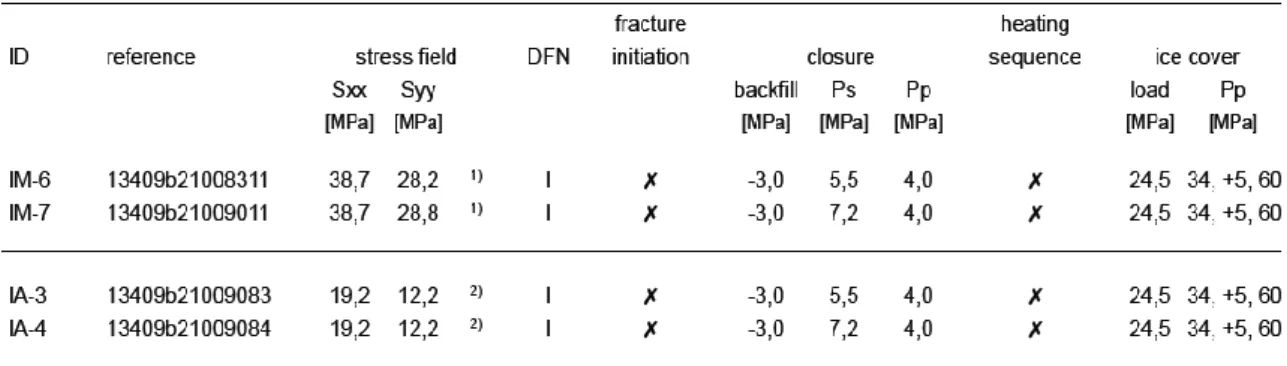
11.1. Simulation IM-6
The model in this simulation includes DFN I and is subject to the stress field according to Martin [2007]. It features only a limited loading history includ-ing low swellinclud-ing pressure Ps, but no heatinclud-ing sequence. As the fluid pressure has shown pronounced effect on the fracture growth, the fluid pressure under ice cover load is stepwise increased.
Only few fractures propagate short distances due to the stress redistribution of the excavations. Neither the backfill, swelling pressure nor heating se-quence show significant fracture propagation. While the increase in load from the ice cover introduces only minor fracturing, the increase in fluid pressure introduces some fracturing that may lead to potential connection of the deposition holes. The hydraulic connection in the example is achieved above Pp > 44MPa. It has to be emphasised that this is valid for the given DFN. The results so far have shown the great potential of this loading to introduce full hydraulic connection.
Figure a. Fracture network evolution (13409b21008311). Stress field accord-ing to Martin [2007], DFN I, low swellaccord-ing pressure, no heataccord-ing sequence, ice cover and extended ice load fluid pressure. The figures show the fracture network and the type of fracture. Colour code: blue - currently not loaded, green - shear loaded, red - open. Thickening of lines show application of a fluid pressure.
Fracture network after introduction of the excavations. Only few fractures propagated due to the redistribution of the stresses. Stress field according to Martin [2007]; DFN I.
After the closure of the repository the applied stress is increased due to the backfill of the tunnel. This has no significant impact on the DFN.
Figure a. Fracture network evolution (13409b21008311). Stress field accord-ing to Martin [2007], DFN I, low swellaccord-ing pressure, no heataccord-ing sequence, ice cover and extended ice load fluid pressure. The figures show the fracture network and the type of fracture. Colour code: blue - currently not loaded, green - shear loaded, red - open. Thickening of lines show application of a fluid pressure.
The swelling pressure (5.5MPa) and the recovery of a water head (4MPa) show no impact on the DFN.
As for simulation of an ice cover of approx. 3km additional load of 24.5MPa (Syy due to redistribution around backfilled tunnel) is added resulting in no major changes of the DFN or aperture.
The water pressure acting on the deposition holes and the fractures is increased from Pp = 34MPa in steps of 5MPa. Pp = 39MPa
Pp = 44MPa. Fracture growth.
Figure a. Fracture network evolution (13409b21008311). Stress field accord-ing to Martin [2007], DFN I, low swellaccord-ing pressure, no heataccord-ing sequence, ice cover and extended ice load fluid pressure. The figures show the fracture network and the type of fracture. Colour code: blue - currently not loaded, green - shear loaded, red - open. Thickening of lines show application of a fluid pressure.
Pp = 54MPa. Fracture growth.
Pp = 59MPa. Fracture growth.
Figure a. Fracture network evolution (13409b21008311). Stress field accord-ing to Martin [2007], DFN I, low swellaccord-ing pressure, no heataccord-ing sequence, ice cover and extended ice load fluid pressure. The figures show the fracture network and the type of fracture. Colour code: blue - currently not loaded, green - shear loaded, red - open. Thickening of lines show application of a fluid pressure.
Pp = 69MPa. Fracture growth.
Pp = 74MPa. Fracture growth.
11.2. Simulation IM-7
The model in this simulation includes DFN I and is subject to the stress field according to Martin [2007]. It features only a limited loading history includ-ing high swellinclud-ing pressure Ps, but no heatinclud-ing sequence. As the fluid pressure has shown pronounced effect on the fracture growth, the fluid pressure under ice cover load is stepwise increase.
Only few fractures propagate short distances due to the stress redistribution of the excavations. Neither the backfill, swelling pressure nor heating se-quence show significant fracture propagation. While the increase in load from the ice cover introduces only minor fracturing, the increase in fluid pressure introduces some fracturing that may lead to potential connection of the deposition holes. The hydraulic connection in the example is achieved above Pp > 44MPa as it was also at the low swelling pressure of 5.5MPa. It has to be emphasised that this is valid for the given DFN. The results so far have shown the great potential of this loading to introduce full hydraulic connection.
Figure b. Fracture network evolution (13409b21009011). Stress field accord-ing to Martin [2007], DFN I, high swellaccord-ing pressure, no heataccord-ing sequence, ice cover and extended ice load fluid pressure. The figures show the fracture network and the type of fracture. Colour code: blue - currently not loaded, green - shear loaded, red - open. Thickening of lines show application of a fluid pressure.
Fracture network after introduction of the excavations. Only few fractures propagated due to the redistribution of the stresses. Stress field according to Martin [2007]; DFN I.
The swelling pressure (7.2MPa) and the recovery of a water head (4MPa) show limited impact on the DFN.
As for simulation of an ice cover of approx. 3km additional load of 24.5MPa (Syy due to redistribution around backfilled tunnel) is added resulting in no major changes of the DFN or aperture.
Figure b. Fracture network evolution (13409b21009011). Stress field accord-ing to Martin [2007], DFN I, high swellaccord-ing pressure, no heataccord-ing sequence, ice cover and extended ice load fluid pressure. The figures show the fracture network and the type of fracture. Colour code: blue - currently not loaded, green - shear loaded, red - open. Thickening of lines show application of a fluid pressure.
The water pressure acting on the deposition holes and the fractures is increased from Pp = 34MPa in steps of 5MPa. Pp = 39MPa
Pp = 49MPa. Fracture growth.
Figure b. Fracture network evolution (13409b21009011). Stress field accord-ing to Martin [2007], DFN I, high swellaccord-ing pressure, no heataccord-ing sequence, ice cover and extended ice load fluid pressure. The figures show the fracture network and the type of fracture. Colour code: blue - currently not loaded, green - shear loaded, red - open. Thickening of lines show application of a fluid pressure.
Pp = 59MPa. Fracture growth.
Pp = 69MPa. Fracture growth.
Pp = 74MPa. Fracture growth.
11.3. Simulation IM-9
The model in this simulation includes DFN I and is subject to the stress field according to Martin [2007]. It features the full loading history including low swelling pressure Ps, the heating sequence up to 75°C and the ice cover.
Only few fractures propagate short distances due to the stress redistribution of the excavations. Neither the backfill, swelling pressure nor heating se-quence show significant fracture propagation. The increase of load due to the ice cover in combination with the increase in fluid pressure introduces some fracturing that may lead to potential connection of the deposition holes.
Figure c. Fracture network evolution (13409b21009031). Stress field accord-ing to Martin [2007], DFN I, low swellaccord-ing pressure, heataccord-ing sequence and ice cover. The figures show the fracture network and the type of fracture. Colour code: blue - currently not loaded, green - shear loaded, red - open. Thickening of lines show application of a fluid pressure.
Fracture network after introduction of the excavations. Only few fractures propagated due to the redistribution of the stresses. Stress field according to Martin [2007]; DFN I.
After the closure of the repository the applied stress is increased due to the backfill of the tunnel. This has no significant impact on the DFN.
Figure c. Fracture network evolution (13409b21009031). Stress field accord-ing to Martin [2007], DFN I, low swellaccord-ing pressure, heataccord-ing sequence and ice cover. The figures show the fracture network and the type of fracture. Colour code: blue - currently not loaded, green - shear loaded, red - open. Thickening of lines show application of a fluid pressure.
The swelling pressure (5.5MPa) and the recovery of a water head (4MPa) show no impact on the DFN.
The temperature at the face of the deposition holes is increased from the initial 14.5°C to 25°C. This shows no impact on the DFN.
Temperature at the deposition hole face is increased to 50°C. No impact.
Figure c. Fracture network evolution (13409b21009031). Stress field accord-ing to Martin [2007], DFN I, low swellaccord-ing pressure, heataccord-ing sequence and ice cover. The figures show the fracture network and the type of fracture. Colour code: blue - currently not loaded, green - shear loaded, red - open. Thickening of lines show application of a fluid pressure.
Temperature at the deposition hole face is decreased to 50°C. The aperture of selected fractures reduces. No impact on DFN.
Temperature at the deposition hole face is decreased to 10°C. The aperture of selected fractures reduces. No impact on DFN.
As for simulation of an ice cover of approx. 3km additional load of 24.5MPa (Syy due to redistribution around backfilled tunnel) is added resulting in no major changes of the DFN or aperture.

![Table 7. In situ temperatures (SKB [2008], SKB [2009a]).](https://thumb-eu.123doks.com/thumbv2/5dokorg/3348952.18968/23.892.195.852.824.933/table-in-situ-temperatures-skb-skb-a.webp)
![Figure 7. Fracture network by Fredriksson and Olofsson [2005]. SH is in vertical direction in their modelling campaign](https://thumb-eu.123doks.com/thumbv2/5dokorg/3348952.18968/24.892.198.621.463.879/figure-fracture-fredriksson-olofsson-vertical-direction-modelling-campaign.webp)
![Figure 10. Location of the domains in the DFN of Fredriksson and Olofsson [2005].](https://thumb-eu.123doks.com/thumbv2/5dokorg/3348952.18968/25.892.194.786.480.1078/figure-location-domains-dfn-fredriksson-olofsson.webp)
![Figure 12. DFN I subject to the stress field at 500m depth as defined by Martin [2007]](https://thumb-eu.123doks.com/thumbv2/5dokorg/3348952.18968/27.892.187.719.203.656/figure-dfn-subject-stress-field-depth-defined-martin.webp)
![Table 9. Overview to simulations. Legend: 1) according Martin [2007]; 2) according Ask et al](https://thumb-eu.123doks.com/thumbv2/5dokorg/3348952.18968/28.892.198.851.174.661/table-overview-simulations-legend-according-martin-according-ask.webp)
![Table 11. Conditions of the simulations subject to the stress field according to Martin [2007] with two swelling pressures](https://thumb-eu.123doks.com/thumbv2/5dokorg/3348952.18968/32.892.201.861.618.736/table-conditions-simulations-subject-according-martin-swelling-pressures.webp)
![Figure 14. Example of the fracture evolution in a stress field according to Martin [2005]](https://thumb-eu.123doks.com/thumbv2/5dokorg/3348952.18968/33.892.184.827.127.394/figure-example-fracture-evolution-stress-field-according-martin.webp)