Research
Report number: 2018:24 ISSN: 2000-0456 Available at www.stralsakerhetsmyndigheten.se
Structural equation modelling for
analysis of human and organizational
factors in nuclear power plant control
rooms
2018:24
Author: Martin Castor, GEISTT, Stockholm Jonathan Borgvall, GEISTT, Stockholm
SSM 2018:24
SSM perspective
BackgroundDuring the supervisory work of the Swedish Radiation Safety Authority
(SSM), a need was identified to develop the methods used when evaluating
control room work in the central control rooms of nuclear power plants.
Benchmarking is commonly used today, with reference values from earlier
Integrated System Validation (ISV), when ISV is available. Often, ISV
per-forms well but has some weaknesses. Some of the elements of knowledge
that are currently missing include how to establish strict clarity concerning
the aspects that have individual importance and which aspects are
impor-tant collectively, as well as how to match different measurable aspects.
Improved knowledge in this area, in addition to an advanced method, can
give a credible outcome and provide guidance when formulating
specifica-tions of requirements for requisite skills, provide input for education and
training programmes which may need sharper focus, and achieve a higher
level of knowledge in-house at SSM in relation to supervision in the field.
The assignment to investigate the methods used when evaluating control
room work in the central control rooms was given to GEISTT, which as part
of a research project, placed a focus on how the methods of evaluation
might be improved. This was done by means of an in-depth study of how
data can be analysed and presented using a static method for modelling
called Structural Equation Modelling (SEM). Examples of useful output
from/benefits of SEM include the possibility to integrate the analysis of
several different data collection methods and scales, as well as the
possibil-ity to present the outcomes in a way defining the factors of greatest
sig-nificance, e.g. in order to illustrate acceptance values for different criteria.
SEM can also be used for plant modifications both large and small.
Objective
The method has not yet been applied by the Swedish nuclear power
indus-try. On the other hand, forms of cooperation for development of evaluation
methods have been established not only with other agencies that regulate
the nuclear power industry, but also with IFE/Halden, which have shown
great interest. Based on the stringency and the outcomes produced within
the project, SSM expects that further research will be carried out using
quantities of data formulated/designed/adapted?? to better suit SEM, to
which other sources of funding will also contribute.
Results
The results indicate that SEM is a statistical modelling method that can
meet needs and increase the level of knowledge to possibly benefit
indi-vidual facilities, educational institutions and the Authority. The results also
indicate that when conducting evaluations, it is essential from the outset,
prior to the evaluations, to conscientiously look into how measures and
variables are formulated and to set the parameters for the quantity of data
while considering how the outcomes should be collected and analysed.
SSM 2018:24
Need for further research
A current evaluation method such as ISV is designed to make detailed
information available regarding Human Error Discrepancies, which is
spe-cific to and appropriate for the nuclear power plant in question, and
lim-ited to benchmarking only at this facility. However, since there is a need to
have capability to perform comparisons on a more general level in order to
develop this area of competence, SSM has established that there is a need
for further research. One need that has been identified is investigating
whether it is valuable to study the outcomes from previous evaluations of
integrated systems and to raise them to a higher level of abstraction for the
purpose of achieving comparability and reinforcing the reference values.
Project information
Contact person at SSM: Yvonne Johansson
Reference: SSM2016-690 / 7030057-00
2018:24
Author:Date: November 2018
Report number: 2018:24 ISSN: 2000-0456 Available at www.stralsakerhetsmyndigheten.se
Martin Castor, GEISTT, Stockholm Jonathan Borgvall, GEISTT, Stockholm
Structural equation modelling for
analysis of human and organizational
factors in nuclear power plant control
rooms
SSM 2018:24
This report concerns a study which has been conducted for the
Swedish Radiation Safety Authority, SSM. The conclusions and
view-points presented in the report are those of the author/authors and
do not necessarily coincide with those of the SSM.
Structural equation modelling for analysis
of human and organizational factors in
nu-clear power plant control rooms
Authors: Martin Castor & Jonathan
Borgvall, GEISTT AB
2
Content
1. Executive Summary... 5 2. Sammanfattning ... 6 3. Introduction ... 7 3.1. Background ... 73.2. Rationale for the study ... 7
3.3. SEM at a glance ... 8
3.4. Caveats and delimitations ... 8
3.5. Structure of the report ... 9
4. Integrated System Validation (ISV) ... 10
5. Modeling constructs from Human Reliability Analysis (HRA) ... 12
6. Structural Equation Modeling (SEM) ... 17
6.1. Background to SEM ... 17
6.2. Basic SEM concepts ... 18
6.3. Example model ... 19
6.4. SEM development process ... 21
7. Discussion ... 22
8. References... 28
9. Appendices... 32
9.1. Appendix A: Structural equation modelling pro-cess ... 32
9.2. Appendix B: Performance shaping functions (PSF) taxonomies 38 9.3. Appendix C: Dummy data modeling ... 41
9.4. Appendix D. Alternative and nested models ... 55 9.5. Appendix E. Modeling test with data from a live ISV evaluation . 57
3
Author Note
Dr. Martin Castor, GEISTT AB (Group for Effectiveness, Interaction, Simulation Technology, and Training), Stockholm, Sweden; Mr. Jonathan Borgvall, GEISTT AB, Stockholm, Sweden.
This work was funded by the Swedish Radiation Safety Authority (SSM) and commissioned by SSM to GEISTT AB. The authors express their gratitude to professor emeritus Erland Svensson for his review of a draft version of the report. Correspondence concerning this report should be sent to Dr. Martin Castor, GEISTT AB, Isafjordsgatan 39B, 164 40 Kista, Stockholm, Sweden. E-mail:
4
Figures
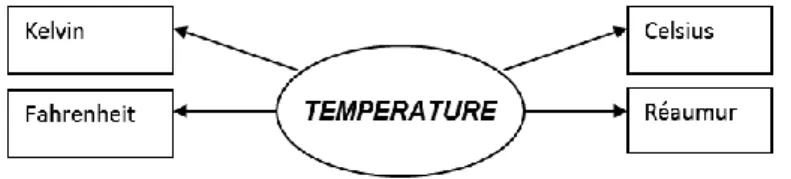
Figure 1. The latent construct Temperature and some manifest measures. ... 12
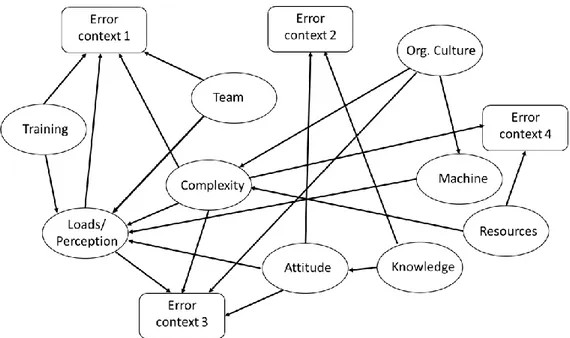
Figure 2. 9-bubble model from Groth (2009). ... 13
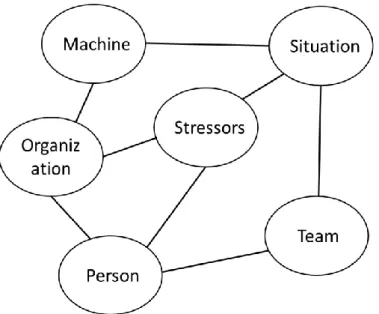
Figure 3. 6-bubble model from Groth and Mosleh (2010a). ... 14
Figure 4. Path diagram showing the relative relationship among SPAR-H PSFs. .... 14
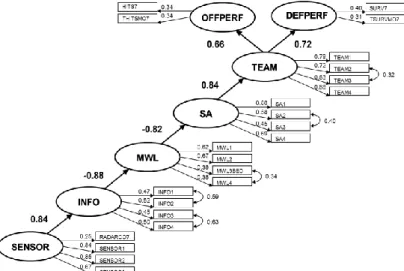
Figure 5. Example model from aviation research (Castor, 2009). ... 19
Figure 6. Example model based on ISV dummy data. ... 21
Figure 7. Model based on dummy data before specification search. ... 22
Figure 8. Model based on dummy data after specification search. ... 23
Figure 9. Model from dummy database, testing the original main hypothesis. ... 23
Figure 10. Three models of a snowflake, described on three levels of abstraction. . 27
Figure 11. Selecting the appropriate level of resolution in a model. ... 27
Figure 12. Main hypothesis for example model based on ISV dummy data. ... 41
Figure 13. OKG O2 control room simulator at Halden. ... 45
Figure 14. A schematic representation of the research design. ... 45
Figure 15. Participant flow through the stages of the experiment ... 46
Figure 16. Data normality example. ... 46
Figure 17. Bar graph of the TP_PerformanceTime variable. ... 47
Figure 18. Scree plot from EFA. ... 49
Figure 19. CFA results... 51
Figure 20. Full structural model, based on EFA observations. ... 52
Figure 21. Full structural model, after consulting the modification indices. ... 53
Figure 22. Full structural model testing the original main hypothesis. ... 54
Figure 23. Model with a latent variable removed. ... 55
Figure 24. Model with new latent variables included. ... 55
Figure 25. Model with more starting points ... 55
Figure 26. Sub-models, e.g. Workload and Task Performance. ... 55
Figure 27. Model with alternative effect flow. ... 56
Figure 28. Model with another alternative effect flow. ... 56
Tables
Table 1. Crosswalk of PSFs by Boring (2010). ... 15Table 2. THERP PSFs (Swain & Guttman, 1983). ... 38
Table 3. Groth’s (2009) 9-bubble model of PSFs. ... 39
Table 4. Groth and Mosleh’s (2010a) 6-bubble model of PSFs. ... 40
Table 5. Descriptive statistics Task Performance measures. ... 47
Table 6. Descriptive statistics Teamwork measures. ... 47
Table 7. Descriptive statistics Situation Awareness measures. ... 48
Table 8. Descriptive statistics Workload measures. ... 48
Table 9. Descriptive statistics Usability measures. ... 48
Table 10. Pattern Matrix for Exploratory Factor Analysis ... 49
5
1. Executive Summary
Major changes to a nuclear power plant, e.g. modernization of the central control room, usually requires an Integrated System Validation (ISV) evaluation to be conducted to ensure that safe operations can be maintained after the changes have been implemented. For changes to a central control room, the impact on human and organizational factors such as interactions between humans and systems as well as work process, instructions etc. need to be carefully evaluated, proposedly supported by a range of heterogeneous datasets to be assessed before changes can be declared safe for implementation.
Structural Equation Modelling (SEM) is a quantitative, second generation multivariate statistical analysis method that combines the benefits of path analysis, factor analysis, and multiple regression analysis. Basically, SEM tests if a modellers theory, expressed in the model, fits the data and SEM is thus primarily a so called confirmatory method. Several alternative models can usually be specified, but SEM provides several goodness of fit - values of how well a model explains the variance of the dataset, which can then be used to compare alternative models.
SEM requires a level of statistical understanding that is often beyond laymen’s understanding. The report provides description of SEM at several different levels, from high level descriptions of the potential of SEM application to step by step descriptions of how a model is developed.
A dummy data set was developed, inspired by a recent ISV process of a Swedish nuclear power plant central control room. SEM models from this dataset are presented to show the potential of SEM for ISV.
The fact that SEM can be used to express relations between variables collected during an ISV is not surprising, given that SEM is a general statistical method designed to describe relations between many variables. The conclusion of the report is that SEM represents a powerful statistical analysis method which is useful for analysis of large and heterogeneous datasets, which is often the case with datasets from operational settings and processes. Accordingly, SEM-analyses make it possible to draw scientifically valid conclusions in operational settings of high operational realism and complexity.
6
2. Sammanfattning
För att säkerställa att säker drift kan upprätthållas efter det att större anläggnings-ändringarna har genomförts i ett kärnkraftverk, t.ex. modernisering av det centrala kontrollrummet, krävs vanligen att Integrerad System Validering (ISV) genomförs. För anläggningsändringar i ett centralt kontrollrum ska påverkan på mänskliga och organisatoriska faktorer som t.ex. samspelet mellan människor och system samt arbetsprocesser, instruktioner m.m. utvärderas noggrant, förslagsvis med stöd av en rad heterogena datamängder som skall analyseras innan förändringar kan förklaras säkra att införa.
Strukturella ekvationsmodeller (SEM) är en kvantitativ, andra generationens multi-variat statistisk analysmetod som kombinerar fördelarna med ”path analysis”, faktoranalys, och multipel regressionsanalys. I grund och botten svarar en SEM analys på hur väl en modellerares teorier, som uttryckts i modellen, passar gentemot en databas. SEM är alltså i första hand en hypotesprövande så kallad konfirmatic statistisk metod. Flera alternativa modeller prövas ofta, och SEM ger värden på hur väl en modell passar eller kan förklara en viss datamängd, vilket således kan användas för att jämföra alternativa modeller.
SEM kräver en nivå av statistisk förståelse som ofta är bortom lekmäns gängse kunskap. Denna rapport beskriver SEM i flera olika nivåer, från att övergripande beskriva SEM och dess potential till att förklara hur SEM bör genomföras steg för steg.
För att svara på frågan avseende lämpligheten i att använda SEM för att analysera ISV-data avseende utvärderingen av operatörers arbete i centralt kontrollrum utvecklades en s.k. ”dummy databas”. Det är alltså en fiktiv databas, men som utvecklats för att i hög utsträckning återspegla hur en databas från en ISV-process avseende centralt kontrollrum skulle kunna se ut. SEM modeller baserat på denna fiktiva databas presenteras för att studera lämplighet och potential i användandet SEM för ISV.
Det faktum att SEM kan användas för att förklara relationer mellan variabler som samlas in under en ISV är inte förvånande med tanke på att SEM är en generell statistisk metod som syftar till att beskriva relationerna mellan många variabler. Slutsatsen i rapporten är att SEM representerar en kraftfull statistisk analysmetod som är användbar för analys av stora och heterogena datamängder, vilket ofta är fallet med datamängder från operativa miljöer och processer.
7
3. Introduction
3.1. Background
The reported study was commissioned to GEISTT AB by the Swedish Radiation Safety Authority (SSM, Sw. Strålsäkerhetsmyndigheten) to inform them on the applicability and value of utilizing the statistical method Structural Equation Modelling (SEM) for analysis and modelling of Human and Organizational Factors (HOF)-data collected during Integrated System Validation (ISV) processes.
3.2. Rationale for the study
The primary purpose of the research was to investigate benefits of SEM as a component of the ISV toolbox. Hence, the focus of the research is method development by evaluating the applicability and value of SEM as a component of ISV. Compared to many ISV processes, where the purpose is to identify detailed HEP or HED (Human Error Probabilities or Human Error Discrepancies) associated with plant or procedures changes, the purpose of this type of modelling effort is to create comparability across ISV results, and build scientific and operational understanding across studies.
SEM has been used as a statistical analysis and modelling method in many behavioural research efforts. SEM can be used to develop data-driven models that explain how selected behavioural constructs relate to each other. Through the modelling process it is also often the case that the measurement tools are refined and the understanding of how different measures relate to each other is further developed. Data collection and data analysis is a constantly recurring challenge when describing and analysing a complex teamwork situation. Typically, numerous, heterogeneous data sources are used to describe the work process and the interaction between human operators, technical systems, and organizational factors. This may generate a dataset which is challenging to compile and present effectively, especially for some types of stakeholders, such as an reviewer at a regulatory agency. SEM provides the statistical capability to quantify the relations between directly measured variables and the not directly measurable variables believed to cause the variations in data. SEM can also express the results in a visual format which facilitates human interpretation.
For situations like control room environments, classical experimental designs are often less appropriate. The complexity and dynamics of the situation is obvious, and it is often not possible to maintain experimental control without losing realism and dynamics. As a complement to classical experimentation, SEM-analyses make it possible to draw scientific conclusions hard to achieve from classical experimental designs (cf. Svensson & Nählinder, 2014).
8
3.3. SEM at a glance
As noted, SEM is a quantitative, second generation statistical analysis method that combines the benefits of path analysis, factor analysis, and multiple regression analysis. LISREL and AMOS are two of the more commonly known software packages offering the computational capability of SEM.
SEM is based on correlational statistics, which means that the linear relationships between variables and the common variance between these variables form the basis for the analyses. Like all statistical methods, SEM has several statistical requirements on the dataset (e.g. normal distribution and independent measures) and assuming those requirements are fulfilled SEM offers powerful capabilities for analysing datasets with diverse variables, e.g. different types of measures (e.g. system-generated measures, self-observations, observer measures etc.) and different scales (e.g. ordinal and interval scales).
SEM presents the degree of relationship between variables in terms of explained variance by statistically testing a hypothesized model in a simultaneous analysis of the entire system of variables, to determine the extent to which the covariance or correlation matrix stipulated by the model is consistent with the matrix based on the empirical data. If the statistical goodness of fit between the two compared matrices is adequate, the model is a plausible representation of the relations between variables that the model developer has specified. It is worth noting that a stipulated model shall reduce the complexity of the manifest or measured variables in terms of a few latent variables or factors of high explanatory power.
Basically, SEM tests if the theory, expressed by the model, fits the data. However, it is important to realize that a SEM never can be accepted, it can only avoid being rejected and several alternative models can usually be specified. SEM provides several goodness of fit values, i.e. values of how well a model explains the variance of the dataset, which can then be used to compare alternative models. Basically, the fit-indices announce the proportion of the common variance between the measured variables that can be explained by the stipulated model. In this way SEM as a tool can advance understanding of the measures along with their relations, allowing an empirically supported model of current best fit to be proposed.
SEM requires a level of statistical understanding that is often beyond laymen’s understanding. SEM is not a “silver bullet” for analysis of human and organizational factors during an ISV, but represents a powerful statistical analysis method which is useful for analysis of large and heterogeneous datasets, which is often the case with datasets from operational settings and processes.
3.4. Caveats and delimitations
Due to a lack of access to a larger data-set from ISV-evaluations of operator performance in the central control room (CKR), analyses and modelling of relevant concepts have been conducted based on dummy data generated for the purposes of showing the steps of SEM. A specific purpose of the report was also to show examples of how results can be reported. This exemplifying SEM-analysis is found in Appendix C.
9
The design of the dummy dataset was inspired by how data was collected during a recent ISV process conducted in Sweden, i.e. it contains similar variables and constructs, but is constructed by the report’s authors. The authors of the report had no influence on the measures used during the real ISV process and there are some notable deviations between the dataset regarding the individual measures and the distribution of the data. The dummy data is far from a random dataset, and data points have been created with careful attention, but it is dummy data and any analysis of the data, e.g. the estimates (values) in the SEM-models presented in the report, must be seen in this light.
Late in the project, SEM was tried on a dataset from a real ISV process. However, this modelling effort did not result in models with satisfactory fit values, which is summarised in Appendix E.
3.5. Structure of the report
The study and this report are intended to describe SEM on several levels, from summaries of the method’s potential to detailed descriptions.
The report initially presents an overview of the purpose and process of an ISV-process (Section 4). The report then describes relevant modelling constructs based on the literature on Human Reliability Analysis (HRA) and specifically Performance Shaping Functions, PSFs (Section 5 and Appendix B). The report then elaborates on the statistical method SEM (Section 6 and Appendix A). The report concludes with a discussion of the value of statistical modelling through SEM (Section 0). More in-depth information, e.g. concerning the SEM-process and PSFs are provided in appendices. A summary of the modelling effort with data from a live ISV process in provided in Appendix E.
To further the understanding of SEM-application, the development of a model, based on a dummy data set, is provided in Appendix C. This appendix contains a dummy example of the method and result sections that typically are reported in experimental studies. The method section describes the measures that the dummy data set was designed to replicate. Rather than just providing a final SEM-model and assuming SEM knowledge of the behalf of the reader, the report provides a worked example of a model development process, based on the dummy-data.
10
4. Integrated System Validation (ISV)
This section contains a brief description of the ISV-process to provide context for the further analysis. The literature offers numerous alternatives for more detailed descriptions of ISV processes, including recommendations and potential for development (e.g. Boring & Lau, 2017; NRC, 2012a; Simonsen, 2016a; Simonsen, 2016b; Rollenhagen, Bladh, Borg, & Evénius, 1998).
NUREG-0711 (NRC, 2012a) state that the objective of validation is to provide evidence, that the integrated system supports plants personnel in safe operation of the plants, i.e., that the integrated design remains within acceptable performance envelopes. ISV is intended to be a validation of the composed functionality of the control room together with all human operators from a human factors perspective. ISV of the central control room (CKR) is further described as performance-based tests, which attempt to determine whether an integrated system’s design (i.e. hardware, software, and personnel elements) meets performance requirements and supports the plant’s safe operation. HEDs (Human Error Discrepancies) are identified if performance criteria are not met. Baseline comparisons are often used, with the requirement that the new control room must function at least as well as the old control room.
NUREG-0711 further describes that ISV employs a hierarchical set of performance measures including measures of plant performance, personnel task performance, situation awareness, cognitive workload, and anthropometric/physiological factors. Errors of omission and commission also are identified. The hierarchal set of measures provides sufficient information to validate the integrated system design and affords a basis to evaluate deficiencies in performance and thereby identify needed improvements. Pass/fail measures are those used to determine whether the design is considered to have successfully passed the validation or not. Diagnostic measures are used to better understand personnel performance and to facilitate the analyses of errors and HEDs.
Changes conducted during for example the upgrade of a CKR of a nuclear power plant (NPP) warrants an ISV process to be conducted. Most commonly these are technical system changes, e.g. modernization of a CKR, which results in an ISV process, but potentially changes triggering an ISV process may be of other natures, e.g. organizational changes. Halbert, Park, Boring, and Jung (2016) describes a long range of common human performance issues identified in scientific and operational literature regarding the development of digital control rooms that could be triggered or be detected during an ISV. They summarize their findings in a list of fifteen categories:
Change in the role/function of human operators
Cognitive workload
Confirmation/trust on a digital system
Crew performance
Dealing with different information available across different sources
Decrease of the range of vision (visual momentum)
Digital environment
11
HMI complexity
Novel human error in a digital system
Opacity in a digital system
Physical workload
Recovery of human error in a digital system
Situation assessment
Training
To identify issues such as the ones listed above, the NPP-community often used methods labelled Human Reliability Analysis (HRA) which are briefly described in the next Section.
12
5. Modelling constructs from Human
Reli-ability Analysis (HRA)
The phenomena or concepts of interest to human factors researchers are often not directly measurable. In statistics, these abstract phenomena have been called latent variables, factors or constructs. Examples of latent variables in psychology are, e.g. different types of intelligence or motivation. The same measurement problem is true for many of the constructs relevant during an ISV. The label construct or latent variable is used from here on in the report.
A clear example and analogy of a latent variable from the physical sciences is provided by Wilson et al. (2004). The temperature can be measured with several different scales such as the Kelvin (K), Réaumur (R), Fahrenheit (F), and Celsius (C) scales. However, the manifest and measurable variation in the scales is a consequence of the amount of excitation of nuclear particles, and it is not the movement of the particles that is observed directly. Thus, temperature can be considered as the hypothetical phenomenon affecting and explaining the variation in the scales, and is thus considered a latent variable which finds manifest expression on the different temperature scales, as illustrated in Figure 1.
Figure 1. The latent construct Temperature and some manifest measures.
A critical question in any SEM effort is of course which latent variables that should be included in the modeling. Which and how many latent variables that are important for the modelling effort naturally depends of the purpose of the model. For application of SEM to an ISV-process, the authors consulted the scientific HRA-literature to identify latent variables that would be important to assess during an ISV in a nuclear power plant.
Human Reliability Analysis (HRA) should be a part of an ISV, and several methods exist, see e.g. Bell and Holroyd (2009) for a concise review. Gertman, Blackman, Marble, Byers, Haney, and Smith (2005) describe six HRA methods common in the nuclear domain: THERP HEART CREAM ASEP SHARP SPAR-H
These six methods and several other methods found in the HRA literature use the concept of Performance Shaping Functions (PSFs) to describe constructs that are important to consider when assessing the performance of human operators. The
13
differences, pros and cons of these different HRA methods are beyond the scope of the present report, but NUREG/IA-0216 (IAR, 2009) describe twelveHRA methods and compare experiences of their application on a set of common scenarios.
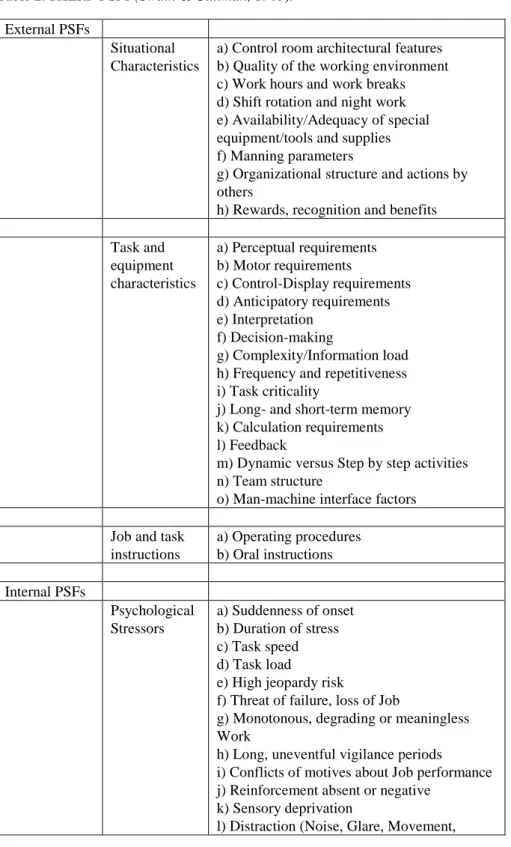
Groth (2009) lists 53 PSF’s often used in THERP HRA (i.e. originally from Swain & Guttman, 1983) analyses. Based on these, Groth (2009) has refined and rearranged the 53 PSFs into a 9-bubble model (Figure 2) while Groth and Mosleh (2010a, 2010b) describes a 6-bubble model (Figure 3) to provide a tiered classification of PSFs, as different levels of resolution are suitable for different purposes. Further detailed description of these PSF taxonomies are provided in Appendix B.
14
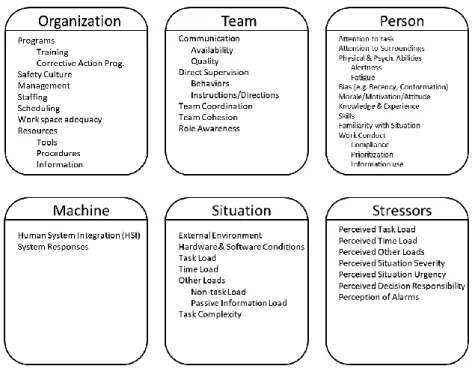
Figure 3. 6-bubble model from Groth and Mosleh (2010a).
Gertman, Blackman, Marble, Byers, Haney, and Smith (2005) and Blackman, Gertman, and Boring (2008) describe the Standardized Plant Analysis of Risk-Human Reliability (SPAR-H) method. SPAR-H uses a number of PSFs derived from the THERP method, while SPAR-H is designed to be a less resource demanding method than THERP. SPAR-H suggests a set of nine PSFs which are presented in Figure 4. The SPAR-H PSFs all have their individual scales described in Blackman et al. (2008). The path diagram in Figure 4 shows the predicted relationships between the PSFs in the model of Blackman et al., where solid lines indicate high degree of relationship and dashed lines indicate medium degree of relationship.
15
Boring (2010) provides a crosswalk, see Table 1, of PSFs used in four HRA methods which have explicit PSF models:
● HRA good practices guide (Kolaczkowski, Forester, Lois, & Cooper, 2005) ● SPAR-H (Gertman, Blackman, Marble, Byers, Haney, & Smith, 2005) ● CREAM (Hollnagel, 2005)
● 9-bubble PSF model (Groth, 2009) Table 1. Crosswalk of PSFs by Boring (2010).
Good practices (Kolaczkowski et al., 2005) SPAR-H (Gertman et al., 2005) CREAM (Hollnagel, 2005) 9-bubble model (Groth, 2009) Training and Experience
Experience/Training Adequacy of Training and Preparation Training Knowledge Procedures and Administrative Controls Procedures Availability of Procedures/Plans Resources
Instrumentation Ergonomics/HMI Adequacy of HMI and Operational Support
Machine
Time Available Available Time Available Time Loads/Perceptions Complexity Workload/Time Pressure/Stress Complexity Stress/Stressors Number of Simultaneous Goals Complexity Loads/Perceptions
Team/Crew Dynamics Work Processes Crew Collaboration Quality
Team
Available Staffing Work Processes Adequacy of Organization
Resources
Human-System Interface
Ergonomics/HMI Adequacy of HMI and Operational Support
Machine
Environment Stress/Stressors Working Conditions Complexity Accessibility/Operabil
ity of Equipment
Ergonomics/HMI Adequacy of HMI and Operational Support
Machine
Need for Special Tools Ergonomics/HMI Adequacy of HMI and Operational Support
Resources
Communication Work Processes Crew Collaboration Quality
Team
Special (Equipment) Fitness Needs
Ergonomics/HMI Adequacy of HMI and Operational Support Resources Considerations of ‘Realistic’ Accident Sequence Diversions and Deviations -- -- --
-- Fitness for Duty Time of day -- -- Work Processes Adequacy of
Organization
Organizational Culture
16
NUREG-0711 (NRC, 2012a), in the section on performance measurement, recommends evaluation of the following performance related factors as a part of ISV processes:
● Plant performance
● Personnel task performance ● Situation awareness ● Cognitive workload
● Anthropometric/physiological factors
During recent and current ISVs conducted at Swedish NPPs, a data collection setup developed by the Institute for Energy Technology (IFE, Nw. Institutt for Energiteknikk) has been used. The measurement model used in Appendix C is inspired by the measurement setup used in the OKG O2 ISV (Braarud, Eitrheim, & Svengren, 2015), which were developed by IFE, based on NUREG-0711 (NRC, 2012a) and earlier ISV experiences, where the following constructs is assessed:
● Task performance ● Situation Awareness ● Workload
● Teamwork ● Usability
As hopefully evident from the above descriptions of PSFs in different HRA methods, it would be very useful from both operational and scientific perspectives to quantify the relations between identified PSFs. SEM provides a method for quantifying these relations and to present the results in a graphical form.
17
6. Structural Equation Modelling (SEM)
6.1. Background to SEM
To advance scientific theories and compare results from different studies, many researchers in different fields have had the need of statistical methods that enable them to quantify the relations between different types of not directly observable constructs or latent variables. The researchers often need to: a) to be able to estimate latent variables of interest through multiple directly measurable and manifest variables to get better measurement, b) to be able to accommodate for measurement error, and c) to be able to statistically compare alternative models.
For many human factors related studies it is also a fact that experimental design, data collection and analysis of human work, at least from realistic settings, are resource demanding activities. Different methodological approaches and measurement setups in different studies also make it hard to integrate experimental results from different studies with each other.
SEM is a quantitative statistical method that was developed to manage these types of methodological needs. SEM combines the benefits of path analysis, factor analysis, and multiple regression analysis (Jöreskog & Sörbom, 1984, 1993; Tabachnick & Fidell, 1996). SEM is based on correlational statistics, i.e. the linear relationships between variables, and the common variance between the variables forms the basis for the analyses. SEM identifies the degree of relationship between variables in terms of explained variance. One or more hypothesized models are tested statistically in a simultaneous analysis of the entire system of variables, to determine the extent to which the covariance or correlation matrix stipulated by the model, is consistent with the matrix based on the empirical data. If the statistical goodness of fit between the two compared matrices is adequate, the model developer can argue that the model is a plausible representation of the relations between variables that the model developer has specified.
Due to these methodological possibilities, SEM has been used for many years and is a popular methodology for non-experimental research, where methods for testing theories are not well developed, and ethical or practical considerations make traditional experimental designs unfeasible. Diamantopoulos and Siguaw (2000) provide an excellent introduction to the SEM process and recent introductory reviews to SEM can be found in Byrne (2016) and Blunch (2013).
While most other multivariate procedures essentially are descriptive by nature (e.g. exploratory factor analysis), SEM takes a confirmatory (i.e. hypothesis-testing) approach to data analysis, even though exploratory research questions can be addressed. Whereas traditional multivariate procedures are incapable of assessing measurement errors, SEM provides explicit estimates of these parameters.
Hoyle (1995) describes three main differences between SEM and other approaches. First, SEM requires formal specification of a model to be estimated and tested. It forces the model developer to think carefully about their data and to formulate hypotheses regarding each variable. Second, SEM has the capacity to estimate and
18
test relationships between latent variables. Third, SEM is a more comprehensive and flexible approach to research design and data analysis than any other single statistical model in standard use by social and behavioural scientists. Hoyle also describes SEM as similar to correlation analysis and multiple regression analysis in four specific ways. First, SEM is based on linear statistical models. Second, there are similar requirements, such as independence of observations and multivariate normality. Third, SEM promises no test of causality - it merely tests relations among different variables. Finally, like any other quantitative analysis, post-hoc adjustments to a SEM model require cross-validations.
Causality is a natural and important aspect of modelling, and in a model of explanatory power you can predict the effects of some factors on others. Even if SEM-analyses do not promise a test of causality, the fit or explanatory power of a SEM-model gives support for a causal model. That some manifest measures or variables are measured before others in time can be used to strengthen conclusions of causality in SEM-analyses. Background-variables, measures of information complexity, mental workload and situation awareness are often registered before different aspects of performance. And, most important, good scientific judgement and experience of the domain must be applied (in Swedish called ‘saklogik’ by the LISREL-developer K. G. Jöreskog).
The development of a structural equation model is supported by special software packages. The first software package developed was LISREL (Jöreskog & Sörbom, 1984; 1993) which is an acronym for LInear Structural RELations (Sw. Linjära Strukturella Relationer). LISREL was originally developed by the two Swedish professors Karl Gustaf Jöreskog and Dag Sörbom, and one of the earliest references to LISREL methodology is Jöreskog (1973). Since then, SEM-methodology and software has been developed by many researchers and companies. AMOS (SPSS, 2016) and EQS (MVSOFT, 2016) are probably the most widely spread, apart from LISREL. The strongly evolving R community has also developed several SEM packages1.
6.2. Basic SEM concepts
A structural equation model has several components. One component that is present in all structural equation models is the measurement model, which defines the latent variables through manifest variables. Another important component is the structural model. The structural model tests relationships between several latent variables.
Measurement model
The measurement model is the part of a SEM model which defines relations between the latent variables or constructs and their manifest variables. The manifest variables are often the items/questions of a questionnaire, but can be any type of measured data. To provide a well-rounded measurement of the construct the manifest variables should be chosen or designed so that they assess different aspects of the construct, i.e. the manifest variables should not be too similar. A pure measurement model represents a confirmatory factor analysis (CFA) model in which there is undetermined covariance
1
R, the platform of open-source statistics packages contains packages named e.g. SEM, LAVA and LAVAAN. Bayesian SEM estimation is implemented in the blavaan package.
19
between each possible pair of latent variables. The pure measurement model is frequently used as the “null model”, where all covariances in the covariance matrix for the latent variables are all assumed to be zero, i.e. the constructs are totally unrelated to each other. For the proposed structural model, i.e. the part where relations between the constructs are hypothesized, to be investigated further, differences from the null model must be significant.
Structural model
The structural model describes how the researcher has defined the relationships between the latent variables. It consists of a set of latent variables in the model, together with the direct effects connecting them, and the error variance for these variables. Diamantopoulos and Siguaw (2000) state that models with five to six latent variables, each measured by three to four manifest variables can be considered an appropriate upper level of complexity. Many models found in the literature are not as complex and consist of two or three latent variables. Increases in model size typically results in increasing difficulty to meet the recommended thresholds for model fit.
Residual error terms
For the majority of variables that are of interest within the HOF field it is typically challenging to design measures that capture a phenomenon perfectly. Thus, error in measurement is assumed, and with SEM such are addressed by the inclusion of error terms for each variable. Residual error terms reflect the unexplained variance in latent variables.
6.3. Example model
To exemplify, a structural equation model from the military aviation domain Castor (2009) is shown in Figure 5, where ovals are latent variables forming the structural model, while squares are manifest variables forming the measurement model. Error residuals are not shown in this figure.
20
In Castor (2009) the data from 308 simulated fighter aircraft engagements with four pilots and 24 variables measured during each engagement were analysed and compiled into the statistical model shown in Figure 5. The database thus consisted of 1232 cases with 24 variables, generated by 37 pilots. The resulting model summarizes more than 700 hours of experienced pilots’ complex behaviour in an operationally valid environment.
The model describes the relations between 24 manifest variables in the measurement model, which are used to describe relations among the seven latent variables. The model demonstrates how changes in Sensor management (SENSOR), explains changes in Usability of Information (INFO), Mental workload (MWL), Situation Awareness (SA), Teamwork (TEAM), Offensive Performance (OFFPERF) and Defensive Performance (DEFPERF). In other words, if SENSOR is high, then INFO is high, and then MWL is low (which is desirable). If MWL is low then SA is high, which relates to high TEAM, which in turn is used to describe changes in OFFPERF and DEFPERF. Instead of showing a correlation matrix of the 24 manifest variables against each other, a SEM analysis was conducted resulting in the model in Figure 5 which is an adequate and more succinct way to show important relations between the variables of the database.
As demonstrated by Figure 5, SEM forces an analyst or researcher to be very explicit concerning the relations between all chosen latent and manifest variables, e.g. the omission of an arrow in the model is a quite strong theoretical statement. For example, in Figure 5 there is no direct effect between SENSOR and OFFPERF/DEFPERF. These effects are instead mediated by the other latent variables. This implies that changes in SENSOR, e.g. through increased technical performance of an aircraft radar, are mediated by the pilot and the team, (INFO-TEAM) before there are effects in the tactical outcome (number of enemies shot down and the own team’s survival, i.e. the manifest variables of OFFPERF/DEFPERF). The estimates between the latent variables warrant them all as being useful as separate concepts and show that there is explanatory power between them. Too high estimates would imply that they are the same thing and too low estimates would show that concepts not really, at least not directly, are statistically related.
Experiences from SEM-modelling in the aviation domain, such as Castor (2009) and Nählinder, Berggren, and Svensson (2004), were used as starting point for the analysis reported in Appendix C. One resulting model from this modelling effort, based on the dummy data replicating an ISV is presented in Figure 6. This should thus be seen as an example of potential outcome of SEM modelling during an ISV, i.e. a model that can be analysed to further understand the work processes it was designed to assess. For further explanation of this model, see Appendix C.
21
Figure 6. Example model based on ISV dummy data.
6.4. SEM development process
The SEM development process is quite complicated, with many steps and requirements concerning e.g. the data distribution, model complexity versus amount of data, model fit indices, and so forth. This process and its requirements are further elaborated in Appendix A.
22
7. Discussion
For many studies of human behaviour in applied settings, SEM should not be seen as a replacement to more classical statistical analyses, e.g. variance analysis through ANOVA or presentation of descriptive data. Rather, SEM provides a powerful complementary analysis capability, which provides advanced understanding of the process where data was collected. For some studies and research questions, SEM can provide one of the few or the only statistical analysis method(s) that can be applied. Repeated testing and analysis of the manifest variables and their properties are the foundation for useful and valid SEM models. The finally proposed model from one data collection campaign, e.g. a model from one ISV process, can provide important understanding of how variables, in a data-driven view, relate to each other. If the same patterns are seen in other studies and a similar structural model repeatedly can be found, e.g. as reported by Nählinder, Berggren and Svensson (2004), the theoretical importance of the SEM model grows over time.
A recent empirical study using SEM-analyses concerns performance of a command and control centre of the Swedish Armed Forces. The study analysed models of mental workload, individual and team performance, and relates highly to performance and function of nuclear power plant central control rooms. Among other things of practical value, it was found that mental workload has a predictive power on individual and team performance up to 30 minutes ahead (Svensson, Rencrantz, Marklund, & Berggren, 2014).
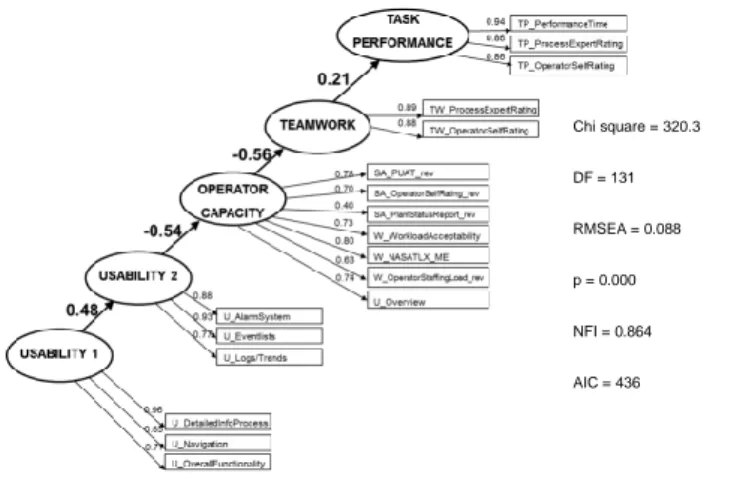
SEM typically supports the analyst in his or her understanding of selected manifest and latent variables. Examples of conclusions/findings from the analyses presented in Appendix C, i.e. analysis of Figure 7, are presented below to show example results. However, remember that the database was designed to demonstrate these findings.
Figure 7. Model based on dummy data before specification search.
Chi square = 320.3 DF = 131 RMSEA = 0.088 p = 0.000 NFI = 0.864 AIC = 436
23
Figure 8. Model based on dummy data after specification search.
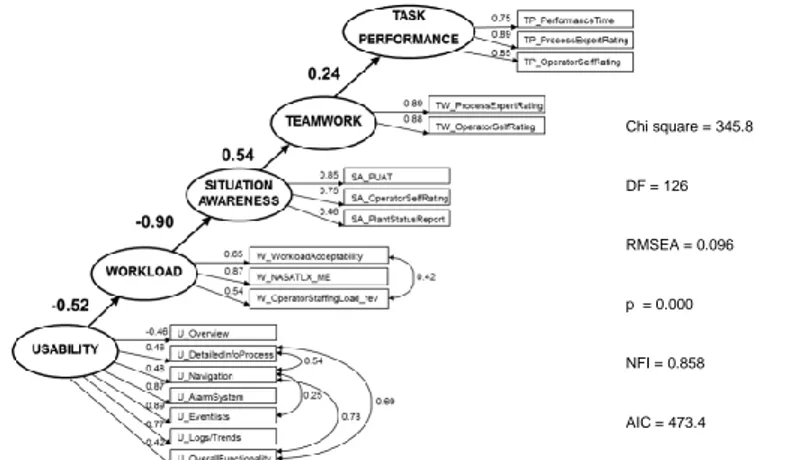
Figure 9. Model from dummy database, testing the original main hypothesis.
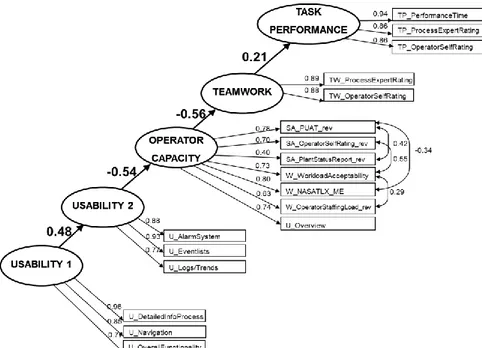
Some changes (or potential for changes) that the model development in Appendix C led to are summarized below:
Changes to the measurement model, e.g. the EFA showed that U_Overview manifest variable should load on the SA/Workload latent variable.
Changes to the structural model, e.g. the new construct of SA/Workload, called Operator. The original hypothesis for the analysis, see Section X, considered Situation Awareness and Workload to be two separate constructs, based on earlier research. However, in this analysis (based on dummy data), data suggested that the two constructs should be regarded as the same construct.
Management of items with low loadings. This was not shown in examples in Appendix C, but could be applied to e.g. SA_PlantStatusReport in the analysis of the dummy database. If the variable does not load strongly anywhere, the variable either measures something else, which not is covered by the selected latent variables, or has other measurement issues.
Management of variables with low variance and non-normal distributions. The modelling and the preparations for modelling put “an analytical
Chi square = 220.6 DF = 125 RMSEA = 0.064 p = 0.000 NFI = 0.909 AIC = 352.6 Chi square = 345.8 DF = 126 RMSEA = 0.096 p = 0.000 NFI = 0.858 AIC = 473.4
24
spotlight” on variables that have low variance or non-normal distributions. The usefulness of a variable with low variance must be discussed, but the potential decision to exclude it must be made on a case by case basis, depending on what the variable measures.
Manage co-variances between the manifest variables, as exemplified by comparing Figure 7 and Figure 8. The arrows between the error variables estimate the co-variance between manifest variables, and ca to some extent be tolerated as the manifest variables can be assumed to co-vary in this study. Through inclusion of these co-variances the model fit of the proposed model barely reached common acceptable criteria, c.f. recommendations on model fit indices in Appendix A.
Comparison of models, e.g. if the models in Figure 8 and Figure 9 are compared with regard to fit indices, the model in Figure 8 is at better model of the data than the model of Figure 9. Theoretical justification might lead a modeller to retain worse fitting models, but the goal is to find the model which both has theoretical justification, explanatory value and acceptable fit indices.
The AMOS software that was used in the reported analysis provides a number of additional analysis capabilities that not are described in the report. Further details of these capabilities are provided by Byrne (2016).
Bayesian SEM analyses, which is useful when the analysts, in general or for the specific analysis, cannot not accept the assumption that ordinal data, generated by Likert-type questions, e.g. rating on a 1-5 scale concerning some relevant aspect, can be treated as data with continuous scale properties data.
Multigroup analyses, which are useful when different groups of data samples need to be compared, e.g. do the SEM look different for data from different ISV’s or for different control room operator roles.
Bootstrapping, useful when analysing data with non-normal distributions. As stated above, SEM is a powerful statistical method, but there are several issues that must be understood and accepted by the reader to appreciate SEM.
Multidimensional constructs
The latent variables are often multidimensional and hard to exactly define, which is one of the reasons to analyse them through SEM. Some of the latent variables described in Appendix C have been debated in the scientific literature, (c.f. the discussion concerning the validity of the situation awareness construct). However, they all represent very useful constructs that instructors and designers use, and the terms are also used in the regulatory documents.
Depending on the reason for the ISV, it might be necessary to study other latent variables than the ones used in the example modelling of this report. The latent variables chosen for the OKG O2 ISV (Braruud et al., 2015) would often be important, but for a ISV triggered by procedural changes or training, some new latent and
25
manifest variables might need to be identified. The PSF taxonomies described in Section 5 and Appendix B provide a good guide to latent variables other researchers have found to be important. Boring’s (2010) crosswalk of PSF build on a large amount of research from different perspectives and could be used as a starting point.
Subjective ratings
Subjective ratings or answers to surveys, questionnaires and interview questions often provide very valuable data concerning psychological phenomena. However, they must be carefully designed and tested to ensure validity and reliability.
Sources of variance
For the modelling effort presented in this report several assumptions concerning the source of variance in the data have been made.
The number of domain experts, e.g. nuclear power plant operators, that practically can be assessed is generally too low for multivariate statistical analysis, even if the whole national population would be part of an evaluation, which, on the other hand, reduces the statistical problem of generalizability from sample to population.
Consider the case of the dummy database that was developed for the purposes of this report. The database was inspired by typical ISV data (c.f. Braruud et al., 2015) from control room operators, but to be statistically strict the data of the 189 cases (i.e. rows) in the database should be independent from the other cases. Given the available number of operators and the fact that the real work tasks largely are team tasks, this strict independence requirement will be practically unachievable. The database, from which the model in Appendix C was based, was generated by 21 operators distributed over seven team across nine scenarios. So, from a strict statistical point of view, the 189 cases do not represent independent measurements.
For assessments of operational performance in realistic domains, the variance that exists in the database can be assumed to be a result of interindividual (difference in rating patterns for each participant), intra-individual (difference in rating patterns between participants), and situational variance (changes in rating due to events in scenarios). If the assumption that the events in the scenarios contributes with more variance than the participants rating patterns can be accepted, and by combining inter- intra-, and situational variance sources in repeated measurement studies, databases and models of practical and theoretical importance can be developed, especially if similar structural models repeatedly can be demonstrated.
The differences between how variables vary across the different scenarios and operator types should be analysed before they are combined into one database. Castor (2009) provides some examples of how differences can be analysed to justify whether they can be combined into the same database (which briefly relate to comparing the correlation matrices between different subsets of the data, e.g. the three types of operators or scenarios). Byrne (2016) also demonstrates different ways to compare different datasets, e.g. through latent mean analysis.
Causality in the model
As stated earlier, SEM does not in itself provide clues concerning causality between variables. From a SEM perspective, the effect (e.g. the arrow from Usability to Workload) could just as well be in the other direction. Hypotheses about causality and
26
the direction of arrows representing regression weights in a model are typically based on earlier observations and understanding of the domain. More insights concerning defending the causal interpretation of structural equations can be found for example in Bollen and Pearl (2013), and Pearl (2009). It is also important to realise that the presence or absence of specific arrows in a model are rather strong statements. For example, if the is no direct arrow between two latent variables, the modeller explicitly states that there is no direct relation between these variables, and that any effect are mediated by other latent variables.
It also important to realize that SEM models are not process models, but models of how the relations between variables in the collected dataset can be described.
Properties of data
Proper application of SEM requires the data to display multi-variate normality. If severe deviations from non-normality are observed in the dataset the analysis is at risk, but there are also means to manage the non-normality, e.g. through the bootstrapping functions of AMOS (e.g. Byrne, 2016).
One of many models
The fact that SEM can be used to express relations between variables collected during an ISV is not surprising, given that SEM is a multivariate statistical method designed to describe relations between many variables.
Appendix C provides an example model, based on the dummy data set that was created by the authors. Any conclusions regarding the estimates between the latent variables in Figure 8 or Figure 9 must be avoided as it is based on dummy data, but the figures exemplify results that can be expected after a SEM modelling process. The potential to draw operationally relevant conclusions from a SEM model is based on the design of the measurement model. If the measurement model does not contain any criteria variables, e.g. measures of production or safety, the model can of course not be used to draw conclusion concerning this, however it may still be a very useful descriptive model of how included variables relate to each other.
SEM provides a powerful analysis tool that enables theories that are more specific than “everything is connected” as it quantifies relations and shows abstracted relations. It is also very important to realize that the essence of SEM is modelling, implying a simplification of reality.
Models, as almost anything else, can be described on different levels of abstraction, and to exemplify, Figure 10 show three models of a snowflake on different levels of abstraction. All three of the models in the figure, to different degrees, capture essential properties of a snowflake, even though every real snowflake is said to be unique. There are patterns which clearly identify a snowflake and these patterns are found in every snowflake, i.e. it is possible to design models of what snowflakes look like.
27
Figure 10. Three models of a snowflake, described on three levels of
abstraction.
Expanding on the visual analogy shown in Figure 10, and considering the ISV process and the need to model work process in a central control room, with all technical systems, operators capabilities and processes, Figure 11 is another visual analogy of the challenges of statistical modelling, i.e. what resolution is needed in order to recognize the important characteristics of the process.
Figure 11. Visual analogy of the challenge of selecting the appropriate level of
resolution in a model.
Useful models capture the essential properties of a system or process and facilitate insights of their nature. Thereby models can be used as predictive tools, providing a foundation for important decisions. Regardless of simplicity, the model still needs to contain the essential information to be useful. As conceptualized in Figure 10 and Figure 11, the search for the “one and only” model or level of representation is a dead end, and the abstraction level of choice instead depends upon the purpose of the model. A model can, as shown, be described on different levels of abstraction, and any model will face challenges regardless of level of abstraction. The model can be challenged because it fails to provide an idealization about the structure of the system, which approximates the actual behaviour of the system good enough, or that it buries the important processes in a mass of “irrelevant” detail.
For a modeller, it is a trade-off between maximizing explanatory power without oversimplifying. It is the modeller who defines the frame of the model and chooses which variables to include, based on experience, previous scientific findings, theory, and model purpose.
28
8. References
Bell, J., & Holroyd, J. (2009). Review of human reliability assessment methods. HSE RR679. Buxton, Health and Safety Laboratory.
Bollen, K.A., & Pearl, J. (2013). Eight Myths About Causality and Structural Equation Models. In S.L. Morgan (Ed.), Handbook of Causal Analysis for Social Research, Chapter 15, 301-328, Springer. Available at: http://ftp.cs.ucla.edu/pub/stat_ser/r393-reprint.pdf
Boring, R. (2010). How Many Performance Shaping Factors are Necessary for Human Reliability Analysis. Proceedings of 10th International Conference on Probabilistic Safety Assessment and Management PSAM 2010.
Boring, R., & Lau, N. (2017). Measurement Sufficiency Versus Completeness: Integrating Safety Cases into Verification and Validation in Nuclear Control Room Modernization. In S. Cetiner, P. Fechtelkotter, & M. Legatt, (Eds.) Proceedings of AHFE 2016 - Advances in Human Factors in Energy: Oil, Gas, Nuclear and Electric Power Industries, pp.79-90.
Blunch, N.J. (2013). Introduction to Structural Equation Modelling using IBM SPSS Statistics and AMOS. Los Angeles, CA: SAGE.
Braarud, P.Ø., & Berntsson, O. (2016). Assessment of Situation Understanding Mission, Control and Teamwork in the Control Room: The Development and Initial Testing of the SCORE Measure. EHPG MTO-6.7 HWR-1125. Proceedings of EHPG 2016.
Braarud, P.Ø., Eitrheim, M., & Svengren, H. (2015). Results from the Integrated System Validation of the Modernized OKG Oskarshamn 2 Control Room. IFE/HRF/F-20/1632. Halden, Institute for Energy Technology.
Byrne, B. (2016). Structural Equation Modeling with AMOS 3rd Edition. New York,
NY; Routledge.
Collier, S., & Follesø, K. (1995). SACRI: A measure of situation awareness for nuclear power plant control rooms", Proceedings of an International Conference: Experimental Analysis and Measurement of Situation Awareness, pp. 115-122, 1995-November-1-3.
Diamantopoulos, A., & Siguaw, J. (2000). Introducing LISREL. London, Sage Publications.
Garson, G. D. (2015). Structural Equation Modeling. Asheboro, NC: Statistical Associates Publishers.
Gertman, D., Blackman, H., Marble, J., Byers, J., & Smith, C. (2005). The SPAR-H Human Reliability Analysis method. NUREG/CR-6883. Washington, DC: United States Nuclear Regulatory Commission.
29
Groth, K.M. (2009). A Data-Informed Model of Performance Shaping Factors for use in Human Reliability Analysis. PhD thesis. College Park, MD: University of Maryland. Available at: http://drum.lib.umd.edu/bitstream/handle/ 1903/9975/ Groth_umd_0117E_10944.pdf;sequence=1
Groth, K.M., & Mosleh, A. (2010a). A data-informed model of performance shaping factors and their interdependencies for use in human reliability analysis. In Briš, Guedes Soares & Martorell (Eds.) Reliability, Risk and Safety: Theory and Applications. London, Taylor & Francis Group. Available at: http://www.sandia.gov/~kgroth/publicationfiles/Groth_ESREL2009.pdf
Groth, K.M., & Mosleh, A. (2010b). A Performance Shaping Factors Causal Model for Nuclear Power Plant Human Reliability Analysis. Proceedings of 10th International Conference on Probabilistic Safety Assessment and Management PSAM 2010.
Halbert, B., Park, J., Boring, R, & Jung, W. (2016). Methods and measures for characterizing nuclear power plant operator performance to support control room modernization. Proceedings of 13th International Conference on Probabilistic Safety Assessment and Management PSAM 2016.
Hart, S.G., & Staveland, L. (1988). Development of the NASA task load index (TLX): Results of empirical and theoretical research. In P.A. Hancock and N. Meshkati (Eds.), Human Mental Workload, pp 139-183. Amsterdam, Elsevier.
Hollnagel, E. (1998). Cognitive reliability and error analysis method. Oxford, Elsevier.
IAR (2009). International HRA Empirical Study – Phase 1 Report. NUREG/IA-0216 Vol 1.
Jöreskog, K.G., & Sörbom, D. (1984). Analysis of linear structural relationships by maximum likelyhood, instrumental variables, and least squares methods. Uppsala, University of Uppsala.
Jöreskog, K.G., & Sörbom, D. (1993). LISREL 8: Structural Equation Modeling with the SIMPLIS Command Language. Chicago, IL: Scientific Software International. Kline, R. B. (2011). Principles and practice of structural equation modeling. New York, NY: Guilford.
Kolaczkowski, A., Forester, J., Lois, E., & Cooper, S. (2005). Good practices for implementing human reliability analysis. NUREG-1792. Washington, DC; US Nuclear Regulatory Commission.
NRC (2012a). Human Factors Engineering Program Review Model. NUREG-0711, Rev. 3. Washington, DC: US Nuclear Regulatory Commission. Available at: http://www.nrc.gov/docs/ML1232/ML12324A013.pdf
30
NRC (2012b). The International HRA Empirical Study - Lessons Learned from Comparing HRA Methods Predictions to HAMMLAB Simulator Data. NUREG-2127. Washington, DC: US Nuclear Regulatory Commission.
Nählinder, S., Berggren, P., & Svensson, E. (2004). Re-occurring LISREL patterns describing mental workload, situation awareness and performance. Proceedings of the HFES 48th Annual meeting. New Orleans, LA: Human Factors and Ergonomics Society.
Pearl, J. (2009). Causality – Models, reasoning, inference 2nd Ed. Cambridge,
Cambridge University Press.
Rollenhagen, C., Bladh, K., Borg, A. & Evénius, P. (1998). Handbok – Validering av kontrollrumsändringar.
Simonsen, E. (2016a). Measures and method characteristics for early evaluation of safe operation in nuclear power plant control room systems. Licentiate thesis no 99-2016. Göteborg, Chalmers University of Technology. Available at: http://publications.lib.chalmers.se/records/fulltext/232267/232267.pdf
Simonsen, E. (2016b). Measures and method characteristics for early evaluation of safe operation in nuclear power plant control room systems. SSM report 2016:31. Stockholm, Swedish Radiation Safety Authority. Available at: http://www.stralsakerhetsmyndigheten.se/Global/Publikationer/Rapport/Sakerhet-vid-karnkraftverken/2016/SSM-Rapport-2016-31.pdf
Strand, S., & Svengren, H. (in progress). The Process Understanding Assessment Technique (PUAT). HWR-907. Halden, OECD Halden Reactor Project.
Swain, A.D., & Guttman, H.E. (1983). Handbook of Human Reliability Analysis with Emphasis on Nuclear Power Plant Applications. NUREG/CR- 1278. Albuquerque, NM: Sandia National Laboratories.
Svensson, E., & Nählinder, S. (2014). Dynamic measures of effectiveness in command and control. In P. Berggren, S. Nählinder & E. Svensson (Eds.), Assessing Command and Control Effectiveness: Dealing with a changing world, pp 49-70. Farnham: Ashgate Publishing Limited.
Svensson, E., Rencrantz, C., Marklund, J., & Berggren, P. (2014). Empirical studies of command and control centres at the Swedish Airforce. In P. Berggren, S. Nählinder & E. Svensson (Eds.), Assessing Command and Control Effectiveness: Dealing with a changing world, pp 103-125. Farnham: Ashgate Publishing Limited.
Wilson, G.F., Frazer, W., Beamont, M., Grandt, M., Gundel, A., Varoneckas, G., Veltman, H., Svensson, E., Burov, A., Hockey, B., Edgar, G., Stone, H., Balkin, T., Gilliland, K., Schlegel, R.E. & van Orden, K. (2004). Operator Functional State Assessment (RTO-TR-HFM-104). Paris: NATO Research and Technology Organisation. Available at: handle.dtic.mil/100.2/ADA422195
31
Wolf, E. J., Harrington, K. M., Clark, S. L., & Miller, M. W. (2013). Sample size requirements for structural equation models an evaluation of power, bias, and solution propriety. Educational and Psychological Measurement, 73(6), 913-934.