GO
Beyond
GDP
Introducing Gross Output as a Top-Line
in National Income Accounting
P O L I C Y B R I E F F R O M S W E D I S H E N T R E P R E N E U R S H I P F O R U M© Entreprenörskapsforum, 2017
PS
frånE
ntrEPrEnörSkaPSforumEn viktig uppgift för Entreprenörskapsforum är att finna nya vägar att nå ut och sprida de resultat som forskningen genererar. Denna skrift är ett
resultat av detta arbete.
I en ambition att popularisera och tillgängliggöra delar av den forskning som sker vid universitet och högskolor i Sverige och internationellt tar vi fram
policysammanfattningar under rubriken, PS från Entreprenörskapsforum. Vill du snabbt och enkelt ta del av slutsatser och policyrekommendationer? Läs då Entreprenörskapsforums policysammanfattningar, PS från
Entreprenörskaps-forum, som på några minuter sätter dig in i flera års forskningserfarenheter.
om EntrEPrEnörSkaPSforum
Entreprenörskapsforum är en oberoende stiftelse och den ledande nätverksorganisationen för att initiera och kommunicera policyrelevant
forskning om entreprenörskap, innovationer, näringslivsdynamik och tillväxt. Stiftelsens verksamhet finansieras med såväl offentliga
medel som av privata forskningsstiftelser, näringslivs- och andra intresseorganisationer, företag och enskilda filantroper. Författarna svarar själva för problemformulering, val av analysmodell och slutsatser i
IntroduktIon av groSS outPut (go)
Mark Skousen är en amerikansk ekonom vars karriär spänner över flera årtionden. Han har bl a jobbat åt CIA som ekonomisk analytiker, skrivit för Wall Street Journal och Forbes samt skrivit en rad böcker och artiklar. Som ekonom har Mark Skousen varit en stark förespråkare av att introducera gross output (GO) som ett komplement till bruttonationalprodukten (BNP). I april 2014 började den amerikanska Bureau of Economic Analysis (BEA) redovisa GO, mycket tack vare Skousen. Det var det första makroekonomiskamåttet som började släppas kvartalsvis sedan bruttonationalprodukten (BNP) introducerades under 1940-talet. BEA har även ändrat sin definition av BNP och definierar den nu i form av GO minus intermediär produktion. GO är ett bredare mått av den ekonomiska aktiviteten i ett land och är nästan dubbelt så stort som BNP. GO mäter den totala försäljningsvolymen i produktionen av varor och tjänster i hela försörjningskedjan. GO ska främst ses som ett komplement till BNP, måtten kan tillsammans spela en viktig roll i den nationella bokföringsstatistiken. De båda måtten tillsammans ger förutsättningar för mer välgrundade ekonomiska beslut och kan ge en bättre förståelse för såväl konjunkturella och strukturella mönster i ekonomin. GO visar bla att företagsutgifter/investeringar är en betydligt större del av ekonomin än privat konsumtion samt att företagsutgifter tenderar att vara mer volatila än BNP. GO förskjuter därmed fokus från efterfrågesidan till utbudssidan i ekonomin, vilket många gånger kan ha betydande ekonomisk-politiska implikationer. Som Mark Skousen formulerar det: ”GO attempts to measure the production process or the ”make” economy while GDP is measured of final good and services, or the ”use” economy.” GO är dessutom en ”lead indicator” på BNP och kan ligga till grund för bättre konjunkturprognoser. Av allt att döma är GO är på väg att bli ett viktigt makroekonomiskt verktyg, som genom att släppas kvartalsvis tillsammans med BNP, kan ge en mer komplett bild av ekonomin. Både GO och BNP är lika viktiga för att mäta ekonomin, Sverige kanske bör överväga att införa GO som komplement till BNP?
Trevlig läsning!
Johan Eklund, vd Entreprenörskapsforum och professor Industriell Ekonomi vid Blekinge Tekniska Högskola
GO Beyond GDP
– Introducing Gross Output as a Top-Line in
National Income Accounting
Mark Skousen
In April 2014, the Bureau of Economic Analysis, (BEA), began publishing a new measure of the aggregate economy called gross output (GO), the first macro measure to be released on a quarterly basis since gross domestic product (GDP) was invented in the 1940s. GO is a broader measure of economic activity, adding up sales and revenues at all stages of production, and serves as a complement to GDP. The BEA now defines GDP in terms of GO minus intermediate production. GO attempts to measure the production process or the “make” economy while GDP is a measure of final goods and services, or the “use” economy. I make the case that GO and GDP together should play a vital role in national accounting statistics, much like top line and bottom line accounting are employed in compiling the quarterly earnings reports of publicly-traded companies. Gross output by industry offers insights into the direction and structure of the US economy. It demonstrates that business spending is a significantly larger segment of the economy than consumer spending is; and business spending tends to be more volatile than GDP. Earlier-stage and intermediate inputs in GO may also be helpful in forecasting the direction of economic growth. In this paper, I argue that gross output should be the starting point of national income accounting. GO is also more highly correlated with leading macroeconomic indicators of the business cycle than GDP is and is, additionally, more intellectually consistent with the economy-wide growth at all stages of production and distribution that growth theory attempts to model.
“Gross output [GO] is the natural measure of the production sector, while net output [GDP] is appropriate as a measure of welfare. Both are required in a complete system of accounts.” -- Dale Jorgenson, William Nordhaus, and Steven Landefeld (Jorgenson et al. 2006: 5).
On April 25, 2014, the Bureau of Economic Analysis released its first new national aggregate statistic on a quarterly basis since gross domestic product (GDP) was developed in the 1940s. Gross output, a measure of total sales volume in the production of goods and services throughout the supply chain, is almost twice the size of GDP, the standard yardstick for measuring final goods and services produced in a year (Skousen 2014b).
GO is a measure of the “make” economy, while GDP represents the “use” economy. Both are essential to understanding how the economy works.
In explaining this new statistic, I find it useful to identify GO as the “top line” of national income accounting and GDP as the “bottom line.” In quarterly financial statements, the top line measures revenues/sales while the bottom line accounts for earnings/net income. Both the top and bottom lines are essential to understanding what is going on in a business.
We can now apply a similar approach to national income accounting. GO is the top line, accounting for all the revenues/sales along the supply chain and the production process, while GDP is the bottom line that measures the value of all final or finished goods and services. As John Hicks described this relationship, “It is the typical business man’s viewpoint, nowadays the accountant’s viewpoint, in the old days the merchant’s viewpoint” (Hicks 1973:12).
However, it is important to note that GDP is not the same as the bottom line (earnings, net income) in corporate financial statements. GDP measures final output, or value added by the factors of production. In national income accounting, value added is gross sales minus the cost of goods, and therefore includes wages, salaries, rents, interest, taxes and profit. Thus, GDP can be compared to “gross profit” rather than “net income” in a corporate financial statement.
I. o
rIgInS ofg
roSSo
utPutOn a theoretical level, GO evolved from the work of Irving Fisher’s “volume of trade” in his equation of exchange (Fisher 1922, chapter 2) and Friedrich Hayek’s “triangles” measuring the stages of production (Hayek 1935: 53-57). GO can be viewed as a measure of Fisher’s volume of trade as well as Hayek’s triangle in the annual production of new goods and services. However, neither Fisher nor Hayek attempted to measure GO.
In Simon Kuznets’ original work in the early 1930s, he began national income accounting with “total output,” and settled on measuring only the “economy’s end product” as the “national income.” He subtracted intermediate production (“expended stock of goods”) from gross output to arrive at “net product” (Kuznets 1934: 1).
Kuznets went on to estimate “gross national product” on an annual basis, which became the “single most important benchmark measure of how an economy is doing” (Coyle 2014:42). Meanwhile, GO was left unmeasured until input-output, I-O tables, were developed by Wassily Leontief (1966:10-11). GO data was gathered every five years in the I-O tables. However, his focus was the inner-relationship between industries rather than the aggregate figure itself. BEA began publishing GO and GO by Industry on a yearly basis in the 1990s, but it was largely ignored by economists and the media because it was always three or four years out of date. In my work The Structure of Production (1990: 184-192), I made the case that GO is an essential macroeconomic tool that should be published on a quarterly basis along with GDP to give us a more complete picture of the economy. The BEA now releases quarterly GO from 2005 to the present, and recently published annual GO data going back to 1947. More importantly, GO is released as quickly as GDP. See www.bea.gov.1
Since the BEA began publishing a quarterly GO, many textbook writers have added GO to their next editions, including McConnell Brue Flynn, Roger LeRoy Miller, David Colander, John B. Taylor, and Glenn Hubbard.
Economists who have written favorably on the new quarterly statistic include Steve Hanke (2014), David Ranson (2015), and David Colander, who writes, “For forecasting, the new measure [Gross Output] may be more helpful than the GDP measure, because it provides information of goods in process” (2014:451).
1. http://www.bea.gov/iTable/iTable.cfm?ReqID=51&step=1#reqid=51&step=51&i suri=1&5101=1&5114=q& 5113=22r&5112=1&5111=2005&5102=15
Other G20 countries are considering producing their own GO measurement. The UK has recently begun releasing an annual figure called Total Domestic Output, with data starting in 1997, but latest data ends in 2014: www.ons.gov.uk.2
In this paper, I argue that gross output is (1) a broader measure of economic activity that more fully accounts for business spending in the economy, (2) a figure more sensitive to the business cycle, (3) a statistic more consistent with economic growth theory and one that resolves the “consumer spending paradox,” and (4) a potential forecaster of the economy. Both GO and GDP should be treated as equally important in measuring the economy, just as the top line and bottom line constitute a complete picture of a company’s financial condition. Adding GO and GO by industry to national income accounting has created a “new architecture” of macroeconomic data. (Jorgenson et al. 2006).
II. d
EfInIngg
roSSo
utPutGO attempts to measure total sales from the production of raw materials through the supply chain to the final retail sector. The BEA defines gross output by industry as “a measure of an industry’s sales or receipts, which can include sales to final users in the economy (GDP) or sales to other industries (intermediate inputs)”. It adds, “Gross output can also be measured as the sum of an industry’s value added and intermediate inputs”. According to the BEA, GO is “a highly useful statistic that is published as part of BEA’s industry economic accounts” (BEA 2014).
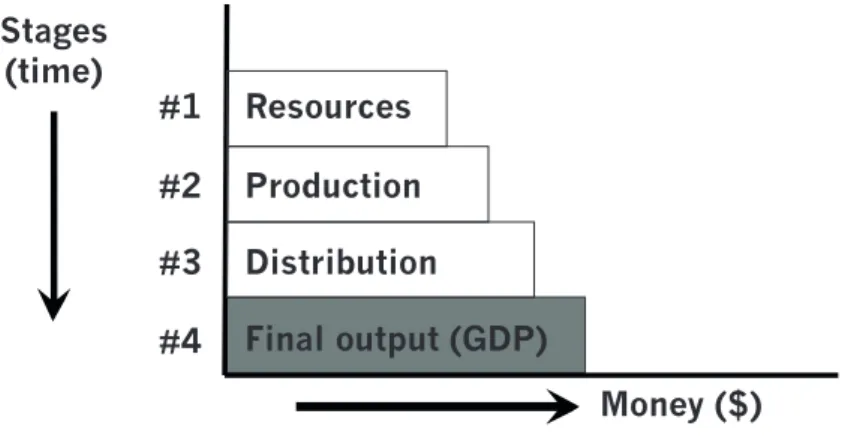
Figure 1 illustrates the relationship between GO and GDP. This macro model measures spending at each stage of production over time: Stage 1 measures the sales/revenues of resources extracted; stage 2, that of goods and services produced and manufactured; stage 3, that of goods and services distributed through wholesale and retail channels; and stage 4, the value of goods and services sold to end users. Value is added at each stage.
GO measures total economic activity by adding up all sales/revenues of firms at all four stages of production. GDP calculates the value of finished goods and services sold to consumers, businesses and government as final users (Stage 4).
2. http://www.ons.gov.uk/economy/nationalaccounts/supplyandusetables/datasetsinputoutputsupplyanduse tables
Figure 1 illustrates the relationship between GO and GDP. Just as every firm’s revenues/sales are essential for the company to earn a profit on the bottom line, so GO measures the total cost of the production process that generates the finished products and services to be used by consumers, businesses and government (GDP). FIGURE 1. Universal four-stage model of the economy
Source: Skousen 1990: 171, 291-292; 2015: xviii; 2014a: 58, 332.
III. BEa n
owd
EfInESgdP
Int
ErmSofgo
GO provides a more comprehensive measure of total spending by business, consumers and government by adding up sales/revenues at all stages of production. After the BEA began publishing GO on a quarterly basis, it changed the definition of GDP to be defined in terms of GO:
“Real gross domestic product [is defined as] the value of the goods and
services produced by the nation’s economy [GO] less the value of the goods and services used up in production [II], adjusted for price changes” (BEA 2016)
GO is defined as follows:
GO = II + GDP, where GO = gross output
II = the value of expenditures on intermediate inputs (supply chain) GDP = gross domestic expenditures
Stages
(time)
#1
#2
#3
#4
Resources
Production
Distribution
Final output (GDP)
Money ($)
Breaking down GDP into its components,
GDP = C + I + G + NX, where C = personal consumption expenditures
I = gross private domestic investment G = government consumption and investment NX = exports minus imports,
we have the following relationship:
GO = II + C + I + G + NX.
Using BEA data, GO was valued at $31.6 trillion in the 1st quarter 2016, while GDP amounted to $18.3 trillion. For quarterly data under “Gross Output by Industry,” go to: http://www.bea.gov.3
Using GO for the 1st quarter 2016, the BEA estimates the current breakdown of the US economy is as follows: II = $13,312.7 billion C = 12,498.1 I = 3,036.8 G = 3,254.3 NX = -507.4 GO = $31,594.3 billion
Iv. go
andgdP t
ImES
ErIES, 1947-
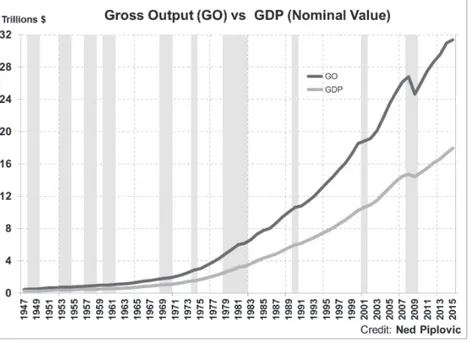
PrESEntOn April 21, 2016, the BEA expanded the annual series of GO back to 1947, presenting nearly 70 years of data (quarterly data is available after 2004). Figure 2 shows the relationship between the growth over time in GO and GDP. Gray bars on the chart in Figure 2 below indicate recession periods as defined by the National Bureau of Economic Research (NBER).
FIGURE 2. Nominal GO and GDP, 1947-2015. Source: Bureau of Economic Analysis.
Source: http://bea.gov/industry/gdpbyind_data.htm
v. w
hat’
Sm
ISSIng InBEa’
Sg
roSSo
utPutd
ata?
Business spending is, in fact, substantially larger than what the BEA reports. The BEA leaves out a considerable amount of sales/revenues in their definition of the value of intermediate inputs (II). The difference amounted to over $8 trillion in 2016. In both wholesale and retail trade figures (in stage 3 above in figure 1), the BEA’s GO only measures marginal output, that is, the difference between receipts and the cost of the goods sold. Thus, GO only includes value-added data for commodities after they become finished products, based on the rationale that there is no further physical transformation of these goods at subsequent wholesale/retail stages. The BEA explains: “For the I-O accounts, the output for industries that buy and resell merchandise but do not provide any additional fabrication is measured as margin. By I-O convention, this margin is measured as sales receipts less the cost of goods sold” (BEA 2009:5-4).
BEA justifies this marginal accounting at the wholesale and retail level in this way: “The use of this margin treatment enables the I-O accounts to focus on the commodity-producing sectors of the economy and on the use of these commodities by other industries and by final users. Otherwise, all or most of the commodities in the economy would appear to emanate from the distributive industries (trade and transportation)” (BEA 2009:5-4).
However, if we are seeking to measure total sales/revenues throughout the production and distribution process, the full value of wholesale and retail trade must be included as legitimate business transactions.
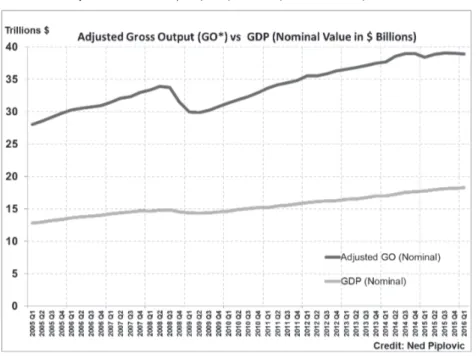
To include the full value of all wholesale/retail transactions, I define two more comprehensive statistics: “Adjusted GO” (GO*) and “Adjusted II” (II*) for intermediate inputs. Using this broader definition for the 1st quarter 2016, we show the following breakdown:
II* = $20,656.1 billion C = 12,498.1 I = 3,036.8 G = 3,254.3 NX = -507.4 GO* = $38,937.7 billion
Thus, adjusted GO (GO*) is 23 percent ($7,343.4 billion) higher than the official GO ($31,594.3 billion) and 113 percent ($20,656.1 billion) higher than GDP ($18,281.6 billion). In the 1st quarter 2016, adjusted GO amounted to $39.0 trillion, more than double GDP of $18.3 trillion. Adjusted GO is a much more complete measure of total economic activity.
FIGURE 3. Adjusted Gross Output (GO*) vs GDP (nominal value)
vI. go m
orES
EnSItIvEtothEB
uSInESSC
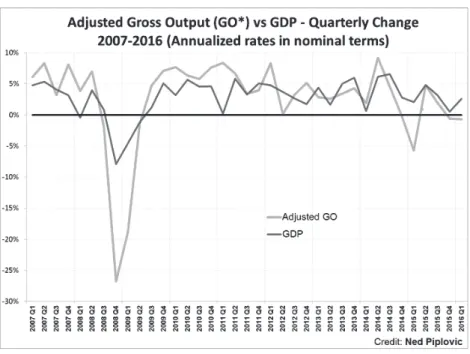
yClEGO is much more volatile than GDP and better reflects the ups and downs of the business cycle. For example, during the 2008-09 financial crisis, nominal GDP decreased only 3 percent, thus vastly underestimating the gravity of the Great Recession. At the same time, GO* fell 11 percent from its peak in the 2nd quarter 2008 to its trough in the 2nd quarter 2009.
During the recovery and expansion phrase, GO* tends to rise faster than GDP. For example, from the trough of the 2009 recession until the 1st quarter 2016, nominal GDP grew nearly 27.5 percent while nominal GO* advanced 30 percent. The results are similar in real terms. During the 2008-09 recession, real GDP fell 4 percent; while real GO* fell over 8 percent. In the recovery stage from 2009 until 2016, real GDP rose slightly more than 10 percent, and real GO* climbed over 18 percent.
Intermediate inputs, i e, business spending in the supply chain, made the difference. During the 2008-09 recession, nominal II* fell 17.3 percent, and then during the recovery from 2009 to 2016, nominal II* rose 32.7 percent. The early and intermediate stages of production are the most volatile sectors of the economy. The data indicates a systematic trend in the relationship between GO and GDP over the length of the business cycle. During the expansion phrase, GO tends to grow faster than GDP; during the contraction, GO declines more sharply than GDP; and during the recovery stage, GO tends to accelerate at a faster rate than GDP. See Figure 4.
FIGURE 4. Quarterly changes in adjusted GO (GO*) and GDP
In general, the relationship between GO and GDP indicates the direction of the business cycle. When GO slows down or declines faster than GDP, the economy faces recession. When GO increases at a faster pace than GDP, the economy is expanding or is in recovery. David Ranson, chief economist at HCWE, concludes, “GO tends to
portray the economy as more cyclical than real GDP does, the recession of 2008-09 as deeper, and the recovery as slower” (Ranson 2015).
vII. t
hEr
ElatIvEI
mPortanCEofC
onSumEr andB
uSInESSS
PEndIngGO also helps resolve the consumer-spending paradox. What drives the economy? You get two completely different views depending on whether you use GO data, or GDP.
FIGURE 5. GDP Model vs GO Model in 2016
Using the GDP model, we see that consumption is by far the biggest sector of the economy. With GDP at $18,282 billion in the 1st quarter 2016 and excluding Net Exports, consumption represents 66.5 percent of the economy, while government comes in second at 17.3 percent, and business (leaving out all intermediate expenditures) comes in third at 16.2 percent.
Government expenditures,
17.3% Government expenditures, 10.3%
This narrow focus of GDP on final goods and services has created much mischief in the media, government policy and boardroom decision-making. For example, using GDP as their key yardstick, journalists are constantly overemphasizing consumer spending as the driving force behind the economy, rather than business spending or investment.
Consider the follow quotations from recent business publications:
“Consumer spending is the lifeblood of the U. S. economy…” Barron’s, August 15, 2016, p. M1.
”Household spending generates more than two-thirds of total economic output, so sturdy [consumer] spending gains should translate into economic growth.” – “Spending Rises, Inflation Stays Low,” Wall Street Journal, September 30, 2014,p. A2. “Consumer spending makes up more than 70% of the economy, and it usually drives growth during economic recoveries.” -- “Consumers Give Boost to Economy,” New York Times, May 1, 2010, p. B1.
Or as the Wall Street Journal stated a few years ago, “Consumers are the engine of the U. S. economy, accounting for about 70% of economic demand…” -- “Consumers Stepped Up Spending in March,” Wall Street Journal, April 17, 2012, p. A7.
These examples from the media point demonstrate how it depends on GDP as a summary statistic for the economy. But while GDP is a reasonable estimate of national welfare and economic growth (Jones and Klenow 2016), it vastly underestimates the full contributions of business in the “make” economy, that is, the full value of business-to-business (B2B) transactions that move the supply chain along the intermediate stages of production toward the production of finished goods and services.
One of the major sources of this misconception is the way national income accounting is taught. With no reference to a “top line” of national accounting, the textbooks focus on GDP as the macro indicator of the economic performance. And thus, the media is easily led to the conclusion that consumer spending drives the economy.
The GO model expose these misconceptions. Using GO* as the top-line of national accounting and a more comprehensive measure of economic activity, spending by consumers turns out to represent around 30 percent of total yearly economic activity, not 70 percent as commonly reported. Let us see why.
How large is business spending? To determine its size, we return to the GO equation above:
GO = II + C + I + G + NX.
Rearranging, we combine II + I to measure total business expenditures (B2B) at all stages of production:
GO = (II + I) + C + G + NX.
Thus, II + I ($13,312.7 billion + $3,036.8) equals $16,349.5 billion in total business-to-business (B2B) transactions in the intermediate stages. This amounts to 51.7 percent of GO or 42 percent of adjusted GO (GO*).
Using the GO model, business spending (B2B transactions) is by far the biggest sector of the economy, representing over 50 percent of economic activity. This view is in keeping with the traditional view that entrepreneurship, technology, saving and investment, and capital formation form the foundation of economic growth. Accordingly, business activity drives the economy much more so than consumer spending or government stimulus. Using GO* as a fuller measure of economic activity, we can debunk the fiction that “consumer spending is two-thirds of the economy.” It is, in fact, only about one-third of the US economy, as measured by GO*, and business spending (B2B) is approximately 60 percent of all economic activity.
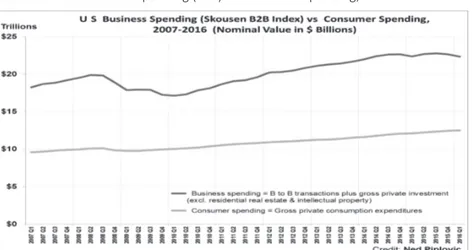
From the GO data, I have created the Skousen B2B Index, which measures all business spending throughout the production process. As you can see from the chart below, it is almost double the level of consumer spending in the United States and more volatile.
Using adjusted GO, consumption accounts for only 32.1 percent of US economic activity, while business spending and investment (B2B) represent almost 60 percent of the economy.
Thus, we conclude that gross business expenditures (sales/revenues) is about double what consumers spend on finished goods and services every year.
FIGURE 6. US Business Spending (B2B) vs Consumer Spending, 2007-2016
vIII. go, E
ConomICg
rowth,
andl
EadIngI
ndICatorS The GO model is more consistent with economic growth theory, employment statistics and the Conference Board’s index of leading economic indicators. According to Solow (1957) and Barro (1998), economic growth is more a function of technological advances, productive investment (including training and education in human capital), and entrepreneurship rather than retail sales. Consumer spending is largely the effect, not the cause, of prosperity (Hanke 2014).This view is more consistent with the Conference Board’s index of leading economic indicators as well as employment statistics. Among the leading economic indicators published monthly by the Conference Board, most are linked to the earlier stages of production and business activity: Average weekly hours, manufacturing; Average weekly initial claims for unemployment insurance; Manufacturers’ new orders, consumer goods and materials; ISM® Index of New Orders; Manufacturers’ new orders, nondefense capital goods excluding aircraft orders; Building permits, new private housing units; Stock prices, 500 common stocks; Leading Credit Index™; Interest rate spread, 10-year Treasury bonds less federal funds; and Average consumer expectations for business conditions. Note that the highly touted
“consumer confidence index” that is highlighted in the media has been changed to the “average consumer expectations for business conditions” (Conference Board 2016).
Employees in retail outlets and leisure businesses account for about 20 percent of the labor force in the United States; government workers about 15 percent; the vast majority (65 percent) work in mining, manufacturing, and business-oriented service industries (Bureau of Labor Statistics 2012).
Larry Kudlow explains the implications of the GO model as follows: “Though not one in a thousand recognizes it, it is business, not consumers, that is the heart of the economy. When businesses produce profitably, they create income-paying jobs and then consumers spend. Profitable firms also purchase new equipment because they need to modernize and update all their tools, structures and software” (Kudlow 2006).
IX: C
onCluSIonGross output is an important macroeconomic tool. The accounting profession has long recognized the value of measuring sales/revenues, the top line of a financial statement, and earnings/net income, the bottom line. Both are essential to a complete analysis of the inner workings of a firm.
Simon Kuznets and other pioneers in macroeconomics recognized in the 1930s the importance of measuring the “final net product” – the value of finished goods and services, what we call gross domestic product (GDP). But it turns out that this macroeconomic bottom line is not sufficient for a national accounting system. While GDP serves as a useful estimate of economic growth and a nation’s standard of living, it is not a complete measure of the economic activity and, as this paper demonstrates, has led to an unhealthy overemphasis of consumption as the key driver of economic performance. Introducing GO restores the primary importance of the business sector as the key catalyst to economic performance, and establishes a proper balance between the various sectors. Comparing GO with GDP can be helpful in determining the state of the economy, whether in recession or recovery. In short, GO is a significant advance in creating a more accurate picture of the economy and the ups and downs of the business cycle. The addition of GO in national income accounting fills in a major piece in the macroeconomic puzzle.
r
EfErEnCESBarro, R J (1998), Determinants of Economic Growth, MIT Press, Cambridge.
Bureau of Economic Analysis (2009), “Concepts and Methods of the U. S. Input- Output Accounts: Measuring the Nation’s Economy”, 2nd ed., U.S. Department of Commerce, Washington, DC.
Bureau of Economic Analysis (2014), New Quarterly Statistics Detail Industries’ Economic Performance, April 25, http://www.bea.gov/newsreleases/industry/gdpindustry/2014/ gdpind413.htm
Bureau of Economic Analysis (2016), National Income and Product Accounts Gross Domestic Product, First Quarter 2016 (Third Estimate), June 28, 2016 press release, http://www.bea.gov/newsreleases/national/gdp/2016/gdp1q16_3rd.htm
Bureau of Labor Statistics (2012), Employment by Major Industry Sector, http://www.bls. gov/emp/ep_table_201.htm
Colander, D (2014), “Gross Output.” Eastern Economic Journal, 40:451-455.
Conference Board (2016), The Conference Board Leading Economic Index, http://www. conference-board.org/data/bcicountry.cfm?cid=1
Coyle, D (2014), GDP: A Brief But Affectionate History, Princeton University Press, Princeton.
Fisher, I (1922) [1911], The Purchasing Power of Money, Macmillan, New York. Hanke, S (2014), GO: J. M. Keynes vs J.-B. Say, Global Asia (July).
Hayek, F A (1935) [1931], “Prices and Production” 2nd ed., George Routledge, London. Hicks, J R (1973), Capital and Time, Oxford University Press, Oxford.
Jones, C I and P J, Klenow (2016), “Beyond GDP? Welfare Across Countries and Time”,
American Economic Review 106 (September), 2426-2457.
Jorgenson, D W, J S Landefeld, and W D, Nordhaus (2006), A New Architecture for the US National Accounts, National Bureau of Economic Research/University of Chicago Press, Chicago.
Kudlow, L (2006) “On Jobs, Tax Cuts, and the Democrats”, National Review Online
(September 5).
Kuznets, S (1934), “National Income, 1929-1932”, Bulletin 49 (June), National Bureau of Economic Research, New York.
Ranson, R D (2015) “Alternative data to track the economy and better explain capital-market prices”, Economy Watch, HCWE & Co. (November 3), http://www.hcwe.com/ trials/EW-1015.pdf
Skousen, M (1990), The Structure of Production, New York University Press, New York, Updated with new introductions in 2007 and 2015.
Skousen, M (2015), Introduction to the third revised edition, The Structure of Production, New York University Press, New York.
Skousen, M (2014a), Economic Logic, 4th ed. Capital Press, Washington, DC.
Skousen, M (2014b), “At Last, a Better Economic Measure”, Wall Street Journal (April 23). Solow, R (1957), “Technical Change and the Aggregate Production Function”, Review of
Economics and Statistics 39 (August): 312–320.
a
uthor and aCknowlEdgEmEntSMark Skousen is a presidential fellow at Chapman University in California. He has taught at Columbia Business School and is a former financial analyst for the Central Intelligence Agency, CIA. His PhD in Economics is from George Washington University. Mark Skousen is the author of over 25 books, including The Structure of Production and The Making of Modern Economics. He was recently identified as one of the world’s most influential living economists.
Acknowledgments: I am especially grateful to Ned Piplovic for providing research assistance on the graphs and data. This paper benefited from presentations at various seminars at Columbia Business School, University of Virginia and Chapman University.
I also wish to thank David Colander (Middlebury), Sean Flynn (Scripps), Jeremy Siegel (Wharton), William Nordhaus (Yale), Glenn Hubbard (Columbia Business School), Jim Doti (Chapman), Larry Wimmer (BYU), David Ranson (HCWE) and Brian Moyer and other members of the staff at the Bureau of Economic Analysis (BEA) in Washington, DC, for comments and suggestions.