http://www.diva-portal.org
Preprint
This is the submitted version of a paper presented at The 3rd edition of the International Conference Governance of a Complex World 2014, GCW 2014, “Smart, inclusive and sustainable growth: lessons and challenges ahead”, Turin, Italy, 18-20 June, 2014.
Citation for the original published paper: Rånge, M., Sandberg, M. (2014)
Windfall Gains or Eco-Innovation? 'Green' Evolution in the Swedish Innovation System. In:
N.B. When citing this work, cite the original published paper.
Permanent link to this version:
1
17 June 2014
Windfall Gains or Eco-Innovation?
‘Green' Evolution in the Swedish Innovation System
Max Rånge and Mikael Sandberg
University of Halmstad, Sweden
A paper presented at the
3
rdedition of the international conference
Governance of a Complex World 2014
GCW 2014
“Smart, inclusive and sustainable growth:
lessons and challenges ahead”
18-20 June, 2014
Campus Luigi Einaudi (CLE)
Lungo Dora Siena 100, Turin (Italy)
2
Windfall Gains or Eco-Innovation? ‘Green' Evolution in the Swedish Innovation System*
Extended abstract
In theory, innovation processes lie behind the evolution of national systems as they create interacting dynamics among organisations. Institutions and policies are considered means for influencing these interactive dynamics, such as shifting innovative focus from traditional to environmentally oriented production, more environmentally friendly types of energy use, or environmental protection measures, products or services. Institutions and policies are thus considered drivers of change in technologies, processes, markets, raw materials or organisational forms--innovation in a Schumpeterian sense. Shifts in energy sources, from fossil to non-fossil sources, among organisations in the Swedish innovation system therefore call for explanations in terms of changed institutions and policies and their resulting eco-innovations. This paper looks more closely into climate gas emission and the shift to non-fossil energy in Sweden; what types of organisations are behind the shift to non-fossil energy use, what are the relative effects on emissions, to what extent can these interactive dynamics be considered eco-innovations, and if so, can they be related to specific institutions and policies?
Quantitative analysis of evolving innovation processes in national systems is not always possible due to a lack of reliable and multi-level time-series data sets. This is also true for eco-innovations (‘green' innovations). In the Swedish case, there are detailed data sets at national, regional, organisational and employee levels, making possible the estimation of evolutionary models. Register data can be merged with time series on environmental energy consumption and emissions. Data allow for a detailed analy-sis of environmentally oriented innovation from at least 2003. Analyses in this paper are based on time-series of data on the recent shift from fossil to non-fossil energy sources in the Swedish innova-tion system, as well as data on emissions, and potentially innovainnova-tion promoting parameters at organi-sational and employee levels. Methods are quantitative, and Cox regression is used.
Previous investigations of the energy use of Swedish organisations reveal a clear shift from fossil to non-fossil energy use. This is described both in terms of cumulative energy use and effects on emis-sions of carbon dioxide. Data provide us with information for concluemis-sions on why energy sources change and in interaction with what organisational parameters. For example, wood fuel and solid waste increase as sources of energy while fossil oil has decreased during the years 2003 to 2010. This result is in line with national industrial and environmental policies and presented as institutionally and policy related ‘green innovation'. But a quantitative analysis contests such a conclusion and it is no-ticed that the shift to non-fossil sources of energy has not led to verifiable decreases in green-house gas emissions. Public ownership is the single most important contributor to green innovation in non-fossil energy use. Still, CO2 emissions are not fundamentally reduced by this low-tech shift, since they do not affect end-of-pipe reductions. What we observe is in fact wind-fall gains rather than eco-innovations behind the Swedish shift from fossil to non-fossil energy use.
*
3
Windfall Gains or Eco-Innovation? ‘Green' Evolution in the
Swedish Innovation System
Max Rånge and Mikael Sandberg
Introduction
In theory, innovation processes lie behind the evolution of national systems as they create interacting dynamics among organisations. Institutions and policies are considered means for influencing these interactive dynamics, such as shifting innovative focus from traditional to environmentally oriented production, more environmentally friendly types of energy use, or environmental protection measures, products or services. Institutions and policies are thus considered drivers of change in technologies, processes, markets, raw materials or or-ganisational forms--innovation in a Schumpeterian sense (Schumpeter 1947). Shifts in ener-gy sources, from fossil to non-fossil sources, among organisations in the Swedish innovation system therefore call for explanations in terms of changed institutions and policies and their resulting eco-innovations. This paper looks more closely into climate gas emission and the shift to non-fossil energy in Sweden;
what types of organisations are behind the shift to non-fossil energy use, what are the relative effects on emissions, to what extent can these interactive dynamics be considered eco-innovations, and
4 Background
From most points of view, not least from the political perspective, a “greening” of produc-tion by means of innovaproduc-tion is highly desirable. Most countries wish to excel at being in-creasingly “green” in technologies, processes and products, logistics, raw materials, waste handling and so forth. From a social scientist’s perspective, however, the dominating prob-lem is how to be able to investigate what has actually been accomplished and what the likely prospects are in this area. First of all, many of us already have problems in defining a “green-ing” of innovation. Second, the problem is one of data: are there any ways we can estimate the development in our innovation systems regarding green versus conventional innova-tions? Only on the basis of existing data might we, thirdly, consider measuring, modelling, estimating, explaining, and perhaps even forecasting, such greening of innovation in our sys-tems.
In order to study and assess development in this area, one has to have reliable data stretching sufficiently far back in time. One may, of course, initially make a general mapping of both the environmental orientation of the production of goods and services over the whole economy or its sectors and industries. But the grading system is critical for such data gathering. For example, is an environmentally oriented improvement of traditional pro-duction and processes measurable with the same scales as the propro-duction of recycling ser-vices? One may also ask which economically, as opposed to environmentally motivated, modifications in existing production processes, for example energy saving, may qualify as “green” innovation. Can any production or process be considered “green” or “conventional” by the fact that they affect the environment more or less? These questions point to the problems in defining “environmentally sound”, “green” or “eco-efficient” production. It also
5
means that the measurement of “green” innovation, or “eco-innovations” in technologies, products or processes become difficult or controversial. This does not mean, however, that such attempts should be avoided. Instead, it means that one should focus, as social scien-tists, on what is measurable, what has actually been measured, and start off with the ques-tions that can be answered.
When presenting empirical research results based on necessarily controversial definitions and measurements, it is therefore critical to emphasise what these results are not saying as much as what they are saying. In particular, any results on the ratio between green and traditional sectors or innovations of the economy have only to be presented with de-tailed definitions on whether they depict the greening by new products, new processes or innovations.
The innovation system is, in this case, simply understood as all changes in val-ues from one year to the next in the registered variables of activities of all organisations in-cluded in the merged official time-series data set. The basic unit of the innovation system is,
therefore, change in activities, rather than the population of organisations and individuals as agents of change. Such a change can be defined as a change in orientation from traditional to environmentally oriented production, more environmentally friendly types of energy use or larger amounts of environmental protection measures among organisations that are con-sidered “greener” innovations in the Schumpeterian sense of change in technologies, pro-cesses, markets, raw materials or organisational forms (Schumpeter 1934). Considering change as the fundamental unit in a system makes it natural to model the evolution of changes and interactions between them over time. Our focus is, therefore, to study such evolution of greener innovations in the Swedish innovation system. This, of course, requires
6
time-series data from which changes in organisational activities can be extracted, modelled and analysed. The aim of this article is thus to make some initial explorations in this direc-tion.
Swedish National Register Data
Data sets can have different structures and be more or less suitable for testing different kinds of models that can help us to understand the dynamics of an innovation system. The best form of data cover the whole population of cases – individuals as well as organisations – in the system, and variables should, of course, be those that are included in the model. When dynamics are in focus, a time-series data structure is essential. It is always critical that data are of high quality, i.e. the values of the variables should correspond to actual condi-tions. Other types than such total sets of data are often based on samples of the organisa-tional population in which the larger organisations of the population are completely cov-ered, while smaller organisations are randomly selected. This is the case with other interest-ing data sets, such as the Eurostat CIS data set, which provides comparable data for Europe-an Union member states on innovation, including environmentally oriented innovations.
In this case, where we focus on Swedish environmental innovation as changing environmentally significant activities of organisations, there is one data set option that one must consider superior to all the rest, namely the national register data of all organisations in Sweden in a time-series structure (Statistics Sweden’s so-called ‘FAD’ data set, ‘data on enterprise dynamics’ or ‘demography’). This data set can also be merged and expanded with variables available at an organisational level, such as environmental product data and data on the industrial use of various types of energy sources and environmental protection
7
measures (apart from electric energy). There is also data on use of various types of energy sources among Swedish organisations and their emissions (see table 1).
FAD is compiled from yearly Labour Market Register Data (“RAMS” register da-ta on the labour market) – information from organisational and sub-unit level as well as em-ployee level. All organisations, their sub-units (separate plants etc., with their own address-es) and all with case identification employees are included on these three levels. FAD is, therefore, a time series of these RAMS data and is therefore demographic in character. It means that by using FAD you may study ‘births’ and ‘deaths’ of organisations and their sub-units as well as mergers and splits over a period of several years, depending on the variables. Data quality issues are addressed systematically. Interestingly, RAMS data also includes fig-ures regarding all education data on all employees. For example, in this study, data on the number of employees having at least an undergraduate education in at least one course is used for company level aggregation, as is the number of employees with an environmental education of any type. The company-level aggregates are then used in the further analysis of company and organisation behaviour in terms of energy use.1
//Table 1 around here//
In a separate file, the so-called Coal File (‘ the coal file’), data on both energy use and emis-sions of various kinds are given for industrial organisations in Sweden, both private, state or municipally owned or administered (Statistics Sweden 2010). Among the energy types coded we find e.g. solid fossils (coal and coke), liquid fossils (oil), fossil gas, gasoline, non-fossil sol-ids and non-fossil liquid gas, solid waste, and wood fuel (for details, see figure 1-2 below).
8
This implies that types of fuels are easily grouped into fossil and non-fossil fuels. In addition there are also emission data included, such as emissions of carbon dioxide and a series of other gases (Statistics Sweden 2010). Omitted are, of course, energy users other than indus-try, such as households. The production of electric power by power plants is not deducted from the consumption (and we realise that energy is never consumed, but still use this term.)
In describing its data, Statistics Sweden (SCB) states that time-series data sets have been created in a way that makes temporal comparisons possible. Each year the entire data set is checked to ensure that the variables are reliable over time (Statistics Sweden 2008). The classifications made in the time-series data SCB provides for the period 2003– 2011 are shown in the figure 1.
By combining environmental product data with FAD one can obtain a data set from which it is possible to make authoritative conclusions about the total number and vari-ety of environmental product-oriented organisations in Sweden, their regions and industries. It is also possible to add individual-level variables, such as: age of the individual, type of edu-cation, level of education level, employment status, region where the individual lives, labour mobility, occupational code, sex, wage, number of employees, and so on. To some extent, hypotheses of networking effects on eco-innovation (Horte and Halila 2008; Fawzi Halila 2011) can be tested on this kind of data. Public organisations are also included in the data set. This means that publicly and privately owned organisations can be compared in various industries. A comparison between activities of private and public organisations is often in-teresting from a public policy point of view, and will, of course, be presented as a
back-9
ground to change modelling and analysis of time-series information of transitions to non-fossil energy.
To make analyses comparable with international research, and also from a de-scriptive point of view, it would also be advantageous to be able to define and operationalise “eco-innovation” on the basis of variables in this data set. “Eco-innovation” has been defined by Arundel and Kemp (2009: 5) as something much wider than environmental products only:
the production, assimilation or exploitation of a product, production process, service or management or business method that is novel to the organisation (developing or adopting it) and which results, throughout its life cycle, in a duction of environmental risk, pollution and other negative impacts of re-sources use (including energy use) compared to relevant alternatives.
In particular, in this paper, we will look more closely the reduction of CO2 aspect of
eco-innovation, and the factors affecting this aspect of greener innovation (Figge and Hahn 2004; Arundel and Kemp 2009). This research therefore touches upon a number of issues, such as energy transitions and innovation dynamics (Safarzynska 2013; Schmidt et al. 2012; Ghisetti and Quatraro 2013), the “Porter hypothesis” that environmental standards can trigger inno-vation offsets (Porter and van der Linde 1995), functions of innoinno-vation systems (Hekkert et al. 2007; Tukker 2008), CO2 emissions in Swedish manufacturing industries (Pardo Martínez
and Silveira 2013; Bergquist and Söderholm 2011; Guziana 2011), country case comparison in the shift from fossil to non-fossil fuel (Lincoln 2012; Wang et al. 2012; Armstrong and Blundell 2007; Costantini 2013; Costantini et al. 2012), responses to the global climate change (Witthaus 2012), and more generally, models of evolutionary environmental eco-nomics (Faber and Frenken 2009; Bergh 2007). Since education indicators are used in the
10
statistical analysis, our results should also be interesting for those who investigate aspects of knowledge versus formal education in relation to innovation (Jensen et al. 2007; Colombelli et al. 2013).
The paper follows a cultural evolutionary approach to studying population dy-namics in industry performance (Sandberg 2006) rather than an organisational-ecological focusing on firms themselves as units (Hannan and Freeman 1989; Carroll and Hannan 2000; Aldrich 1999). The units of analysis or cases in the matrix are therefore the usages of various practices in organisations (Sandberg 1999, 2006); in this case various energy sources. What matters therefore is the survival time of usages or types of energy use. Survival analysis or more specifically Cox regression, is adequate for the structure of time series data in our ma-terial on how the use of various energy sources changes – emerges, transforms and vanishes - over time in organisations.
Energy Use and CO2 Emissions
Among the datasets mentioned in table 1 above, one covers energy use and emissions (the Statistics Sweden “coal file”). The sample made in this data set is less than two thousand enterprises each year but covers all the largest organisations in Sweden and a structured sample of the rest in terms of both industry (“SNI”, a Swedish organisational taxonomy) and sector (private, public, etc., see table 1). Data from the coal file can be used to explore fun-damental trends in Swedish energy use (for a description of the data set, see Statistics Sweden 2010) at the level of energy use of each organisation. The data set includes organi-sations involved in agriculture, fisheries, wood processing, industry, construction, transport,
11
public organisations, housing, and private services. An overview of the energy use by these different types of organisations is given in figure 1.
//Figure 1 around here//
At least three important conclusions can be drawn from figure 1. One is that wood fuels have rapidly been increasing their share as a source of energy, in particular in the years 2003-2010, as well as solid waste to a somewhat lesser extent continuously throughout the period of investigation. These two types of non-fossil energy are behind the shift from fossil to non-fossil energy during these years, as a consequence of the reduction of fossil oil and solid fossils. However, fossil gases are second largest in terms of energy consumption. “Green innovation”, therefore, is in the case of Sweden a matter of replacing fossil oil and solids with wood and waste, in combination with an increasing use of fossil gas. If the two groups of sources, fossil and non-fossil, are compared, we can see that the shift around 2006 becomes very clear (se figure 2).
//Figure 2 around here//
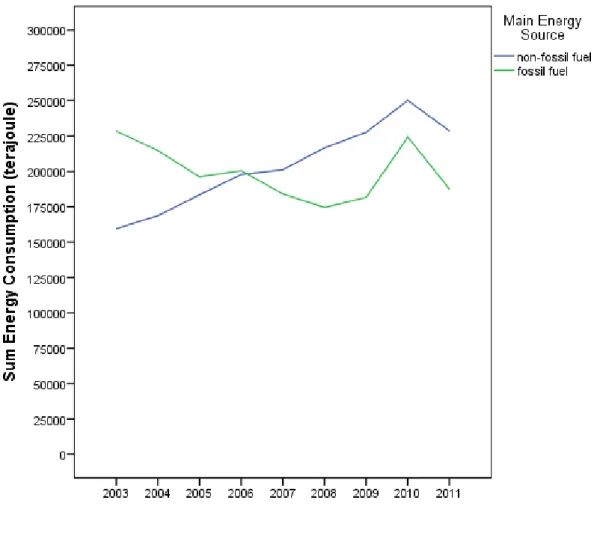
Figure 2 describes the shift from fossil to non-fossil fuel as a source of energy among Swe-dish organisations in the simplest graphic form. The fossil fuels decrease as the non-fossil fuels increase as an energy source. Taken together, energy consumption in total declines the last years of the period measured, which is in line with what Statistics Sweden reports
12
(Statistics Sweden 2010). Our question is then if this also implies a “greening” of Swedish industry and other organisations in the sense that CO2 emissions decline as a consequence of
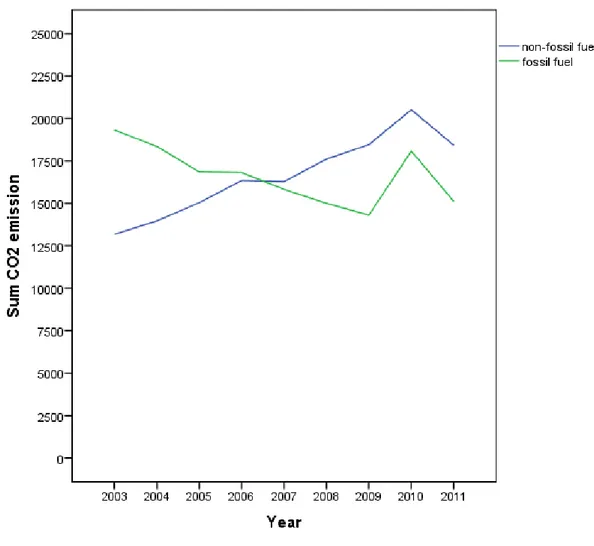
this shift. Looking at figure 3, we understand that this is not the case.
//Figure 3 around here//
The shift from fossil to non-fossil energy in Sweden has had the consequence that non-fossil users are responsible for increasing CO2 emissions (figure 3). The shift 2006-2007 is dramatic
and mirrors the consumption figures. As the emissions mirror consumption, the increasing CO2 emissions arise as a consequence of increasing consumption of the energy from
primari-ly wood fuels, but also solid waste, while fossil oil especialprimari-ly is declining as a source of car-bon dioxide. The gap between fossil and non-fossil energy closes as a consequence of in-creasing total consumption in particular in 2010.
Survival Analysis of “Eco-Innovations”
Survival analysis is a statistical technique, in which we are concerned about the time dura-tion until a specific event occurs. It is thus a technique that requires time-series data of the type we have at hand here. The event can be, for example, when an organisation changes from fossil to non-fossil fuel use. Typical to the survival analysis of time-series, some cases never reach the analysed variable value (the event of change into non-fossil energy use), and are therefore ‘censored’. Since such a variable with censored cases does not follow a normal distribution, a times-series, event history or survival analysis is required. In this paper we will
13
use a Cox regression, since it produces prediction at survival time t as a function of baseline survival taken to the power of an expression that contains predictors we wish to include as co-variates or factors behind the shift to non-fossil energy sources.
The Cox regression is developed for purposes of biostatistics, such as the analy-sis of survival among cancer patients in relation to treatment. This means that survival in relation to an illness condition may correspond to, with respect to our data, either the event of innovating into non-fossil sources of energy or the reverse event, analysed in the next step below. However, the Cox regression is not only used to actually study survival and haz-ard ratios among patients, but is also used in analysis of clinical trials examining time to dis-ease resolution (i.e. in the study of the “survival of the disdis-ease” or its symptoms), something which perhaps is a more easily acceptable analogy for the analysis of a “pathological” usage of fossil energy. In a Cox regression, the hazard ratio represents the hazard that a treated patient will resolve symptoms before a control patient. The relation of the hazard rate in the two groups is called the hazard ratio. Stated the analogous way, for any randomly selected pair of organisations’ use of fossil energy, one from the ‘treatment’ group (in our case an organisation that was affected earlier by a specific condition likely to enhance the likelihood of earlier transition to non-fossil use), and one from the control group of fossil user organisa-tions (without such a condition in each co-variate). The hazard ratio in our case is therefore the ratio of the ‘hazard’ that the time to ‘healing’ (an advantageous transition to non-fossil use) is less in the organisation from the group of organisations affected by a hypothesised factor than in the organisations of the control group.
Survival of fossil use among organisations can be analysed using Statistics Swe-den’s ‘coal file’, merged with data on employee education programmes and levels, provided
14
in the Statistics Sweden labour market data base (RAMS), if aggregated at organisation level and tied using organisational number as key (see table 1). That way, data both on the organ-isations’ ownership, degree of market orientation, energy consumption, economic added value, operational profit, and revenues, can be combined with the factor of general level of education of their employees and the degree to which employees have any kind of (at least undergraduate) environmental programme education. The effect of all these factors on the ‘survival of fossil energy use’ can then be made using Cox regression, and also separately for various types of industrial industries. The model used here lists the hypothesised variables that affect the likelihood of survival of fossil use among Swedish industrial organisations. Column B first indicates the direction of how these factors influence the event of non-survival of fossil energy use; minuses indicate that these factors negatively affect the likeli-hood of the event of transition to democracy. Column Exp (B) gives the predicted change in the hazard for each unit increase in the covariate (the factor). When the Exp (B) value is 1.0, the covariate makes no difference in predicting the event of transition to non-fossil energy. The more the hazard ratio exceeds 1.0, the greater the relative hazard of ‘death’ of fossil energy use--related to a change in a factor or covariate. An Exp (B) value of 1.1 for any of the covariates would mean that a positive value of the factor in question would be associated with a 0.1 (10%) increase in the hazard rate for an innovation into use of non-fossil energy. The further the hazard ratio is below 1.0, then the greater the covariate’s contribution to decreasing the hazard of ‘death’, in this case decrease in the ‘hazard’ of innovation into non-fossil energy use. We test hypotheses of effects of employees’ education, the number of environmentally educated to all educated at undergraduate level, on green innovations and the time lags for such effects, along with consumption levels, turnover, value added, and
15
operating profits as indicators of the economic situation of the organisations. We are also interested in the fact that some organisations are public, while others are private.
Note that the sample of the ‘coal file’ is not randomised, but comprised of the largest enterprises and organisations. This means that the test of statistical significance in the Cox regressions should be treated accordingly, i.e. since the sample is not randomised, the hazard ratio Exp (B) describes actual values. However, levels of statistical significance in the form of p values are normally followed even in analyses of total samples.
Survival Analysis of Fossil Energy
A survival analysis is first made on the already described set of industrial organisations, their energy use, a set of economic variables (the coal file) combined with aggregated values of numbers of employees with environmental education and at least undergraduate education, as well as the ratio between them (the yearly RAMS files).
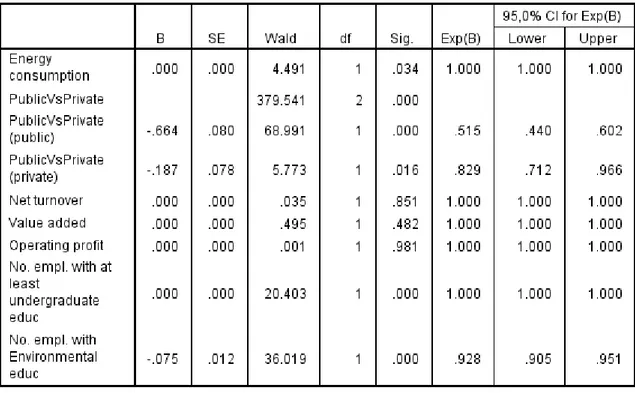
//Table 2 around here//
The Cox regression shows, first, that neither private ownership, value added to the organisa-tion, nor the number of environmentally educated employees significantly affect the likeli-hood of survival of the fossil energy use (p>0.05). Since energy consumption, net turnover and operational profit all have Exp (B) values of 1, we can say with statistical accuracy that these factors do not influence the survival of the fossil energy use at all. The factor
environ-16
mentally educated has a slightly lower Exp (B) value than 1, indicating that, in fact, the em-ployment of environmentally educated personnel increases the chances of survival of
non-fossil use among Swedish organisations. This is an unexpected result. Maybe, these
organisa-tions have been in situaorganisa-tions in which environmentally trained employees are needed in or-der to investigate future energy sources. The last factor in the model, with a strong detri-mental effect on the survival of fossil energy use is public ownership, however, i.e. publicly owned organisations are more likely to innovate from fossil to non-fossil energy. The Exp (B) of slightly more than 2 implies that public organisations have 68 per cent higher probability of reaching the non-fossil energy use than the private ones (the probability equals the haz-ard ratio Exp(B) divided by 1 + the same hazhaz-ard ratio).
Survival of Non-Fossil Energy
Similarly, we may look at the reverse analysis, i.e. a Cox regression in which the survival of non-fossil, rather than fossil, energy use is analysed with the same set of co-variates.
//Table 3 around here//
In this analysis, we look at the factors influencing the reversal from non-fossil to fossil energy use in Swedish organisations 2003-2011. In this analysis, net turnover, value added, and op-erational profit are not statistically significant factors for explaining why organisations fail to maintain their non-fossil energy use. Energy consumption and the number of employees with at least an undergraduate education have a hazard ratio of 1, indicating statistical
sig-17
nificance of their non-influence on the survival. Organisations with a higher number of envi-ronmentally educated and privately owned organisations are somewhat more likely to stick to the non-fossil use. A statistically significant larger effect is again only found among public organisations as opposed to private, where the Exp (B) value is only .515, indicating that be-ing a public rather than a private organisation enhances the probability to, instead, intro-duce fossil fuels as an energy source by 34 percent.
Discussion
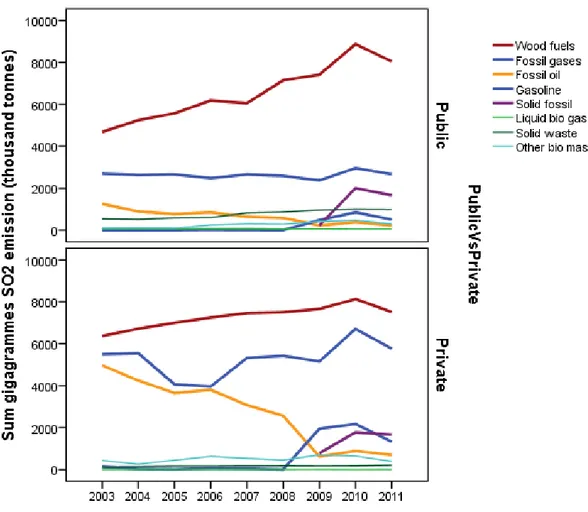
Results from our survival analysis of energy usages among Swedish industrial organisations 2003-2011 on the basis of register data, show that neither energy consumption, economic indicators of the organisations, nor the education levels in general play important roles for why these organisations innovate in the direction to or from the use of non-fossil sources. The Cox regressions cannot find more than one distinct co-variate affecting the likelihood of greener or non-greener innovation in this respect than public versus private ownership. Pub-lic ownership of an organisation drastically increases the chances for fossil energy users to become later non-fossil energy users fast. Public ownership also drastically reduces the haz-ard that an organisation already using non-fossil energy instead rapidly starts using fossil energy. The industrial sector to which a publicly-owned organisation belongs is critical to whether it introduces the use of non-fossil energy. In this case it is the effect of the major public electricity and heating water producers that shifted from fossil oil to wood fuel, according to the industry codes revealed in FAD data. From what we can see in descriptive statistics (figure 4), public organisations primarily use wood fuels, at least they did until
18
2010, while private organisations also use fossil gases to a substantial degree. Private organi-sations, more than public, shifted from fossil oil to fossil gases. This is obviously why the ownership factor plays such a crucial role in the survival analyses of fossil vs. non-fossil ener-gy in Sweden. More specific sector studies can be made using other data sets from Statistics Sweden.
//Figure 4 around here//
The result suggests that the shift to non-fossil use is, to a major part, a question of using wood fuels instead of fossil oil. Two storms in 2005 and 2007 helped the public en-ergy producers fulfil non-fossil fuel policies. Unfortunately this shift did not affect CO2
emis-sions, which is why this shift is neither high-tech nor a matter of eco-innovation, but simply a market innovation, if using Schumpeter’s definition (1947). The shift from fossil to non-fossil energy use in Swedish industry 2003-2011 was caused by windfall gains, rather than eco-innovations.
19
Figure 1. Total energy use (apart from electricity) by Swedish organisations 2003-2011 (tera-joules)
20
21
22
23
Table 1. Number of cases in two mergeable Swedish register databases 20032011 on
indi-vidual employees and all registered organisations.
Employee data (RAMS)
Energy Use and
Emission data ("The Coal file")
Year No. Employees No. Organisations
2003 4,095,047 1,456 2004 4,173,085 1,431 2005 4,184,556 1,336 2006 4,290,877 1,386 2007 4,401,126 1,368 2008 2009 2010 2011 4,417,583 4,291,088 4,402,789 4,459,310 1,431 2,414 2,402 2,412
24
Table 2. Survival of Fossil Energy Use in Swedish Industry: a Cox Regression
Note: The model reduces the -2loglikelihood from 87520.35 to 86543.37, a statistically sig-nificant change at 99% level (chi-sq.). Public vs. private organisation is included as categorical variable.
25
Table 3. Survival of Non-Fossil Energy Use in Swedish Industry: a Cox regression
Note: The model reduces the -2loglikelihood from 160823.42 to 160187.89, a statistically significant change at 99% level (chi-sq.). Public vs. private organisation is included as cate-gorical variable.
26
References:
(SCB), Statistics Sweden. "Kvalitetsdeklaration av den årliga regionala
sysselsättningsstatistiken 1991:1." Stockholm: Statistics Sweden (SCB).
———. 1988. "Årlig regional sysselsättningsstatistik 1988:7." Stockholm: Statistics Sweden (SCB).
Aldrich, Howard. 1999. Organizations evolving. London ; Thousand Oaks: Sage Publications. Armstrong, Fraser, and Katherine Blundell. 2007. Energy : Beyond Oil. Oxford, GBR: Oxford
University Press, UK.
Arundel, Anthony , and René Kemp. 2009. "Measuring Eco-Innovation." In UNU-MERIT
Working Paper Series. Maastricht: UNU-MERIT.
Bergh, Jeroen C. J. M. van den. 2007. Evolutionary economics and environmental policy :
survival of the greenest. Cheltenham, UK ; Northampton, MA: Edward Elgar.
Bergquist, Ann-Kristin, and Kristina Söderholm. 2011. "Green Innovation Systems in Swedish Industry, 1960-1989." Business History Review 85 (4):677-98.
Carroll, Glenn, and Michael T. Hannan. 2000. The demography of corporations and
industries. Princeton, N.J.: Princeton University Press.
Colombelli, Alessandra, Jackie Krafft, and Francesco Quatraro. 2013. "Properties of
knowledge base and firm survival: Evidence from a sample of French manufacturing firms." Technological Forecasting and Social Change 80 (8):1469-83.
Costantini, Valeria, Crespi, Francesco. 2013. "Public policies for a sustainable energy sector: regulation, diversity and fostering of innovation." Journal of Evolutionary Economics 23 (2):401-29.
Costantini, Valeria, Costantini Valeria, and Mazzanti Massimiliano. 2012. "On the green and innovative side of trade competitiveness? The impact of environmental policies and innovation on EU exports." Research Policy 41 (1):132.
Faber, Albert, and Koen Frenken. 2009. "Models in evolutionary economics and environmental policy: Towards an evolutionary environmental economics."
Technological Forecasting and Social Change 76 (4):462-70.
Fawzi Halila, Jonas Rundquist. 2011. "The development and market success of eco-innovations: A comparative study of eco-innovations and “other” innovations in Sweden." European Journal of Innovation Management 14 (3):278-302.
Figge, F., and T. Hahn. 2004. "Sustainable Value Added - measuring corporate contributions to sustainability beyond eco-efficiency." Ecological Economics 48 (2):173-87.
Ghisetti, Claudia, and Francesco Quatraro. 2013. "Beyond inducement in climate change: Does environmental performance spur environmental technologies? A regional analysis of cross-sectoral differences." Ecological Economics 96:99-113.
Guziana, Bozena. 2011. "Is the Swedish environmental technology sector ‘green’?" Journal of
Cleaner Production 19 (8):827-35.
Hannan, Michael T., and John Freeman. 1989. Organizational ecology. Cambridge, Mass.: Harvard University Press.
Hekkert, M. P., R. A. A. Suurs, S. O. Negro, S. Kuhlmann, and R. E. H. M. Smits. 2007. "Functions of innovation systems: A new approach for analysing technological change." Technological Forecasting and Social Change 74 (4):413-32.
27
Horte, Sven Ake, and Fawzi Halila. 2008. "Success factors for eco-innovations and other innovations." International Journal of Innovation and Sustainable Development 3 (3):301-27.
Jensen, Morten Berg, Björn Johnson, Edward Lorenz, and Bengt Åke Lundvall. 2007. "Forms of knowledge and modes of innovation." Research Policy 36 (5):680-93.
Lincoln, Stephen F. 2012. "Options for Change in the Australian Energy Profile." Ambio 41 (8):841-50.
Pardo Martínez, Clara Inés, and Semida Silveira. 2013. "Energy efficiency and CO2 emissions in Swedish manufacturing industries." Energy Efficiency 6 (1):117-33.
Porter, Michael E., and Claas van der Linde. 1995. "Toward a New Conception of the Environment-Competitiveness Relationship." Journal of Economic Perspectives 9 (4):97-118.
Safarzynska, Karolina, van den Bergh, Jeroen C. 2013. "An evolutionary model of energy transitions with interactive innovation-selection dynamics." Journal of Evolutionary
Economics 23 (2):271-93.
Sandberg, Mikael. 1999. Green post-communism? Environmental aid, Polish innovation, and
evolutionary political economics. New York: Routledge.
———. 2006. "The evolution of IT innovations in Swedish organizations: a Darwinian critique of ‘Lamarckian’ institutional economics." Journal of Evolutionary Economics 17 (1):1-23.
Schmidt, Tobias S., Malte Schneider, and Volker H. Hoffmann. 2012. "Decarbonising the power sector via technological change – differing contributions from heterogeneous firms." Energy Policy 43 (0):466-79.
Schumpeter, Joseph A. 1947. "The Creative Response in Economic History." Journal of
Economic History VII (2):149-59.
Schumpeter, Joseph Alois. 1934. The theory of economic development; an inquiry into
profits, capital, credit, interest, and the business cycle. Cambridge, Mass.,: Harvard
University Press.
Statistics Sweden, SCB. 2008. "Miljöräkenskaper." Stockholm: Statistics Sweden, SCB. ———. 2010. "Annual Energy Balance Sheets 2007–2008." Stockholm: Statistics Sweden,
SCB.
Tukker, Arnold, Charter, Martin, Vezzoli, Carlo, Sto, Eivind, and Andersen, Maj Munch (eds.). 2008. System Innovation for Sustainability, Volume 1 : Perspectives on Radical
Changes to Sustainable Consumption and Production. Sheffield, South Yorkshire,
GBR: Greenleaf Publishing.
Wang, Zhaohua, Bin Zhang, and Jianhua Yin. 2012. "Determinants of the increased CO2 emission and adaption strategy in Chinese energy-intensive industry." Natural
hazards (Dordrecht) 62 (1):17-30.
Witthaus, Ben. 2012. International Climate Regime and its Driving-Forces : Obstacles and
Chances on the Way to a Global Response to the Problem of Climate Change.
28
Notes:
1
In the documentation from Statistics Sweden (SCB), the quality of RAMS is discussed in “År-lig regional sysselsättningsstatistik 1988:7”, “Kvalitetsdeklaration av den år“År-liga regionala sys-selsättningsstatistiken 1991:1”. SCB notes that the greatest effort is devoted to finding the correct sub-unit for the employees. It is primarily on that particular point that quality prob-lems may arise. Employers with more than one organisational sub-unit have been given a
sub-unit control figure since 1985 from the tax authorities. These control figures should be tied to the address of the sub-unit and be included in the organisational registry data set. If the data entry is incomplete or incorrect, this may, of course, lead to quality problems. However, the organisations are contacted in order to extract the correct data.