Master Thesis in Business Administration
The impact of critical IPTV factors on customer satisfaction A case study of ATN Company in Sweden
Written by:
Afsaneh Khodabandeh 890919 Reem Haitham 850911
Dr. Konstantin Lampou (Supervisor) Dr. Peter Dahlin (Co-assessor)
Master Thesis in Business Administration (EFO704) School of Business, Society and Engineering Mälardalens University
Master Thesis in Business Administration
ii ABSTRACT
The relationship between customer satisfaction its determinants is one of the most central assumptions for marketing theory and practice. In order to figure out the connection between different dimensions and customer satisfaction in IPTV market, this research studied both functional and technical factors. Functional factors include the elements of Service Quality (SERVQUAL). These elements are tangible, assurance, empathy, responsiveness, and reliability. For technical factors, the elements are channel-zapping time, quality of service and packet loss. The aim of this paper is to investigate the impact of technical factors and functional factors as well as the interaction between them on customer satisfaction. The project investigates subscribers of ATN Company who are Middle Easterners across three different countries namely: Canada, United State, and United Kingdom. The base of this research is primary data which was gathered by an online survey. Researchers utilized the quantitative method in this project. The result of the analysis shows that several factors have a positive impact on customer satisfaction. These factors are tangibles, reliability, responsiveness, assurance for SERVQUAL, and quality of service and packet loss for technical factors.
Keywords:
iii ACKNOWLEDGEMENT
The authors would like to thank our supervisor Dr. Konstantin Lampou for his generous guidance and support. Words might not be able to express our gratitude. We do not forget our seminar colleagues for their constructive criticizing and all the people who have lent their support in this dissertation. Lastly, we would to thank our dear families for help and support they gave us through thick and thin they help us accomplish this work.
The Authors
Afsaneh Khodabandeh Reem Haitham
Sign: _______________________ Sign: _______________________
iv TABLE OF CONTENTS
ABSTRACT ... ii
ACKNOWLEDGEMENT ... iii
LIST OF TABLES ... vii
LIST OF FIGURES ... viii
ABBREVIATIONS: ... ix
1.
INTRODUCTION ... 1
1.1
Background ... 2
1.1.1
About the company ... 3
1.2
The problem statement ... 3
1.2.1
Purpose: ... 4
1.2.2
Research questions: ... 4
2.
CONCEPTUAL FRAMEWORK ... 5
2.1
Customer satisfaction ... 5
2.2
Theoretical framework ... 6
2.3
Service quality ... 7
2.4
Functional factors ... 7
2.4.1
Tangible ... 8
2.4.2
Reliability ... 8
2.4.3
Responsiveness ... 9
2.4.4
Assurance ... 10
2.4.5
Empathy ... 11
2.5
Technical factors ... 11
2.5.1
Quality of service in IPTV sector ... 11
2.5.2
Channel zapping time in IPTV sector ... 12
2.5.3
Packet losses in IPTV sector ... 12
2.6
Interaction of functional and technical dimension on customer satisfaction
12
3.
METHODOLOGY ... 14
3.1
Method overview ... 14
v
3.3
Data Collection ... 15
3.4
Operationalization of research questions ... 15
3.5
Data analysis ... 16
3.6
Validity and Reliability ... 16
3.7
Limitation ... 17
4.
FINDINGS ... 18
4.1
Customer satisfaction ... 18
4.2
Functional Quality ... 18
4.2.1
Tangible ... 18
4.2.2
Reliability ... 19
4.2.3
Responsiveness ... 19
4.2.4
Empathy ... 19
4.2.5
Assurance ... 20
4.3
Technical quality ... 20
4.4
Description of research findings by SPSS ... 20
4.5
Testing of Hypotheses ... 21
4.5.1
Relationship between SERVQUAL variables and customer satisfaction
21
4.5.2
Relationship between Technical factors and customer satisfaction ... 23
4.5.3
Interaction of functional quality and technical factors on customer
satisfaction ... 24
5.
DISCUSSION: ... 25
5.1
Customer Satisfaction ... 25
5.2
Functional factors ... 25
5.2.1
Tangible ... 25
5.2.2
Reliability ... 26
5.2.3
Responsiveness ... 26
5.2.4
Empathy ... 27
5.2.5
Assurance ... 27
5.3
Technical quality ... 27
5.4
Interaction of functional quality and technical factors on customer
satisfaction ... 28
6.
CONCLUSION ... 29
vi
6.2
Future Research ... 31
REFERENCE: ... 33
Appendix I: Data outputs from SPSS ... 39
Appendix II: Charts and graphs from data analysis... 44
APPENDIX III: Questionnaire ... 51
Master Thesis in Business Administration
vii LIST OF TABLES
Page
Table 01: statistics (SERVQUAL) 39
Table 02: Frequency distribution (SERVQUAL variables) 39
Table 03: Statistics (technical factors) 39
Table 04: Frequency distribution (technical factors) 39
Table 05: Reliability Statistics (Tangible) 39
Table 06:Item-Total Statistics (Tangible) 39
Table 07: Reliability Statistics (Reliability) 40
Table 08: Item-Total Statistics (Reliability) 40
Table 09: Reliability Statistics (Responsiveness) 40
Table 10: Item-Total Statistics (Responsiveness) 40
Table 11: Reliability Statistics (Assurance) 40
Table 12: Item-Total Statistics (Assurance) 40
Table 13: Reliability Statistics (Empathy) 41
Table 14: Item-Total Statistics (Empathy) 41
Table 15: Reliability Statistics (satisfaction) 41
Table 16: Item-Total Statistics (satisfaction) 41
Table 17: Cronbach’s Alphas foe variables of functional quality and customer satisfaction
22
Table 18:Modle summary (functional quality and customer satisfaction) 42
Table 19: ANOVA (functional quality and customer satisfaction) 42
Table 20: Coefficients (functional quality and customer satisfaction) 42
Table 21:Modle summary (technical factors and customer satisfaction) 42
Table 22: ANOVA (Technical factors and customer satisfaction) 42
Table 23: Coefficients (Technical factors and customer satisfaction) 43
Table 24:Modle summary (Interaction of functional quality and technical factors on customer satisfaction)
43 Table 25: ANOVA (Interaction of functional quality and technical factors on
customer satisfaction)
43 Table 26: Coefficients (Interaction of functional quality and technical factors on
customer satisfaction)
43
Master Thesis in Business Administration
viii LIST OF FIGURES
Page
Figure 1: Interaction of functional and technical factors on custome satisfaction 6
Figure 2: customers satisfaction 44
Figure 3: customer satisfaction 44
Figure 4: physical component 45
Figure 5:time shift 45
Figure 6:expected time window 46
Figure 7: function of the box 46
Figure 8:pre-sell service 47
Figure 9:After-sell service 47
Figure 10: technical support 48
Figure 11: responding time 48
Figure 12:archive data system 49
Figure 13: Ask help from ATN 49
Master Thesis in Business Administration
ix ABBREVIATIONS:
ATN Advanced TV Network CZT Channel Zapping Time IP Internet Protocol
IPTV Internet Protocol Television SERVQUAL Service Quality
Master Thesis in Business Administration
1 1. INTRODUCTION
This chapter present the background of the study and the problem statement. The background gives insight into the main topic of this research study, the problem statement points out the main issues and the main objective of this research study.
IPTV (Internet Protocol Television) is a relatively new concept which makes the research on IPTV interesting, hence, this new technology ought to be studied. On the other hand, customer satisfaction is not a new concept. This research studies different concepts such as; customer satisfaction, functional factors, technical factors and interaction between functional and technical factors in the IPTV sector. Customer satisfaction and functional factors are marketing concepts, while technical IPTV factors represent a technological concept. Quality of service, as perceived by customers can be categorized in two dimensions: the first one is technical dimension and the second is functional dimension. According to Dekeris and Narbutaite (2015, p117), IPTV is defined as “multimedia services delivered over Internet Protocol (IP) based networks, which are able to provide the required level of quality of service and experience, security, interactivity and reliability”. With IPTV, the subscriber gets television content via Internet, where user interaction, quality of service and video on demand are the advantages that IPTV has over its predecessor (Punchihewa et al., 2010). There are many avenues via which consumer can get IPTV: “set top box” is one of the ways through which IPTV signal can be received and it is then played on television.
On the other hand, there is no concrete definition of customer satisfaction; various authors have suggested various definitions, which were based on research in this field in the last 50 years. According to these definitions, customer satisfaction is achieved when the customer is happy with the received service or purchased product (Kotler, Armstrong, Saunders, Wong, 2002, p. 8; Lovelock & Wirtz, 2007). This is based on the perceived performances of the product. Customer satisfaction is defined as “the level to which a product’s perceived performance meets a buyer’s expectations” (Kotler et al., 2002, p. 8). Moreover, Customer satisfaction has drawn tremendous attention and interest among practitioners and scholars alike given its role as a significant variable of business strategy (Lovelock & Wirtz, 2007).
2 1.1 Background
The history of marketing reveals knowledge from the past and convey primary information (Tamilia, 2011). It is important to identify how customers behave as they search, evaluate, reject or purchase products and services while expecting to meet some level of satisfaction (Schiffman, Hansen & Kanuk, 2008). Customer satisfaction has been one of the primary goals of marketers. It is a crucial requirement in retaining existing customers, and in turn, it leads to customer loyalty, which is a necessary factor for the continued existence of companies (Khan, 2012).customers who are dissatisfied with services rendered by a firm are not likely to establish long-term relationships with the firm (ibid).
Controlled zapping time, repairing of packet loss and quality of services are the major influencing factors of customer satisfaction in the IPTV sector (Nasir & Khan, 2014). This research study seeks to ascertain how the functional and technical quality affects customer satisfaction; it is consequential to highlight problems that IPTV subscribers encounter. Channel zapping time is one of these issues, which is common for most companies (ibid). The second problem concerns packet loss, which refers to data that is lost in the transmission path between source and destination (Ibid). Lastly, quality of service is about the speed of data transmission. Thus, all of the above-mentioned factors significantly influences customer’s satisfaction. Functional quality dimension influences customer’s evaluation of a good service quality (Grönroos, 2007). The dimensions are Tangible, Reliability, Responsiveness, Assurance, and Empathy, and they will be used in this research to measure the customer perceived service quality and to determine how functional factors impact customer satisfaction.
There are differences between traditional (cable) television and Internet Protocol Television. One of the most important differences is the number and location of channels. The traditional version offers few channels from domestic vicinity through transferring signals. Until the inception of IP networks, television was a broadcast medium. Traditional TV networks offered limited freedom of choice and control to its users (Ramos, 2013). Despite a relatively slow start with 28 million subscribers, the number of subscribers of global IPTV was forecasted to increase about 83 million subscribers in 2013. This is due to the fact that IPTV has gained traction worldwide, due to increased breadth and depth of deployment. Despite IPTV’s anticipation of continued increase, the number of IPTV subscribers decreased after 2013 by 2.5-3 million subscribers.
3
Consequently, this has motivated IPTV marketers to develop strategies that would increase the number of IPTV subscribers (Jang & Noh, 2011).
Irrespective of the growing market traction, competitive atmosphere is becoming tenser as numerous companies compete for market share. IPTV service environment has been encountering a dramatic change together with demanding requirements from customers and market growth; therefore, it is vital to improve IPTV service quality and relationship (Jang & Noh, 2011). IPTV service providers around the world are striving to enlarge their service offering, along with integrated data and mobility service in order to counter declining revenues (Cisco White Paper, 2007). Unless an attractive IPTV service and content are offered to customer, it is almost impossible for the providers to boost their market share enough to sustain a competitive advantage (Jang & Noh, 2011).
1.1.1 About the company
Advanced TV Network (ATN) is an international company, which was established in 2008 in Sweden. All of its servers are located in Sweden; however, the customers of this company are from all around the world. Subsequently, ATN has expanded its operations into all continents. It currently has 32 resellers in Europe operating in 15 different countries and 7 resellers in other continents. The company mission is to provide thousands of people access to TV channels of their native regions, particularly the Middle Eastern countries. In addition, ATN replaces dish-based TV broadcasting with Internet Protocol Television (IPTV) (atnnetwork, 2016). The Internet plays a key role in this system, as the company receives a huge number of channels from the Middle East and makes them accessible to its customers through the Internet. This allows users to connect to these channels through their cellphone, Personal Computer or set top box. Hence, customers only require Internet connection, set top box and TV in order to access the channels. (atnnetwork, 2016).
1.2 The problem statement
IPTV is a relatively new concept with very limited literature about the relationship between its technical factors and customer satisfaction. Articles published in the Journal of Marketing and Universal Journal of Communications and Network covering a period of five years ago were evaluated for this study. It was observed that there is a need to investigate the impact of functional factors on customer satisfaction within the IPTV
4
sector. This research is inspired by a study conducted by Nasir and Khan (2014), as the aim of their study was to find out and check critical factors, which have a great impact on IPTV customer satisfaction”. According to Nasir & Khan (2014), “More factors should be studied for improving customer satisfaction” within the IPTV sector. Furthermore, Keyser and Lariviere (2014) suggest that future research must examine the interaction between technical and functional factors. This project takes the recommendations by these authors into consideration. This project seeks to bridge the research gap in the literature on IPTV by evaluating other elements such as functional factors and also the impact of the interaction between technical and functional factors on customer satisfaction.
1.2.1 Purpose:
The theoretical aim of this study is to investigate the impact of the interaction between technical and functional factors on customer satisfaction with the use of the service quality model. The study also examines, separately, the impacts of functional and technical factors on customer satisfaction. The investigation is carry out by evaluating a specific group of customers at ATN Company. These are customers from the Middle East, who live in the following countries: the United Kingdom, the Unites States of America and Canada. The Practical object of this paper is to re-study the topic by Nasir and Khan (2014), which was investigated three years ago. Re-studying this topic is necessary as the service scape of the IPTV sector continues to change due to entry into the sector by several competitors.
1.2.2 Research questions:
In order to achieve the aim of this study, the following research questions have been formulated:
Q1: What is the impact of functional quality on customer satisfaction within the IPTV sector?
Q2: What is the impact of technical quality on customer satisfaction within the IPTV sector?
Q3: What is the impact of the interaction between functional and technical factors on customer satisfaction within the IPTV sector?
5
2. CONCEPTUAL FRAMEWORK
This chapter provides the necessary information required to understand the theories and concepts used within the model for the study.
2.1 Customer satisfaction
Reviewing the history of marketing provides a variety of information regarding this topic. Previously, the key point, which formed the fundamental base in an economy, was an exchange of merchandise and distribution and this fundamental idea was the core of the study of marketing (Vargo & Lusch, 2004). The ultimate objective for the measurement of customer satisfaction is customer loyalty. Customer satisfaction is found to be a key determinant of a brand’s long-term viability and the foremost input for customer loyalty is Satisfaction. However, satisfied users may switch to another brand when switching costs are low (Deng et al., 2010). Customer satisfaction has a positive impact on loyalty (Khan, 2012). The perception of customers toward purchasing products and services regarding their expectation is satisfaction (Schiffman et al, 2008). According to Chinomona and Dubihlela (2014), satisfaction consists of a variety of characteristics, which can answer the expectation of customers positively. In addition, features that are poor, including low quality and service, can lead customers to be dissatisfied. When customers are confronted with unpleasant service or product, they often switch to another company (Chinomona & Dubihlela, 2014). Furthermore, customer satisfaction plays a significant role in the profitability of a company (Angelova & Zekiri, 2011). Individual expectations have a great impact on Customer satisfaction and it is a highly personal assessment. Johnson & Fornell (1991) defined customer satisfaction according to customer observation, which means that the result of meeting customer expectation toward products and services is customer satisfaction and if customer’s expectation disconfirms the products and services, customer dissatisfaction will occur. Furthermore, Cronin, Brady, & Hult (2000) believe that customer perception plays an active role in customer satisfaction in terms of value received. Dissatisfied customers are influenced by the level of perceive quality, which is less than their own expectation. On the other hand customer satisfaction is described as a consequence of a cognitive and affective assessment, when customers judge standards (Chi-Lin 2003). According to Oliver (1999), customer satisfaction can be considered as a “pleasurable fulfillment”.
6 2.2 Theoretical framework
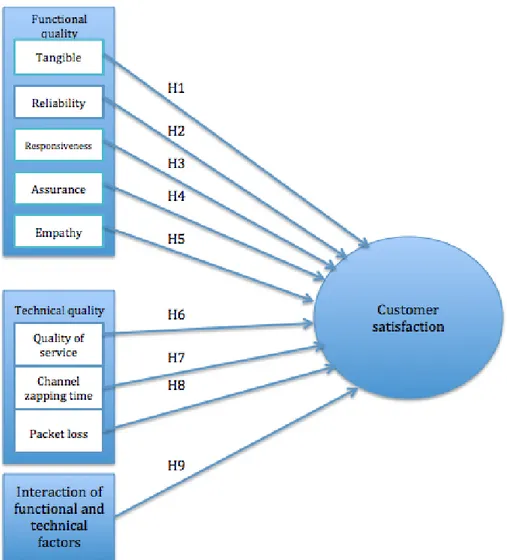
Figure 1 illustrates two dimensions of service quality, which are namely: functional quality and technical quality and the interaction between them. In this model, functional quality consists of the elements of SERVQUAL (Tangible, Assurance, Empathy, Responsiveness and Reliability), while technical quality comprises of Quality of service, Channel zapping time and Packet loss. Each element in the model has an impact on customer satisfaction. There are five hypotheses for functional quality and three for technical quality. Customer satisfaction is the dependent variable in the model, while all other are independent variables. Lastly, the interaction between functional quality and technical quality is added to the model in order to determine the combined impact of both factors on customer satisfaction. Altogether, there are nine hypotheses in the model.
Figure 1: Interaction of functional and technical factors on customer satisfaction Modified model inspired by Grönroos (2000) and Nasir & Khan (2014).
7 2.3 Service quality
Quality is a very subjective concept, as it depends on a person’s perspective. It has numerous definitions in service quality literature. According to (Grönroos, 2007), quality of a particular service or product is defined as whatever the customer perceives it to be. Therefore, when defining quality, it is important to consider it from the customer’s perspective in order to avoid wrong actions in quality programs, which could lead to higher consumption of time and money as well as poor investment (Grönroos, 2007). Service quality is highly important from both academic and practice (Negi, 2009). Additionally, Eshghi, Roy and Ganguli (2008) define the concept as the general evaluation of a service by the buyer. The level of customer satisfaction can be improved if companies took into account the definition of service quality, as they would provide services with higher level of quality (Ghylin, Green, Drury, Chen, Schultz, Uggirala, Abraham, & Lawson, 2006). Ladhari (2009) asserts that service quality is considered to be a key factor that differentiates a company from its competitors.
“A good service is achieved when customers’ expected service matches customer experienced or perceived service” (Grönroos, 2007). The quality of a service as the customer perceives it, comprises of two dimensions: technical and functional. The customer is influenced by “what” they get in the service interaction process, which is the technical dimension and they are also influenced by “how” the service is render to them, which is the functional dimension (Grönroos, 2007). Therefore, both the technical and functional quality dimension influences customer’s evaluation of a good service quality. In the model for this study, functional factors are elements of SERVEQUAL, while the critical IPTV factors are channel zapping time (CZT), Quality of Service (QoS) and packet loss. Critical IPTV factors will be referred to in this study as technical factors.
2.4 Functional factors
The SERVQUAL model is one of the fundamental tools for assessing customer perception toward quality of service (Parasuraman, Zeithaml & Berry, 1985). According to Eshghi et al. (2008), the relationship between customer satisfaction and service quality draws the attentions of both researchers and practitioners, alike. The SERVQUAL model illustrates differences between customer expectations toward service received (Parasuraman et al., 1985). According to Zeithaml (2000), if several gaps occur because of some shortfalls in service quality, the SERVQUAL model can demonstrate those efficiencies. This SERVQUAL model has five dimensions and these are discussed in the subsequent sub-sections.
8 2.4.1 Tangible
This dimension concentrates on an appearance of the personnel and the kinds of equipment that display the service. Generally it is related to the facilities (Grönroos, 2007). Additionally, firms apply tangibles with the aim of illustrating quality and image (Zeithaml, Bitner & Gremler, 2006). According to Zeithaml et al., (2006) tangible is the appearance of physical facilities, equipment, personnel and communication material and this dimension gives the image or the physical reorientation of the service the customer will use to judge quality. Furthermore, service industries lay high emphasis on tangible as a strategy and the service companies use tangible frequently to boost their image, signal quality to customers and provide continuity. In addition, some company’s employs a strategy of merging tangible dimension to create a service quality strategy (Ibid).
This paper considers two elements (accessory and packaging) for the tangible dimension. Accessories are those small belongings that come with the actual product (Caescu & Dumitru, 2011) and help with the functioning of the products. The lifetime of accessories is low. According to Gilaninia and Moradi (2013), packaging is any enclosure that contains a product that will be offered to the market for sale or by which relevant information about the product is conveyed. Package influences customer attitude in relation to the product. Based on the above, we make the following hypothesis:
H1: Tangibles has a positive impact on customer satisfaction at ATN.
2.4.2 Reliability
This dimension is related to the accuracy of exactly delivering services as promised to the customer (Grönroos, 2007). According to Zeithaml et al. (2006), reliability is one of the most important factors for customers, as it ensures relationship with the organization when promises are kept. Reliability is considered one of the most important dimensions of SERQUAL, and it is defined as the ability to accurately and dependently carry out a particular promised service. In addition, this dimension reflects the company’s ability to fulfill promises to the customer, provide problem resolution, as well as pricing and service provision (Zeithaml et al., 2006). Customers are willing to have transactions with companies that honor their promises, especially promises concerning service outcome and core service attributes. In addition, effectively communicating and delivering on the reliability dimension is extremely important to customers (Ibid). Hence, all firms should
9
be conscious of customer expectations about reliability, as it is vital for firms to position themselves on the reliability dimensions.
Product functioning and on-time delivery are the two elements that represent reliability in this study. Product functionality enables people to engage in useful activities. Innovation in functionality is a set of advantage to the consumer, despite the device in which the innovation is offered, must not itself be new to the market (Ziamou & Ratneshwar, 2003). According to Hsu (2008), it is of great significance to consider on-time delivery and the correctness of order fulfillment in the performance of customer service. Based on the above, we make the following hypothesis:
H2: Reliability has a positive impact on customer satisfaction at ATN.
2.4.3 Responsiveness
According to Grönroos (2007), responsiveness means that the employees of an organization are interested in helping customers solve problems and providing quick service. One of the important factors that companies need to be successful is viewing things from customer’s perspective (Zeithaml et al., 2006). Responsiveness is the willingness to help customers and to provide prompt service. This dimension is about the quickness, attentiveness and the handling customer complaints, problem, question and request (Zeitham et al., 2006). In addition, responsiveness translates to how long the customers have to wait for help, response to their question or attention to their problem. It also encompasses the notion of ability to customize the service to a customer’s requirement. Companies needs to see the process of service delivery from customer’s perspective in order to succeed, instead of viewing it from their own perspective (ibid). However, customers might have a different yard stick for the standard, speed and promptness which could be different from the company’s perspective. Additionally, in order for a company to stand out, it is required for it to have well staffed customer service department and also responsive front line people at all contact positions (Zeitham et al., 2006).
In this study, characteristics of responsiveness are: pre-sales customer service, post-sales customer service, warranty and technical support. Liu and Arnett (2000) suggest that companies should improve information and service quality provided and they should build a service incline concept for both the pre-sales and post sales stages in order to
10
render and high quality service. According to Murthy et al. (2004), warranty is a manufacturer´s guarantee to a buyer that a service or product shall be as represented and it is either implicit or explicit. Additionally, it is a contractual agreement between the manufacturer and buyer upon sale of a service or a product. The objective of warranty is to have liability among the parties involved in a transaction, with the intention of providing greater assurance to buyer. Das (2003) defines technical support as post-sales service rendered to customers of a technological product and this support also includes advice on how a product can be used to its maximum advantage. In addition, technical support can boost the revenue of a firm, as it represents a fascinating system of knowledge and customer assessment of the technical competence of the firm. Based on the above, we make the following hypothesis:
H3: Responsiveness has a positive impact on customer satisfaction at ATN.
2.4.4 Assurance
This dimension is identified as a tool for giving customers confidence via courtesy and adequate knowledge of employee (Grönroos, 2007). In this way a company assures customers that they are in the safe situation. Furthermore, Zeithaml et al. (2006) mentions that this dimension deals with employee knowledge and ability of the firm and how employees inspire trust. Assurance allows a firm to build trust and loyalty between key contact people and individual customers.
In this study, ‘knowledge and skills’ and ‘service assurance’ are characteristics of this SERVQUAL dimension. Punjaisri et al. (2009) claims that ‘Knowledge and skill’ are embedded within the service employee, who renders the brand promise at each service encounter. Given the effect of this characteristic on customer´s perception, a service organization should make sure that employees render the service at the quality level promised by the brand. ‘Service assurance’ is a related concept, which entails the consistency in delivering the brand promised, as human interaction could present the problem unpredictability. Based on the above, we make the following hypothesis:
11 2.4.5 Empathy
According to Grönroos (2007), this component is an important factor since company should have a high level of knowledge regarding its customer’s personal information and what their problems are. Zeithaml et al. (2006) mentions that some organizations consider this factor as a tool and competitive advantage over other companies.
Empathy refers to the individual attention a company delivers it to a customer, by treating each as a special customer (Zeithaml et al., 2006). Response time and Archive data system are characteristics of Empathy in this study. Archive data system refers to the keeping records of customer encounters in order to customize service offerings that match individual needs. Response time is defined in this study as the time taken to physically react to customer enquiry. Service personnel must know the names and preferences of customers and must also create relationships with customers. Based on the above, we make the following hypothesis:
H5: Empathy has a positive impact on customer satisfaction at ATN
2.5 Technical factors
Channel zapping time, repairing of packet loss and quality of services are the main critical factors in satisfying users in IPTV sector (Nasir & Khan, 2014). The following sub-sections provide explanation about these factors.
2.5.1 Quality of service in IPTV sector
In IPTV sector, Quality of Service (QoS) is one of the most important elements necessary for the development of the multimedia application (Oche et al., 2015). QoS is an overwhelming task for most companies and is highly related to novel services according to recent technology (Jang & Noh, 2011). According to Oche et al.(2015), the number of users who connect to the service can affect the QoS, such that when the number of users goes up, the quality of service decreases; thus, influencing customer satisfaction directly. Nasir and Khan (2014) suggests that companies improve QoS by decreasing the congestion of a network. Based on the above, we make the following hypothesis:
12 2.5.2 Channel zapping time in IPTV sector
Channel zapping time (CZT) refers to “the time difference between the time it takes to change a channel by pressing a button on the remote control and the time it takes to display the frame of the requested channel on the TV screen (Dekeris & Narbutaite, 2015). According to Nasir and Khan (2014), it can effect on customer satisfaction negatively, which implies that decreasing channel-zapping time is a principal cause of increasing customer satisfaction in IPTV platform. Channel zapping time refers to the total time required for changing one channel to another. Dekeris and Narbutaite (2015) warns that companies must reduce this time, as it plays a key role in the Internet Protocol Television sector and improving customer satisfaction. Nasir and Khan (2014) claims that the average time required for channel zapping is 3 seconds, however, some companies try to decrease this time to 2 seconds. Based on the above, we make the following hypothesis: H7: channel zapping has a positive impact on customer satisfaction for IPTV.
2.5.3 Packet losses in IPTV sector
Packet loss is one of the most important factors of IPTV, due to its significant effect on the quality of the service (Choi, Silvester & Kim, 2011). Nasir and Khan (2014) claims that packet loss is one of the principal causes for jittering images when using IPTV. This has a negative effect on customer satisfaction. Packet loss includes “frozen frames, retained images and error blocks” for not only picture quality, but also for the sound of a program, as IPTV programs are highly efficient compression processes (Choi et al, 2011). When the traffic congestion in the network increases and data transfer slows down, packet loss will occur (Nasir and Khan, 2014). Furthermore, Zare and Rahbar (2012) consider two difficulties as key factors that lead to packet loss. The first occurs in the “core network” when in the specific network line there is a huge overcrowding and the second happens when service bandwidth is not sufficient. Based on the above, we make the following hypothesis:
H8: Packet loss has a negative impact on customer satisfaction for IPTV. Choi, Silvester & Kim,
2.6 Interaction of functional and technical dimension on customer satisfaction Concerning the interaction between the two dimensions, Lundahl, Vegholm and Silver (2009), explains that while it might seem that a service has been delivered, it may not be
13
entirely true from the perspective of one quality dimension. Keyser and Lariviere (2014) claims that functional quality is the process through which technical quality is transferred to the customer. Lundahl et al. (2009), suggest that the two dimensions have an impact on customer satisfaction. There is very limited literature on the interaction between functional quality and technical quality and this study seeks to fill this gap in the literature. Based on the above, we make the following hypothesis:
H9: The interaction of functional quality and technical quality has a positive impact on customer satisfaction.
14
3. METHODOLOGY
In order to answer the research question, it is necessary to follow a clear and well-structured research approach. Thus, many decisions concerning which theories and concepts to apply, and how to collect the necessary information is discussed in this chapter.
3.1 Method overview
The design, which is adopted for this research, is case study design. This design is usually associated with a specific company in order to collect information. According to (Bryman & Bell, 2011, p. 59) case study design is most often applied in business studies and is very common. Additionally, it is considered for both qualitative and quantitative research. There are different types in this approach: a single organization, a single location, a person and a single event (Ibid). This study used a single organization. There are two types of strategy that writers can adopt to investigate a research question. These strategies are quantitative and qualitative (Bryman & Bell, 2011, p. 26). In addition, inductive and deductive are two types of approaches which researchers can apply when investigating a phenomenon. The deductive approach is based on the theory and make a connection between the theories and hypothesis (Bryman & Bell, 2011, p. 11). This study adopted the quantitative strategy and the deductive approach for investigation.
3.2 Sampling
This study employed convenience sampling. According to Bryman & Bell (2003, p. 105), it is a type of non-probability sampling, whereby participants for a study are not selected randomly. One of the most important advantage of the convenience sampling is, authors insure that the collection of data is much easier to achieve and the questionnaire gets responded (Bryman & Bell, 2003, p. 105). On the other hand, the most significant disadvantage of this sampling is that the convenience sample cannot cover the entire population. A total of 300 customers were contacted to partake in this study. However, only 119 contributed to the study. The response rate for this study was about 40%. Customers of ATN from three countries (Canada, the United State and the United Kingdom) took part in this study.
15 3.3 Data Collection
Before conducting a research some decisions should be considered about collecting data. Whenever there is insufficient information to answer all aspect of a research question, the researchers are required to collect primary data (Christensen, Engdahl, Grääs, & Haglund, 2010). Primary and secondary information are two sources of data which can be used in research (Zikmund et al., 2010). According to Bryman and Bell (2013), quantitative investigation usually require researchers to collect information via questionnaire surveys. Christensen et al. (2010), argued that one of the advantages of primary data compared to secondary data is that, the author is aware of the level of the information’s reliability. This study used primary data, which was collected via self-completion questionnaire using an online survey. The questions in the questionnaire were inspired by the literature on functional quality, technical quality and customer satisfaction. The questionnaire was prepared using an online survey platform of ATN. Next, the link to the questionnaire was sent to the email addresses of customers of the company. There were a total of 23 questions in the survey covering the key concepts of the study. All questions in the survey were closed-ended questions (Bryman & Bell, 2011, p.248) and most responses were designed as Likert-scaled questions. All responses were measure on either an ordinal or nominal scale. The questionnaire was kept as short as possible and had a sequential and logical structure in order to help respondents follow the theme while answering. Please refer to appendix IV for the questionnaire.
3.4 Operationalization of research questions
The following were the concepts in this study: customer satisfaction; functional quality (tangibles, reliability, responsiveness, assurance and empathy); technical quality (quality of service, channel zapping time and packet loss). There were three research questions in this study relating to functional quality, technical quality and the interaction between the two variables. Questions in the survey covered all variables in the study. There were four questions for customer satisfaction, one for tangibles, three for reliability, two for responsiveness, two for assurance, two for empathy, and one question for each variable of technical quality. Please refer to appendix iv, table 27 for how the research questions were operationalized in this study.
16 3.5 Data analysis
There were nine hypotheses in this study. According to Hair et al. (2011) testing of the hypotheses and descriptive statistics are two ways for analyzing quantitative data. This study used the IBM SPSS statistics software to analyze the data collected. Two sets of analyses were carried out. The first was descriptive analysis and was used to summarize the responses of participants in the survey. It allowed the researchers to group responses for each question in order to find percentages of respondents with similar kinds of responses for a variable in the study (i.e tangibles, reliability, etc). The second set of analysis was inferential statistics and the method used was the multiple linear regression analysis. This method allowed for the testing of hypotheses in order to answer the three research questions in the study.
In order to test the hypotheses in this study, Cronbach’s alpha was calculated for variables that were measured with more than one question in the survey. Some items were removed from the battery of questions in order to improve Cronbach’s alpha. For example, pre-sell customer service was removed from the ‘Responsiveness’ variable in order to improve Cronbach’s alpha. Next aggregate scores were found for each variable that had multiple items in the questionnaire. This was done by calculating the average response for all questions that measured the same variable in the study. For example, the variable ‘Tangible’ had three measurement items (packaging, accessories and wrapping) in the questionnaire. The average response for the three items was used for each respondent as the aggregate score for tangible. This was done for all variables of SERVQUAL and Customer satisfaction which were measured with multiple items in the questionnaire. The interaction variable for functional quality and technical factors was computed using the following steps: first, z-scores were found for each variable of function quality and technical quality. Next, the z-scores were added for each group of variables (i.e. functional quality) and an average score was found. Lastly, the product of the two averages for functional quality and technical quality was computed to form the interaction variable.
3.6 Validity and Reliability
Validity and the reliability are of uppermost importance in any research study. Bryman and Bell (2011) acknowledge that validity and reliability are important yardsticks in establishing and assessing the quality of a quantitative research study. Concerning
17
validity, each question in the questionnaire reflected the model that was designed for this study. The questionnaire was designed to obtain information regarding customer satisfaction and it was drafted in two languages (Arabic and English) to ensure that respondents fully understood the questions. Carmines and Zeller (1979) states that reliability is concerned with the tendency towards consistency found in a repeated measurement of the same phenomenon. This implies that a reliable research is easily replicable and would yield the same results. In order to achieve reliability, wordings in the questionnaire were kept simple and clear. The questionnaire was carefully scrutinized by the researchers and marketing staffs at ATN to ensure that the respondents understood the questions.
3.7 Limitation
This study used non-probability sampling as opposed to probability sampling, which is required for generalizing research findings. Another limitation of this study is that a small sample size was used. Secondly, due to the fact that the number of the respondents in the survey were only 119 subscribers of IPTV services, this suggests that the sample was not representative. Moreover, as a result of time limitation, only three technical factors were examined in the study. In the IPTV sector, there are several technical factor that impact customer service. Another limitation concerns the method of data collection, as it is difficult to determine whether respondents were actually customers of ATN.
18 4. FINDINGS
This chapter provides the empirical findings of the study. The findings presented below are from primary data that was collected for this study using methods described in the previous chapter.
4.1 Customer satisfaction
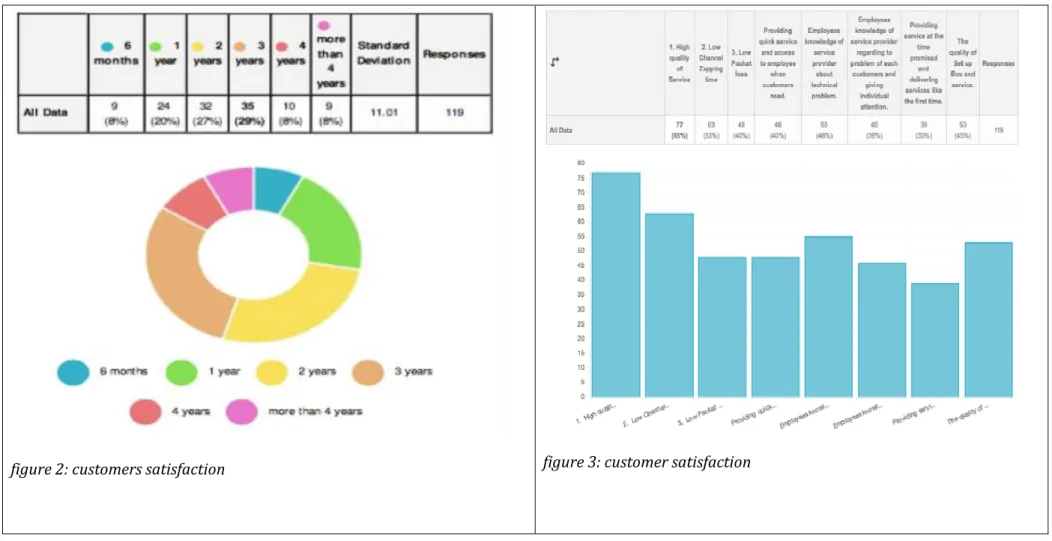
Respondents were asked how long they have been with ATN. Appendix II, figure 2) shows that 29% of the respondents have been customers of ATN for 3 years, 27% have been with the company for 2 years, 20% have been with the company for 1 year, 8 % of the respondents have been with ATN for 6 months, and respondents that has been subscribers for 4 years and more were 8%. The question regarding customer satisfaction were design to ascertain factors that affect your satisfaction. As it can be seen in appendix II, figure 3, the element with the highest score (channel zapping time) was 53%, followed by low packet loss which accounted for 40%. Providing quick service had a score of 40% while employee knowledge of technical problem was 46%. Employee knowledge of specific individual customer scored 39% and prompt service was 33 %.
4.2 Functional Quality
This part provides findings of the 5 dimension of SERVQUAL, which are tangible, reliability, responsiveness, empathy and assurance.
4.2.1 Tangible
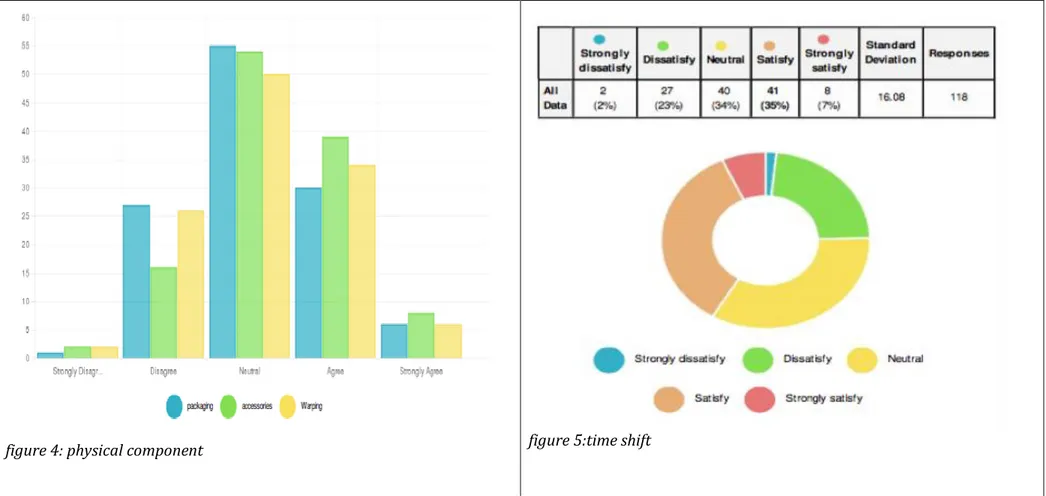
The question that pertains to the tangible dimension deals with the physical component of the product that the respondents use. The respondents were asked if they were satisfied with the physical component of the product which are the packaging, accessories, wrapping to ascertain how these factors affect the service quality of ATN in regards to the tangible aspect of SERVQUAL. As shown in (appendix II, figure 4) 46% of the respondents were neutral, which is the highest score regarding the packaging of the box. 25% of the respondent cared about the packaging of the product. 5% have strong opinion, 23% do not care about the packaging. In relation to wrapping, 42% accept that accessory plays no role in the quality of service they obtain, 33% admit that agree that it play a role, 7% strongly agree that accessory is important in the perceived service quality.
19
13% have the opposing view. In relation to wrapping, 29% holds the view that wrapping is important, 5% strongly agree, 22% disagree and 2% strongly disagree.
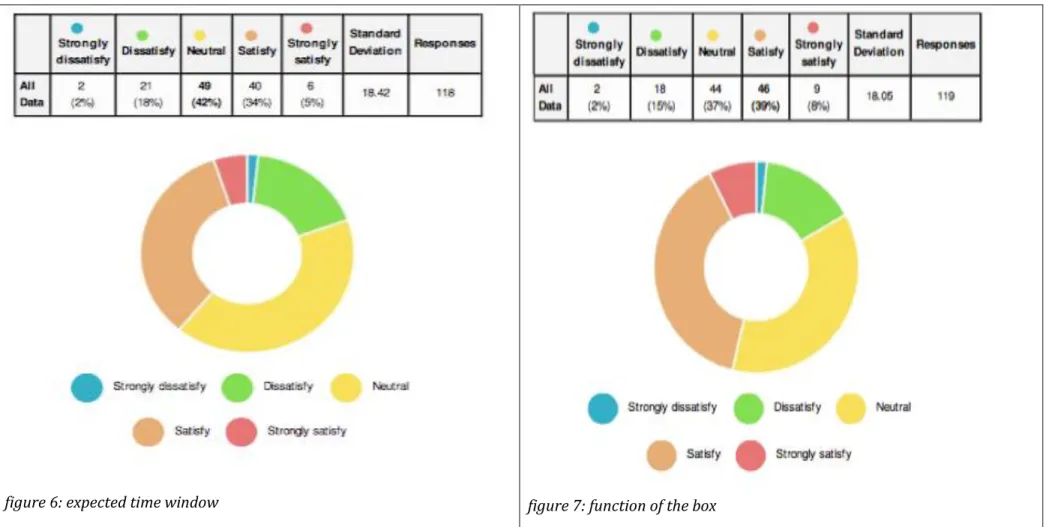
4.2.2 Reliability
Respondents were asked if they were satisfied with time shift feature, as it shown in (appendix II, figure 5), 35% were strongly satisfied, 34% holds no opinion while 23% were dissatisfied, 7% were strongly satisfy. In the next question respondents were asked to rate how satisfied they were with getting order within the same expected time window. As it can be seen in (appendix II, figure 6), High percentage of the respondents were neutral to the question which 42% , 18 % were dissatisfied with the expected time window and 34% satisfied and 5% strongly satisfied. In the last question regarding reliability respondents were asked to rate how satisfied they are with the function of the box. As it can be observed in (appendix II, figure 7) 8% strongly satisfied, 37% were neutral, 39% were satisfied and 2 % strongly dissatisfied.
4.2.3 Responsiveness
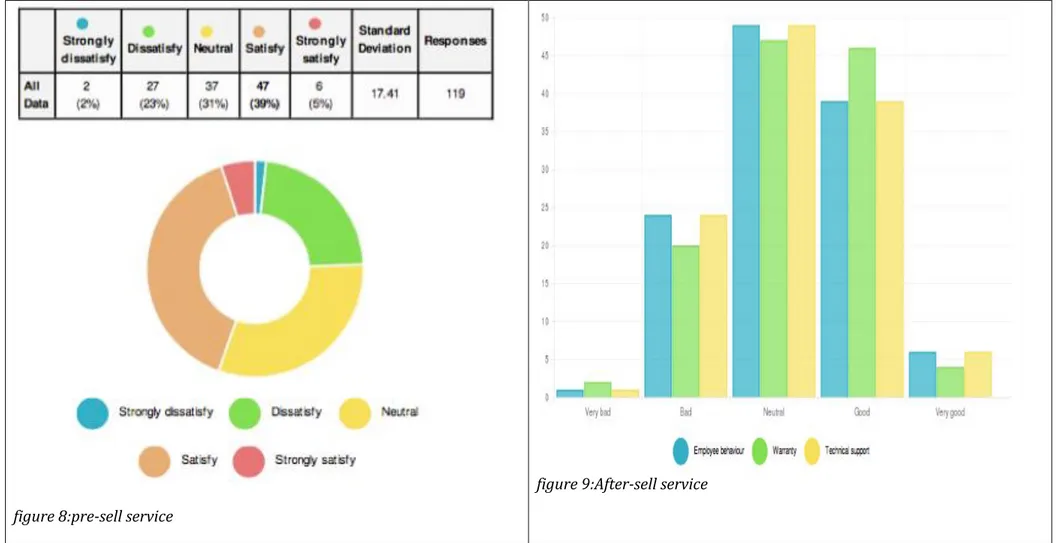
How do you satisfy with the pre-sell customer service? This question pertains to the responsiveness dimension of the SERVQUAL.As it is shown in (appendix II, figure 8) dissatisfied customers are 23% of the total respondent. 5% are strongly satisfied while 39% satisfied and 31% were neutral. Respondents were also asked to evaluate after sell customer service based on 3 aspects: employee behavior, warranty, and technical support. On employee behavior as shown in (appendix II, figure 9) 33% think is good, 5% think is very good,41% holds a neutral position on this question. 20% think is bad and 1% think is very bad. On warranty, 41% hold the view that it is good and 3 % stand by very good. 39% on technical support, 33% of the respondents noted good, 5% very good, 41% were neutral, 20% think is bad and 1% think is very bad.
4.2.4 Empathy
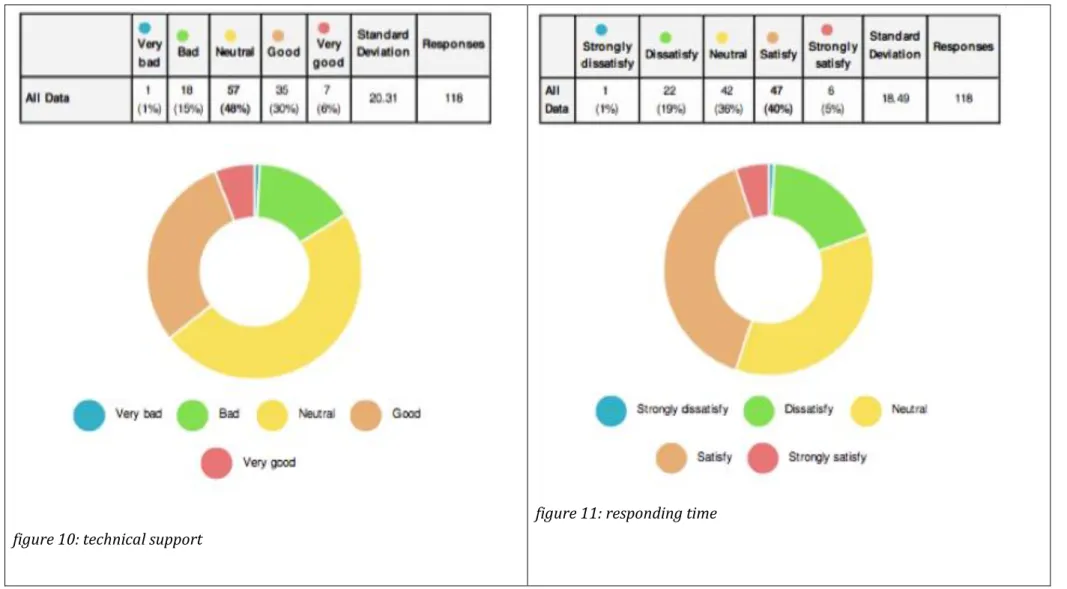
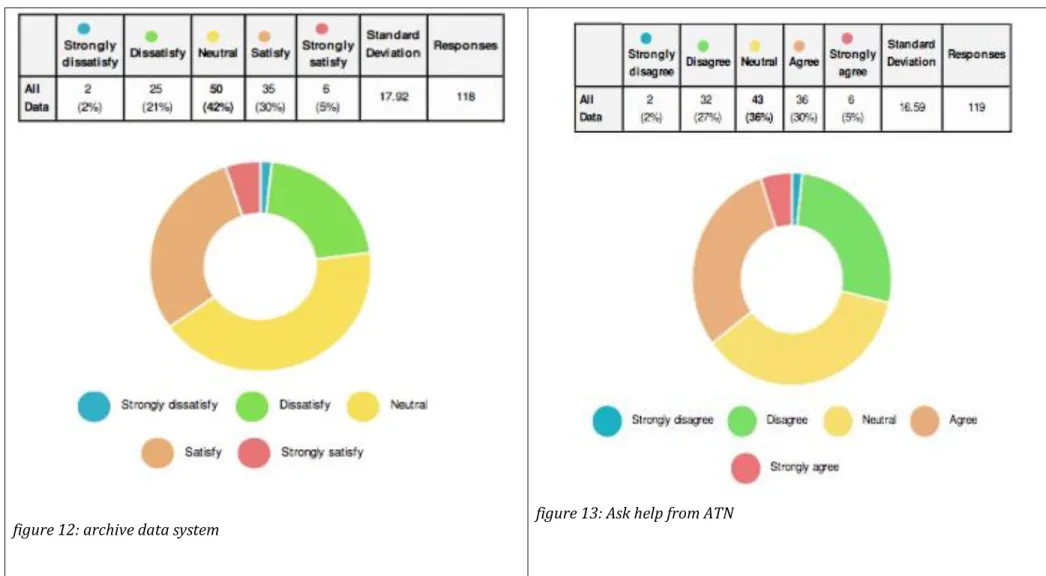
Respondents were asked to evaluate the responding time when contacting the customer service channel. As it can be seen in (appendix II, figure 11) 5% were strongly satisfied, 36% were neutral, 19% were dissatisfied, 40% satisfied. The next question is how satisfied are they with the archive data system of ATN and as it can be observed in (appendix II, figure 12), 30% were satisfied, 5% strongly satisfied, 42% were neutral, 21% were dissatisfied and 2 % were strongly dissatisfied.
20 4.2.5 Assurance
In the next question respondents were asked to evaluate the knowledge and skill of employee in regards to technical support. As it is shown in (appendix II, figure 10) very good scored 6%, 15 %think is bad and 30% think is good. There is a question regarding to the assurance dimension which asked customers about their satisfaction when they ask help from ATN regarding technical problems, As can be seen in the figure 13 in appendix II, 2% of respondents were strongly agree with this assumption, on the other hand 30% of them were agree.27% of the customers were dissatisfied .
4.3 Technical quality
There are three questions pertains to the technical quality, respondents were asked their plan for staying with ATN within one future year because of the technical factors and figure 14 in appendix II illustrate that 9% of the respondents were highly agree with Quality of Service, 3% strongly disagree and 31% were neutral. Regarding to the low channel zapping time, authors have received 8% strongly agree, 46% agree, 2 % strongly disagree and 36% were neutral. The last question is about the low packet loss and statistics show that 5% of the customers were highly agree, 43% agree , 2%were strongly disagree and 38% were neutral.
4.4 Description of research findings by SPSS
Respondents of all age groups participated in the survey. However, the least represented were ’20 and under’ and ’61 and above’ with five participants each. The most represented was the age group ’41 – 50’ with 35 participants, followed by ‘31 – 40’ and ’51 – 60’ with 32 and 28 participants, respectively. There were 67 males and 51 females in the study. Participants were residents of three countries: The United States (49), Canada (36) and The United Kingdom (28).
Research findings for the SERVQUAL variables reveal that most respondents were ‘neutral’ in their evaluation of IPTV. Table 02 shows the average frequency and percentage of respondents who rated the services at ATN. Values were calculated based on the average responses of battery items for each variable. For example, the values for Tangible comprised of the average responses for packaging, accessories and wrapping. For customers who were satisfied or highly satisfied with services at ATN, the highest
21
rating was for Empathy (48.8%), followed by Assurance (42.8%) and Responsiveness with 38.6%. Please refer to appendix I for table 02.
Table 03 in appendix I provide the mean and mode responses of satisfaction for technical factors at ATN. The mean and mode response for Quality of service and Channel zapping time is ‘Agree’. This indicates that a lot of customers at ATN agree the technical factors at the company are good. The mean response for Packet loss was ‘neutral’, while the mode response was ‘Agree’. In table 04 (appendix I), frequency and percentages of respondents are presented for ratings of technical factors of IPTV. The following are the percentages of respondents who are satisfied (agree/ strongly agree) with the technical factors at IPTV: Quality of service (57.1%); Low channel zapping time (53.8%) and Packet loss (47%). The findings show that percentage ratings are around 50% and above, which indicates that a substantial proportion of customers are satisfied with the IPTV service.
4.5 Testing of Hypotheses
This section presents finding of the hypotheses in the study. Two sets of regression analyses were run. The first set assessed the relationship between SERVQUAL variables at ATN and customer satisfaction, while the second evaluated the relationship between Technical factors of IPTV and customer satisfaction. Below are the findings for the first five hypotheses.
4.5.1 Relationship between SERVQUAL variables and customer satisfaction The following are the hypotheses for research question one:
H1: Tangibles has a positive impact on customer satisfaction at ATN. H2: Reliability has a positive impact on customer satisfaction at ATN. H3: Responsiveness has a positive impact on customer satisfaction at ATN. H4: Assurance has a positive impact on customer satisfaction at ATN. H5: Empathy has a positive impact on customer satisfaction at ATN.
Before testing the hypotheses, reliability tests were carried out in order to check for internal consistency in the battery of items that measured variables of functional quality and satisfaction. Tables 05 to 16 in appendix I show the values for Cronbach’s Alpha and statistics of each variable. All values show good internal consistency for the variables, apart for empathy which show an acceptable value for Cronbach’s Alpha.
22
Table 17: Cronbach’s Alphas for variables of functional quality and customer satisfaction
Variable Cronbach’s Alpha
Tangible 0.829 Reliability 0.830 Responsiveness 0.914 Assurance 0.818 Empathy 0.710 Customer satisfaction 0.879
Following the test of internal consistency, the average values of items within a battery was computed as the value for the variable they represent. For example, the average value for packaging, accessories and wrapping was computed to represent the value for Tangible. Next, a multiple linear regression was run to provide findings for the first five hypotheses. Tables 18 to 20 in appendix I present research findings for the hypotheses of research question one.
Results in tables 18 and 19 show that the model is statistically significant [F(5, 92) = 55.077, p-value < 0.000, Adjusted R square = 0.736]. The sample coefficient of determination (R2 = 0.750) shows that 75% of the variation in the dependent variable (customer satisfaction) is explained by the variables of functional quality.
The values for each independent variable in table 20 are as follows:
For H1 (Tangibles) p-value = 0.002 < alpha (α) = 0.05, and a coefficient estimate (β = 0.136). Therefore at the 95% confidence level, we conclude that tangibles has a positive impact on customer satisfaction at ATN.
For H2 (Reliability) p-value = 0.044 < alpha (α) = 0.05, and a coefficient estimate (β = 0.086). Therefore at the 95% confidence level, we conclude that reliability has a positive impact on customer satisfaction at ATN.
For H3 (Responsiveness) p-value = 0.001 < alpha (α) = 0.05, and a coefficient estimate (β = 0.122). Therefore at the 95% confidence level, we conclude that responsiveness has a positive impact on customer satisfaction at ATN.
23
For H4 (Assurance) p-value = 0.003 < alpha (α) = 0.05, and a coefficient estimate (β = 0.127). Therefore at the 95% confidence level, we conclude that assurance has a positive impact on customer satisfaction at ATN.
For H5 (Empathy) p-value = 0.824 > alpha (α) = 0.05, and a coefficient estimate (β = 0.010). Therefore at the 95% confidence level, we conclude that empathy has no impact on customer satisfaction at ATN.
To conclude, for the five SERVQUAL variables, only ‘Empathy’ has no effect on customer satisfaction at ATN.
4.5.2 Relationship between Technical factors and customer satisfaction The following are the hypotheses for research question two:
H6: Quality of service has a positive impact on customer satisfaction for IPTV. H7: Low channel zapping has a positive impact on customer satisfaction for IPTV. H8: Packet loss and delay has a negative impact on customer satisfaction for IPTV.
One question was used for each variable of technical factor. A multiple linear regression was run to provide findings for the three hypotheses. Tables 21 to 23 in appendix I present research findings for the hypotheses of research question two.
Results in tables 21 and 22 show that the model is statistically significant [F(3, 98) = 28.048, p-value < 0.000, Adjusted R square = 0.445]. The sample coefficient of determination (R2 = 0.462) shows that 46% of the variation in the dependent variable (customer satisfaction) is explained by the variables of technical quality.
The values for each independent variable in table 23 are as follows:
For H6 (Quality of service) p-value = 0.001 < alpha (α) = 0.05, and a coefficient estimate (β = 0.165). Therefore at the 95% confidence level, we conclude that Quality of service has a positive impact on customer satisfaction at ATN.
For H7 (Channel zapping time) p-value = 0.853 > alpha (α) = 0.05, and a coefficient estimate (β = -0.010). Therefore at the 95% confidence level, we conclude that Channel zapping time has no impact on customer satisfaction at ATN.
24
For H8 (Packet loss) p-value = 0.007 < alpha (α) = 0.05, and a coefficient estimate (β = 0.154). Therefore at the 95% confidence level, we conclude that Packet loss does not have a negative impact on customer satisfaction. Unexpectedly, research results revealed a positive impact for Packet loss on customer satisfaction.
4.5.3 Interaction of functional quality and technical factors on customer satisfaction
The interaction variable for functional quality and technical factors was computed using the following steps: first, z-scores were found for each variable of function quality and technical quality. Next, the z-scores were added for each group of variables (i.e. functional quality) and an average score was found. Lastly, the product of the two averages for functional quality and technical quality was computed to form the interaction variable.
The hypotheses for research question three is as follow:
H9: The interaction of functional quality and technical quality has a positive impact on customer satisfaction.
A multiple linear regression was run to provide findings for the hypothesis. While the product of the average z-scores for variables of functional quality and technical quality was used in the model as the interaction term, the average values of the original variables were used for function quality and technical quality. Tables 24 to 26 in appendix I present research findings for the hypothesis of research question three.
Results in tables 24 and 25 show that the model is statistically significant [F(3, 91) = 87.532, p-value < 0.000, Adjusted R square = 0.734]. The sample coefficient of determination (R2 = 0.743) shows that 74% of the variation in the dependent variable (customer satisfaction) is explained by the interaction of functional quality and technical factors. Table 26 provide findings for H9 (Interaction of functional quality and technical factors): p-value = 0.152 > alpha (α) = 0.05, and a coefficient estimate (β = 0.029). Therefore at the 95% confidence level, we conclude that the interaction of functional quality and technical factors has no impact on customer satisfaction at ATN.
25 5. DISCUSSION:
In this chapter results of the empirical findings are discussed in connection with the theoretical framework as presented in the second chapter of this study.
5.1 Customer Satisfaction
Chinomona and Dubihlela (2014) argued that customer satisfaction consists of a variety of characteristics, which can meet the expectation of customers positively. In addition, features that are poor, including low quality and service, can lead customers to be dissatisfied. When customers are confronted with unpleasant service or product, they often switch to another company. The empirical data obtained in regards to customer satisfaction shows the various time periods that respondents had been customers at ATN. About 29% of the respondent have been a customer for 3 years, which is the highest score. This score indicates that a fairly large number of ATN customers are satisfied with the company.
5.2 Functional factors
5.2.1 Tangible
In this study, tangible was found to have a positive effect on customer satisfaction. Zeithaml et al. (2006) claim that tangible is the appearance of physical facilities, equipment, personnel and communication material and this dimension gives the image or the physical reorientation of the service that the customer will use to judge quality. In this study, there are three characteristics for tangible: packaging, accessories and wrapping. According to (Gilaninia et al., 2013), packaging influence customer attitude in relation to product. Caescu and Dumitru (2011) also mention that accessories help the functioning of the products. Findings of this study suggest that customers of ATN are pleased with the physical facilities and equipment at the company. This is supported by the fact that 25% of respondents were satisfied with the packaging of the product. In addition. Research finding illustrate that percentages were also high for accessories (33%) and (29%) for wrapping, which suggests that customers are satisfied with this factor.
26 5.2.2 Reliability
Results show that reliability has a positive on customer satisfaction. According to Zeithaml et al. (2006), reliability is one of the most important factors for customers since it is momentous for them to keep their relationship with the organization. Reliability was represented as two characteristics in this study: product functioning and on-time delivery. Ziamou and Ratneshwar (2003) argue that product functionality enables people to engage in useful activities, so it can be argued that in this case customers are satisfied with this factor, since 39% of them were satisfied. Hsu, (2008) also mentions that it is of great significance to consider on-time delivery and the correctness of order fulfillment in the performance of customer service. Findings revealed that time-shift feature and expected time window achieved respectively 35% and 34%. This implies that more than one third of the customers are satisfied with these characteristics at ATN
5.2.3 Responsiveness
In this study there is statistical evidences that responsiveness has an impact on customer satisfaction. According to the Zeitham et al. (2006), responsiveness is the willingness to help customers and to provide prompt service. This dimension is about the quickness and attentiveness of handling customer complaints, problems, questions and requests. In addition, responsiveness translates to how long the customers have to wait for help, response to their questions or attention to their problems. It also encompasses the notion of ability to customize the service to a customer’s requirements. As mentioned before in the theoretical framework researchers consider pre- and post-sales, warranty and technical support at ATN as characteristics of responsiveness. Liu and Arnett (2000) argued that a company should improve information and service quality for both pre-sales and after-sales stages in order to render a high quality service and high information quality. Findings indicate that customers are satisfied with the characteristics of responsiveness at ATN. This indicates that the company is effective in it performance regarding responsiveness.
The next factor which researcher examine is warranty, Murthy et al.(2009) argued that the objective of warranty is to have liability among the parties involved in a transaction, with the intention of providing greater assurance to buyer; however, findings illustrate that 39% of the respondents are satisfied by this factors, so it is obvious that ATN considers proper warranty for customers. The last characteristic for responsiveness is technical support, which according to Das (2003) represent a fascinating system of
27
knowledge and customer assessment of the technical support. This factor is highly influenced by the resolution time of the reported problem, and according to research findings, these characteristics meet the satisfaction of customers at ATN.
5.2.4 Empathy
In this study Empathy was found to have no effect on customer satisfaction. Empathy refers to the individual attention a company delivers to customers by treating each as a special customer (Zeithaml et al., 2006). According to Grönroos (2007), this component is an important factor and a company should have a high level of knowledge regarding its customer’s personal information and what their problems are. Within this research it is emerged that the archive data achieved average ratings amongst customers of ATN. While it shows that customers of ATN are not dissatisfied with how employees at ATN use the data of customers, they also means that employees do not seem to have adequate knowledge of customers’ problems.
5.2.5 Assurance
As findings show Assurance has positive influence on the customer satisfaction. Zeithaml et al. (2006) mentions that this dimension deals with employee knowledge and ability of the firm and how employees inspire trust. Assurance allows a firm to build trust and loyalty between key contact people and individual customers. According to this theory and the evidence, which showed 30% of the respondents were satisfied with the service employee regarding the solving of technical problems. This implies that performance of the ATN due to the technical knowledge of employee is appropriate.
5.3 Technical quality
According to the findings Channel zapping time has no impact on customer satisfaction. On the other hand, packet loss and quality of service have a positive impact on customer satisfaction. Dekeris and Narbutaite (2015), argued that one of the most important factors, which play a key role in Internet Protocol Television and in improving customer satisfaction is reducing channel zapping time. As can be seen in evidence, 36% of the customers were neutral. According to the findings, customers are not satisfied with this characteristic. The next factor which influence customer satisfaction positively in this case is packet loss which Nasir and Khan (2014), argued that when the traffic congestion in the network increases and data transfer slows down, packet loss will occur, in this
28
situation customer satisfaction affect in a negative way by Packet loss. As it is shown in findings, 43% of respondents were satisfied; therefore, authors believe that the rate of data transfer is high at ATN. The last factor which has a positive effect on customer satisfaction is Quality of service. According to Oche et al. (2015), the number of users who connect to the service can affect the QoS, such that when the number of users goes up, the quality of service decreases; thus, influencing customer satisfaction directly. As it can be seen in the findings 48% of the customers were satisfied with the quality of service and researchers argued that the congestion of the network at ATN is low.
5.4 Interaction of functional quality and technical factors on customer satisfaction
In this study, interaction between functional and technical factors was found to have no impact on customer satisfaction. Keyser and Lariviere (2014) claims that functional quality is the process through which technical quality is transferred to the customer. In addition Lundahl.et al. (2009), suggest that the two dimensions have an impact on customer satisfaction; however, statistical findings show that the interaction between these two dimensions does not influence customer satisfaction. Even though in this study it was found that functional quality and technical quality both have some impact on customer satisfaction, it can be said that when both factors are combined there is no effect on customer satisfaction. One reason for this finding could be the small sample size that was used in this study. Nonetheless, the very limited literature on the interaction of functional quality and technical quality on customer satisfaction, does not allow for an adequate discussion of this finding.