Postadress: Besöksadress: Telefon:
Box 1026 Gjuterigatan 5 036-‐10 10 00 (vx)
551 11 Jönköping
A colorful department isn’t always good:
improvements at Novaprint.
Federica Distefano
EXAM WORK 2013
Production Systems
Postadress: Besöksadress: Telefon:
Box 1026 Gjuterigatan 5 036-‐10 10 00 (vx)
551 11 Jönköping
A colorful department isn’t always good:
improvements at Novaprint.
Federica Distefano
This exam work has been carried out at the School of Engineering in Jönköping in the subject area of Production Development and Management. The work is a part of the two-year university diploma of the Master of Science program within the field of engineering.
The authors take full responsibility for opinions, conclusions and findings presented.
Examiner: Glenn Johansson Supervisor: Johan Karltun
Scope: 30 credits (second cycle) Date: 2013-06-03
First of all I would like to thank my supervisor Johan Karltun for his guidance and availability along this master thesis.
I would like to thank my classmates who supported me during those two-year program and with who I spent a good time inside and outside the university. In the end, I want to say a big thank to my boyfriend and my family for their motivational support.
Abstract
Today, the competition between companies are very strong and fighted. In particular, small-medium size companies (SMEs) need to upgrade continuously in order to be in line with new technologies and new strategies that tends to develop companies in terms of productivity and quality.
SMEs need, indeed, to be always competitive in a changeable market and to achieve competitive advantage through implementation of new technologies and theoretical methods or techniques. The implementation of those methods leads the company to increase its level of productivity and quality in order to achieve a competitive place within the market.
The Gunasekaran framework is a tool which is useful in order to achieve a higher level of productivity and quality within a SME. This framework was studied and analyzed in order to be applied in a real life situation.
This research focuses on the application of the same framework in a Mexican small company with the aim to develop and increase the level of productivity and quality of one department.
Within the application of this framework, were applied the main concepts explained by the same Gunasekaran and they were analyzed in order to understand if a possible application could be useful to achieve success within the department.
Keywords
Gunasekaran, Productivity, Quality, Action Research, 5S strategy, JIT, ABM, Hoshin Kanri, Inventory Control Management.
Contents
1 Introduction ... 6
1.1 BACKGROUND ... 6
1.2 AIM AND RESEARCH QUESTIONS ... 10
1.3 DELIMITATIONS ... 10 1.4 OUTLINE ... 10 2 Theoretical background ... 12 2.1 JUST IN TIME ... 14 2.1.1 JIT process ... 15 2.1.2 Material Management ... 17
2.1.3 Safety stock and Inventories ... 19
2.2 5S ... 20 2.2.1 Sort ... 21 2.2.2 Set in order ... 21 2.2.3 Shine ... 22 2.2.4 Standardize ... 22 2.2.5 Sustain ... 23
2.3 ACTIVITY-BASED MANAGEMENT ... 23
2.4 HOSHIN EXERCISE ... 24
3 Method and implementation ... 27
3.1 WHAT’S A RESEARCH? ... 27
3.2 CASE STUDY AND ACTION RESEARCH ... 27
3.3 COLLECTION OF DATA ... 29
3.3.1 Collection of theoretical data ... 29
3.3.2 Collection of Empirical data ... 29
3.4 GANTT CHART ... 31
3.5 VALIDITY AND RELIABILITY ... 32
4 Findings and analysis ... 33
4.1 COMPANY BACKGROUND ... 33
4.2 COMPANY PRODUCTION PROCESSES ... 33
4.2.1 Production Departments ... 34
4.2.2 The principal warehouse ... 35
4.2.3 The final production line ... 35
4.3 PAINT DEPARTMENT ... 35
4.3.1 Paint Department Processes ... 37
4.3.2 Activities process ... 38
4.3.3 Inventory Management and control ... 41
4.3.4 Paint Production Processes ... 42
4.3.5 Warehouse system development ... 46
5 Discussion and conclusions ... 50
5.1 IMPLEMENTED METHOD ... 50
5.2 FINDINGS AND IMPROVEMENTS ... 50
5.3 FUTURE RESEARCH ... 53
6 References ... 54
7 Appendices ... 56
7.2 INTERVIEW WITH THE WORKER WITHIN THE PAINT DEPARTMENT ... 57
7.3 PROCESS FLOW CHART ... 58
7.4 ORGANOGRAM ... 59
1 Introduction
Small and medium-size enterprises (SMEs) are considered as a major component of all the economies and they are known as the “life blood of modern economies” (Ghobadian & Gallear, 1995). In general, these companies are considered flexible and adaptive organizations and they are famous for their ability to innovate and change. Indeed, innovation and change is a need for those enterprises in order to develop their management and their productivity (Gunasekaran et al.(2000).
Ghobadian & Gallear (1995) stated that the globalization of markets developed the interrelation between the economies and changed the international environment, which is increasing its competitiveness. For these reasons the SMEs need to make important changes and improvements regarding their operations, in order to survive to the variations of a competitive environment.
The amount of investment that companies need, to make changes and improvements, is the main limitation for SMEs. While large companies are capable to invest big amount of capital to develop their systems, SMEs possess limited capital, manpower and resources to make a change. That’s the reason why those companies need “tools” that require limited budgets and that can be implemented quickly and with a little use of resources. (Shing, 1997)
Maranto-Vargas & Gòmez-Tagle Rangel (2005) carried out a study based on the development of capabilities and resources of SMEs in Mexico in an increasingly competitive environment. They considered 55 SMEs located in Central Mexico as a sample and they found that most of the firms increased their level of competitiveness through using a combination of tangible and intangible assets. The firms that had developed strategies and techniques for continuous improvement, innovation and change and development of capabilities, increased the level of their competitive advantages very fast and they reached better profits, productivity level, quality level and other financial goals.
1.1 Background
In order to compete in international markets and increase their competitiveness, SMEs can utilize different productivity and quality improvement strategies or methods. In this study a conceptual model, which is aimed to improve the operation in SMEs, is presented and tested in a specific case. The model is known as the “Gunasekaran framework” and it suggests strategies and methods that contribute to the improvement of the operations in a SME.
The Gunasekaran framework provides an example of how a small company can improve its productivity and quality with limited resources and budget. Indeed, the strategies described within the framework need only a small investment but they also require a deep change regarding the traditional way of working. Gunasekaran et al. (2000) conducted their study in a small company (Valeo) and they implemented the strategies and method described within the framework. (Gunasekaran et al., 2000). The study experimented the effectiveness of this framework in a SME, since it was implemented in a real-life situation, and this is the main reason why this framework was chosen in the project company.
The project highlighted two important types of work: the theoretical and the practical work.
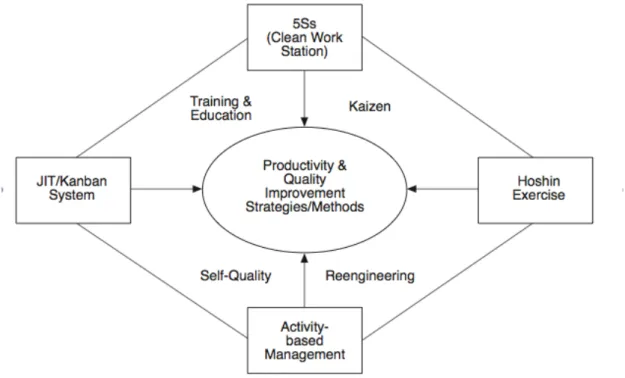
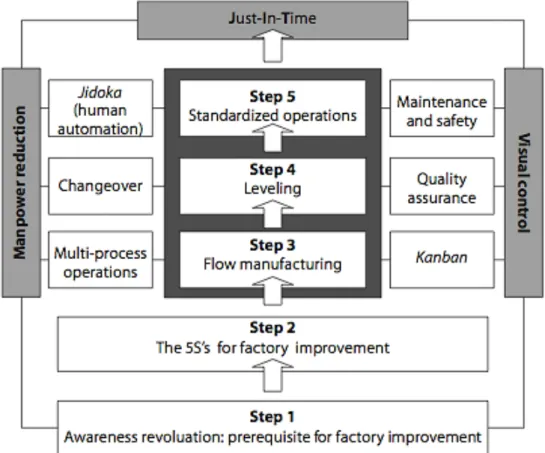
The theoretical work was based on an analysis of the framework by Gunasekaran, which suggests the main methods to apply in a SME in order to develop its productivity and quality. Before choosing this framework, other models were studied and analysed but Gunasekaran framework resulted the most appropriate because it includes successful strategies and methods which allow to develop the processes within a SME. Those methods and strategies are presented in figure 1.1:
Figure 1.1: Gunasekaran framework (Gunasekaran et al., 2000).
As can be seen in figure 1.1, the main methods suggested to improve productivity and quality in SMEs are:
• Just-in time; • 5S Strategy; • Hoshin Kanri;
• Activity-Based Management.
Just-in time is a method that developed in Japan first and then it spread all over the world. The principal goal of JIT philosophy is the achievement of zero inventories of raw materials, WIP products and final products. To maintain the level of inventory at zero results sometime is difficult and unreachable for many companies since there is always a big amount of raw material stoked in the warehouse to prevent any issues such us inaccurate forecasting, machine breakdown etc… That makes JIT method and ideal state. Sometimes companies cannot reach it because of some conditions that do not fit with the ideal state. However, JIT is a method used today by a large amount of companies since it reduces different costs within a company such us scrap, rework on repair, warranty, inspection and design modification. (Hutchins, 1999)
5S system aim is to create discipline, make everything cleaner and well-ordered within a workplace. For instance many workplaces in today’s companies present issues of waste and disorganized or unplaced WIPs. All those issues lead the organization in problems such us: long lead-times, low level of productivity, high operation cost, rework, late deliveries, safety issues and ergonomics challenges. 5S system is based on avoiding all those issues and develop the system make it sorted, in order, shined, standardized and sustainable.
All these techniques contribute to help SMEs to increase productivity and quality, to make the job tasks easier for the worker, to develop their production process system. (Chapman, 2005)
Hoshin Kanri (HK) is a method, born in Japan, that regards quality planning and management.
The Hoshin Process presented by Jolayemi (2008) is shown as a flow chart of seven steps of Hoshin planning and management (HPM). Those steps are:
1. Establish organization Vision 2. Develop 3-5 year plan
3. Develop annual objectives
4. Deployment/Roll Down to Depts. To develop plans including targets and means
5. Implementation
6. Regular Progress review 7. Annual Review
HK is so a quality planning and management tool but it also represents a quality strategic planning and management system. HK focuses on the PDCA cycle (Plan, Do, Check, Act), which is a very popular method that controls the processes and the implementation of improvements or changes. HK helps to identify the activities within the organization as micro activities (activities in different departments within the whole company) and try to fix problems and issues that concern each small department. It is based on the concept that big problems are caused by many small problems and there is the need to focus on those problems from the bottom of the organization. (Jolayemi, 2008)
Activity Based Management (ABM) is a method that identifies and evaluates activities that are carried out within a firm. It helps to manage activities and business processes in order to achieve organizational objectives, reduce costs and non-value resources. Moreover it assists in creating performance measures for cost, time, quality, output in the way that everyone within the company can understand what’s going on within the company and so that they can contribute to achieve the company goals. Activity Based Costing (ABC) is closely related with ABM and it is a method that assigns costs in a different way from the traditional cost allocation. With the ABC method, costs are assigned depending on the activities (planning, engineering, manufacturing etc…) which are associated with specific products or services. (Alabbadi & Areiqat, 2010)
Other 4 concepts are related with these 4 methods and help the companies to implement them. Those concepts shown by Gunasekaran are Kaizen, Reengineering, Self Quality and Education/training. Those concepts help the company to implement the techniques listed before and they support them in order to help the company to achieve competitive advantage after its changes and improvements.
It is important to integrate the practical and the theoretical work within the project. The main methods that are included in the Gunasekaran framework were used and applied in a SME in Mexico. This company is called Novaprint and the implementation of the Gunasekaran framewok was done within the Paint Department in order to develop its productivity and quality. This department needed to be improved because it hadn’t grown like the other departments within the company. The department worked with a poor planning system, long lead-times and a poor inventory management system. In fact, the department had problems with an unreliable inventory control system, without any form of stock tracing and a high level of inventory obsolescence. The development of this department was very important because it contributed to improve the coordination between the other departments and a development of the whole company regarding productivity and quality.
1.2 Aim and research questions
The aim of the project is to use the framework defined by Gunasekaran et al.(2000) with the strategies and methods described and test the implementation of them in a specific case. This specific case was represented by the Paint Department within the company of Novaprint. The most suitable strategies and methods described in the framework were implemented within this department. The research questions, listed below, are organized based on the phase of the project and the research.
• RQ1: How can the improvement strategies and methods in the model of Gunasekaran be used in order to bring appropriate results in a SME? • RQ2: What results were reached concerning quality and productivity within
the paint department of Novaprint?
Those research questions are answered within the report in order to satisfy the aims of the project.
1.3 Delimitations
Since the framework contains different strategies and techniques that can be regarded as very extensive to describe and focus on, the report doesn’t go in deep about those topics but is limited to underline the facts that are related to the company issues. For instance one of the topic that will be used is JIT that can be seen as an envelope in a wider topic or philosophy which is lean thinking. The project will thus not cover such a wide topic but the limitation is to focus just on the methods presented, which are parts of the entire topic. Moreover, concerning the company, the change process and the implementation of those changes and improvements regarded just the paint department (a small part of the company) since the project was basically focused on that. However, the theoretical support and the methods explained can also be used for others departments or for a wider vision of the whole company.
1.4 Outline
The following chapters within the report are:
Chapter 2: Theoretical Background
In this chapter, a literature review is presented. The Gunasekaran framework is further elaborated and all the methods that concern the framework are highlighted. After that, each method is described with the most used and important concepts.
This chapter highlights the method used to write this thesis and, more in general, to carry out the project. The research approach is explained in terms of how the researcher carried out the project collecting both theoretical and empirical data. In particular, how all the types of data used in the project were analyzed and described.
Chapter 4: Findings and Analysis
In this chapter a description of the company and its processes is carried out by the use of an appropriate collection of data. Then the main issues are described carefully and theoretical methods (by Gunasekaran framework) are applied to those issues in order to develop them.
Chapter 5: Discussion and Conclusion
In this chapter the results of the previous analysis and the implemented improvements are discussed and related to other findings. In the end a conclusion is made and the academic contribution of this project is analyzed.
Chapter 6: References
In this chapter a list of references used within the project is made.
Chapter 7: Search Terms
In this chapter a list of the most used terms within the report is made.
Chapter 8: Appendices
2 Theoretical background
After the major economic crisis in the 1970s, SMEs started to be considered very important within the market. In fact, those companies have proved that they could be successful, like large companies, and achieve competitive advantage. In general SMEs are different from large companies for several reasons. Firstly SMEs are considered to be organic and the main characteristic of an organic organization is the presence of informal work relationships and the lack of standardization . The division of activities is limited and unclear since there are not formal rules and procedures. Usually, there is a difficulty in the coordination between the various departments and the structure is very centralized with low level of responsibility division. The top management, moreover, has the opportunity to build strong relationships with the employees but interpersonal conflicts can also increase (Ghobadian & Gallear, 1995).
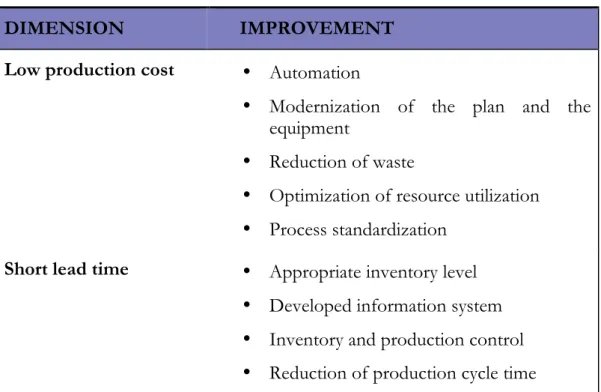
According to Negron (2009), during the last few years, companies went through a strong technological development and they adopted new tools that contributed to develop companies’ production systems. Those new tools, such us JIT, process reengineering, total quality and others, contributed to an impressively development of operational efficiency within the SMEs. In order to make the production system more efficient, it is necessary to consider different dimensions and measure the level of efficacy within each one. Those dimensions and the relative tools or improvements are showed in table 2.1:
Table 2.1: Competitive dimensions of a production system (Negron, 2009).
DIMENSION IMPROVEMENT Low production cost • Automation
• Modernization of the plan and the equipment
• Reduction of waste
• Optimization of resource utilization • Process standardization
Short lead time • Appropriate inventory level
• Developed information system • Inventory and production control • Reduction of production cycle time
High level of quality • Better quality control system
• Employees education and training • Problem solving teams
• Supplier system development
Innovation and
flexibility • CAD/CAM system
• Layout development
• Development of a “pull system”
The dimensions and the relative improvements described in table 2.1, are included in new methods and strategies that need to be implemented within SMEs in order to make the company operation more efficient. Some of those methods/strategies were described by Gunasekaran et al. (2000), who developed a conceptual model that can help SMEs to improve their productivity and quality. It contains the most used strategies and methods that could be implemented in SMEs in order to gain productivity and quality improvements.
Figure 2.1: Gunasekaran framework (Gunasekaran et al., 2000).
As it can be seen in the model, the main strategy and methods that could be used to improve productivity in SMEs are: JIT(Just-in-Time), 5Ss (sweep, sort, spotless, standardize and step), Hoshin exercise and Activity-Based Management.
2.1 Just In Time
According to Hirano (1988) the real power of Japanese industry were the small firms and subcontractors known as “shitauke”, even if when thinking about Japan the names that come to our mind are “Toyota” or “Matsushita”. Of those small-medium companies, about 200 (90% of subcontractors) contributed in a project called “JIT Factory Revolution” aimed to develop a new concept of production system. The conventional description of “just-in-time” (JIT) is defined as a system that distribute products that are needed, when it is needed and with the right quantity (Hirano, 1988).
During the first years of the Japanese industrial revolution, it was said that “manufacturing is the business of making things” since there was a lack of raw materials and anyone who could get those materials, also could make products and sell them. Successful manufacturers were thus those that had access to raw materials. Today things are changed, since globalization and international exchanges have made raw materials accessible to anyone all over the world. This means that the market of manufacturing products became more competitive and manufacturers need to make big changes in their way of thinking in order to become more competitive and achieve success. For these reasons it is important to hypothesize that “manufacturing is a service industry” (Hirano, 1990).
To achieve and maintain their competitive advantage, firms focus in strategies that reflect the issues of their system and address any kind of problem within the factory. Developing a manufacturing strategy consists of two phases: set-up the goals and achieve those goals. It is important to underline that strategic decisions affect not only the company, but also its suppliers, materials management, level of automation and customers. Those are the critical operation areas and they need to be well prepared, planned and coordinated to render the manufacturing strategy useful. One of those strategies is the Just-in-time strategy, which is a wide strategy that affects operation of many departments within the company. (Hernandez, 1989).
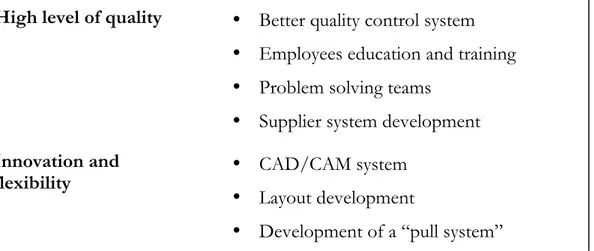
Hirano (1990) shows an approach that was used in many companies and which is called “the PQCDS approach”. It is a service-oriented approach that focuses on:
• Diversification of Products since customers want a wider variety of products within the market;
• High level of Quality; • Low level of Costs;
• Faster Deliveries in the way that firms try to replace stocked products as soon as they are sold to the customer with short delivery schedules;
Figure 2.2: The PQCDS approach (Hirano, 1990)
In few words, the PQCDS approach helps manufacturers to produce desired products (P) of high level of quality (Q), with low cost (C), fast deliveries (D) and guaranteed safety (S).
2.1.1 JIT process
According to Hirano (1990), implementing a JIT system means also change the old production methods into JIT production methods. While traditional production methods are inductive (based on current conditions) and based on statistical data, JIT production uses a deductive approach that leads the company towards a goal of an ideal system.
Figure 2.3 shows the 5 principal steps that a company needs to adopt in order to implement a JIT production system.
Figure 2.3: Steps to follow in a JIT system implementation (Hirano, 1990)
The first step represent the base of this process since a JIT system is not possible to implement if everyone within the company and also outside (suppliers, customers etc.) are not aware of this revolution and participate in the innovation. Obviously it is important that anyone within the company take part of the innovation, including the workers at the bottom of the organization, but the best place to start is at the top management of the whole organization (Hirano, 1990). According to Hirano (1989), there are 5 important points to follow in order to cast aside the traditional way of thinking and change it to a JIT way of thinking:
• Assume that the current system is not working well;
• The top manager needs to change his way of thinking since he’s the leader of this revolution;
• All the executives and supervisors have to work hard to strengthen the working areas;
• Workers have to learn new methods through training meetings and learning seminars;
• Keep clear the policy and the principles since any change or revolution cause resistance.
Moreover, Hirano (1989) highlighted 10 development principles to follow: 1. Turn down traditional concepts about manufacturing methods; 2. Think about how new methods will work;
3. New methods are totally against the “status quo”; 4. Don’t look for perfection;
5. Adjust errors where they are found;
6. Don’t invest lots of money for the improvement; 7. Problems will give the possibility to use intelligence; 8. Ask “why” for five times (5W rule);
9. Ideas from ten people is always better that just one person idea; 10. Improvements do not have limits.
The second step is following the 5S philosophy that highlights 5 basic principles to adopt in order to implement a JIT system. Those principles are represented by 5 words that begin with “S”. The 5S are: method arrangement (seiri), orderliness (seiton), cleanliness (seiso), clean-up (seiketsu) and discipline (shitsuke) (Hirano, 1990), see section 2.2.
The third step is about manufacturing flow that, according to Hirano (1990), means “bring the factory’s underlying waste to the surface”. For instance, big batch production tends to hide waste while flow manufacturing reveals it. Manufacturing flow process is based on handling the production piece by piece. It is important to study how the product is made during the manufacturing process in order to detect the bottlenecks, which can cause issues in the product flow. The fourth step is about leveling the production in the way that it will be as close as possible to the customer demand. To achieve this the company needs to reduce the inventory level to zero. Reducing the inventory level leads the company to decrease warehouse costs, and at the same time, the company can offer a high level of diversification and shorter lead-times. (Hirano, 1990)
The fifth and last step regards the ability to standardize the operations. According to Hirano (1989), “Standard operations are rules and methods to safely produce products of high quality at a low cost through an efficient organization of people, products and machines.” According to Hirano (1990), standard operations are standards that join to a series of standard operating procedures (SOPs) into a specific order to build a product.
2.1.2 Material Management
To understand the JIT system it is important focus on the difference between two types of system:
• Push System • Pull System
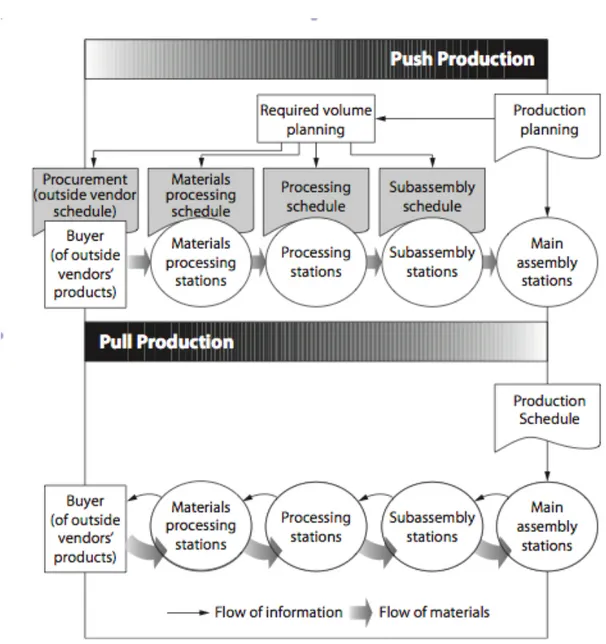
Figure 2.4: Information and material flow in Push and Pull Production system (Hirano,
1990)
Both systems are about how to move materials within a factory. Companies that adopt push systems, use material requirement planning (MRP) to handle their production flow and control the material movement throughout a factory. In a push system, the production planning sends the information of required volume planned directly to the various stations. One issue that regards the “push” system is the risk of high level of inventories. This happens because the forecasts are uncertain and the “push system” does not produce based on customer orders. Usually, a “push system” produces more than just what the customer requests. This excess of products is converted into inventories.
In a pull system the customer request drive the flow throughout the process. In this type of system the production line will handle only the material requested to meet the customer demand and if a problem will show up during the production, all the process will stop itself. In this way the excess material produced will be less than in a push system (Hernandez, 1989).
JIT support a pull system where materials are moved from one work center to another in the smallest possible quantities and with the shortest possible lead-time. There are two types of material movements in a manufacturing environment: the external movement of material from supplier to customer, and the internal movement of material throughout the several workstations within a company. Regarding both types of movement, according to JIT system, the time that a material spends travelling does not add any value to the final product and it is just a waste (Hernandez, 1989).
2.1.3 Safety stock and Inventories
According to Hernandez (1989), JIT considers also safety stock as one of the major wastes. Safety stock is a quantity of inventories that remain in the warehouse in order to feel safe in a manufacturing environment. There are two types of safety stocks:
• Voluntary: inventories are kept voluntary in order to cover any hole in the production planning or in the supplied material;
• Involuntary: the material department send to the production line more parts than the production capacity can use.
Experience show that the quantity of voluntary or involuntary inventories is larger in a push-system than a pull-system since the pull-system tends to produce only what is needed from the customer without any excess. But what happens in a real production line? How does the pull-system work? The pull-system works thanks to a card called Kanban that helps to make the process work (Hernandez, 1989).
2.2 5S
In order to make the factories adapt to the changing environment, they must move on from the old and traditional organizational systems and try to implement new methods that can help them to survive in a more competitiveenvironment (Hirano, 1995). According to Chapman (2005), most of the companies face problems regarding waste of time and resources within the workplace. For instance, within a workplace, workers, most of the time, look for missing tools or components, do not take care of obsolete parts, do not find WIP so the work order are incomplete etc. All these problems are triggered by a lack of organization and standardized rules. In a long-term approach all those issues will affect the productivity and the quality of the company negatively and in particular they will:
• Increase lead-times and delivery-times; • Decrease productivity and quality level; • Increase costs;
• Increase equipment break-downs and set-up times; • Increase safety risks;
• Increase space constraints issues.
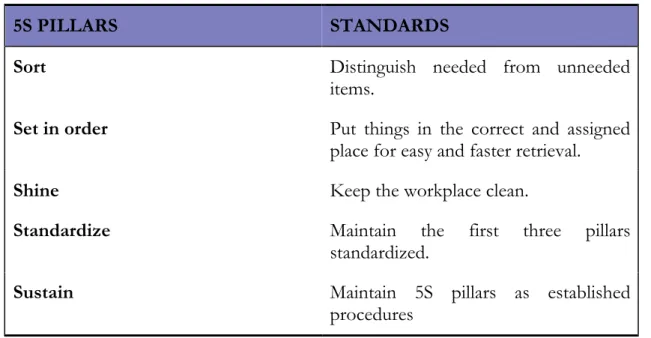
To avoid or correct all those issues, one solution is implementing a 5S system that leads the company to improve its activities and way of working (Chapman, 2005). The 5S system is based on 5 “pillars”, as Hirano (1995) defined them, and they are represented by 5 words, relatively referred to specific standards:
Table 2.2 5S pillars with relative standards (Chapman, 2005) 5S PILLARS STANDARDS
Sort Distinguish needed from unneeded items.
Set in order Put things in the correct and assigned place for easy and faster retrieval.
Shine Keep the workplace clean.
Standardize Maintain the first three pillars standardized.
Sustain Maintain 5S pillars as established procedures
The implementation of a 5S system is fundamental to highlight inefficiencies and wastes within the workplace and to solve them. Indeed, when a company implements a good-workplace organization, the process defects can be reduced by 50% (Chapman, 2005).
2.2.1 Sort
According to Hirano (1995) “sort means that you remove all items from the workplace that are not needed for current production operations”. The first thing to clarify is what is needed and what is not; as a matter of fact, employees often misunderstand it. For instance, Chapman (2005), said that, most of the time, a workspace is full of parts, WIP, scrap, document, tools, packaging materials, and other items that represent material that is not needed to meet production objectives. This material make just chaos within the workspace impeding the workflow. According to Hirano (1995), those items tends to accumulate in the following locations:
• Corners next to the entrance/exit; • Along walls;
• Along warehouse’s shelves;
• In toolboxes that are not clearly sorted.
Those items need to be identified and collected in order to take a decision about what to do with them. The red-tag strategy is a simple method to identify and collect material (signed with a red-tag) from the warehouse or the whole factory. After creating a “red tag area” (where the unneeded or obsolete material is collected), the material is evaluated and decisions about what to do with it are taken (Hirano, 1995).
2.2.2 Set in order
According to Chapman (2005), “set in order means that there is a place for everything and everything is in its place”. The location of machines, inventories, tools, files and other items should be clear so that anyone can easily find what he is looking for and replacing it without any difficulty. Hirano (1995) defined the “set in order” pillar as the core of standardization since it is impossible to implement any form of standardization if the workplace is not in order before. After finding the appropriate location for those materials, it is important to clearly sign the location boundaries so that it is easy to know where to go or where to find the item that is looked for. The signboard strategy, for instance, is used to identify locations such as:
• Work areas;
• Inventory locations; • Equipment storage;
• Standard procedures • Layouts.
For example, when “set in order” inventory locations it is important that every shelf have a signboard to identify the section. Moreover every space into the shelf needs to have an address signboard (return address) useful to make easier returning an item to the right place once it has been removed. Moreover, it could be useful to mark the “walking areas” and the “working areas” by painting the floor in order to easily identify locations (painting strategy). In the end, outlining and color-coding strategies are useful to identify the tools’ or materials’ location by marking their shape and the purpose of using such a tool or part. (Hirano, 1995).
2.2.3 Shine
This pillar is aimed to develop activities that keep everything clean and swept, in the way that also equipment is in top condition and ready to be used. According to Hirano (1995) cleaning targets are represented by:
• Warehouse items (raw materials, inventories,, components, semi-finished and finished products)
• Equipment (machines, tools, instruments, chairs, desks, etc.) • Space (floors, working areas, walking areas, walls, shelves, etc.)
While employees are cleaning they also should make inspection of the equipment or the controlled space, for example, using checklists to standardize the tasks. (Chapman, 2005).
2.2.4 Standardize
This pillar is used to maintain the first three pillars and it is useful in order to create a consistent way that tasks and procedures are done. The main aim of this pillar is to combine “sort”, “set in order” and “shine” into an integrated system, after the three pillars are properly maintained. In order to implement standardization, it is important to follow 3 steps:
• Assign responsibility: everyone must be aware of who is responsible, for what, when, where and how to do that job.
• Integrate 3S duties into regular work duties: the maintenance of the three pillars must be considered as a natural part of everyone’s work tasks. • Check the 3S maintenance level: apply maintenance tasks after the 3
pillars are implemented as an everyday work routine.
“Implementing an unbreakable standardization means making Sort, Set in Order and Shine unbreakable procedures” (Hirano, 1995).
2.2.5 Sustain
This fifth pillar is considered as a guide of how to standardise the first three pillars. It gives a sort of guide that sustain the implementation of the other pillars. However, the results of the implementation of this pillar are not measurable and visible. The most useful conditions to apply sustained pillars are:
• Awareness of everyone of how important it is to sustain the four pillars; • Time that is needed to make the implementation of 5S pillars;
• Structure to implement the 5S strategy;
• Support in terms of leadership, resources and acknowledgement; • Rewards since efforts always need to be recognised;
• Satisfaction of the implementer and the whole company in order to involve more people.
Even if the four pillars are implemented very well, it is not sure that the 5S system will work for long without an applied and well used sustainability (Hirano, 1995).
2.3 Activity-Based Management
Activity Based Management (ABM) is a method that identifies and evaluates activities that are carried out within a firm and it determines their cost and performance. The idea is to manage those activities and business processes in order to achieve organizational objectives, reduce costs and non-value activities. Activity Based Costing (ABC) is closely related with ABM and it is a method that assigns costs in a different way from the traditional cost allocation. With ABC method, costs are assigned depending on the activities (planning, engineering, manufacturing etc…), which are associated with specific products or services (Alabbadi & Areiqat, 2010).
Enterprises are usually organized with a rigid separation and specialization between the various departments, in the way that each department has different objectives, which lead them to have a lack of coordination. This separation of responsibility leads the different departments to compete and not to collaborate and coordinate. This is caused by lack of knowledge about the interrelated activities within the whole process. Indeed, all the activities that concern each department are interrelated and the need of an integrated system is, today, fundamental in order to achieve a harmonious flow throughout the organization. This integrated system contributes to shut down the barriers between departments and it involves all the workers and the activities in a strong collaboration (Brimson and Antos, 1994).
According to Brimson and Antos (1994), activity-based management aims to breaking down the organization into activities. Each activity is an explication of what the enterprise does and how much time it spends. The activities can be classified as:
• Repetitive: those activities that the organization carry on a continual basis and they involve repetitive processes.
• Non-repetitive: they are one-time activities, usually managed during a project.
• Primary: activities that contribute directly to the department mission. • Secondary: activities that support primary activities within a department
(administration, training, supervision).
As said before, activity based costing is an instrument of activity-based management and it is becoming very important within SMEs. In particular, the implementation of ABC method is growing within those firms that aim to improve their productivity and quality. One of the advantages of implementing ABC method is that it allows firms to produce parts with better consistency and conformity to quality specification; but the most important advantage is that ABC drives the reduction of time between customer order and delivery (Gunasekaran et al., 1999).
ABC provides the bases for achieving enterprise excellence and improving cost and performance. Moreover it provides a clear view of how services and activities are used within an organization and it provides a non-value-added analysis and analysis of best practices. (Brimson and Antos, 1994).
2.4 Hoshin Exercise
According to Witcher and Butterworth (2001) Hoshin Kanri is a strategy that combine strategic and operational management objectives. Since in many companies top management goals do not correspond to the daily operational ones, Hoshin Kanri aims to consider top management goals at operational level. According to Hutchin (2008) the term Hoshin Kanri has four components:
1. Ho: direction; 2. Shin: focus; 3. Kan: alignment; 4. Ri: reason.
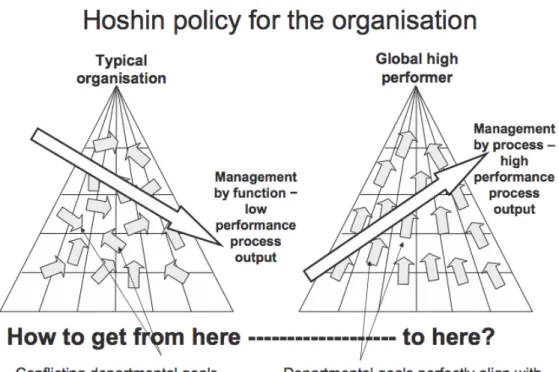
Hoshin Kanri is closely related with Total Quality Management (TQM), which is founded on the principles that each person within an organization is considered an expert on his job or task and that he wants to be part of the success of a firm by giving a small contribute. At a higher level, each department within a company has its own goals, targets and way of working, usually different from the other departments and sometimes from the top management. In a company where Hoshin Kanri is not used, each department will be separated from the other departments in the way that they don’t share the same goals. This lead to conflicts between departments and managers of each department will focus only on the local goals rather than be in line and interested in the goals of the whole organization. Moreover, each department just perform its own activities in its own way without considering if its way of working could negatively affect the next department. This is caused by a lack of communication between departments that leads to that they don’t understand each other’s needs (Hutchin, 2008).
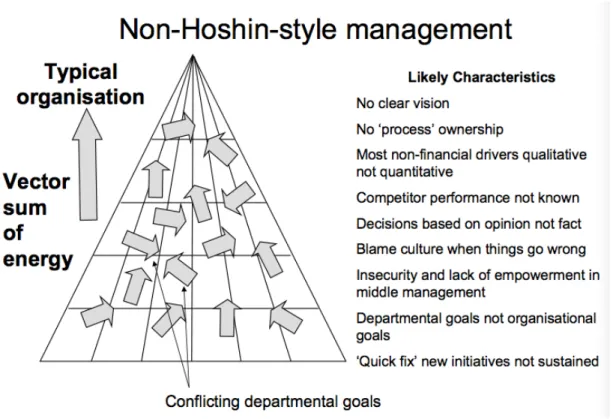
Figure 2.8 shows how conflicting departments affect the whole company when Hoshin Kanri is not applied:
Figure 2.5: Non-Hoshin Kanri management (Hutchin, 2008)
The various vectors represent the goals of each department and, as it can be seen, those vectors have different directions. That means that each department within this company does not share the same goals and departments do not communicate (Hutchin, 2008).
On the contrary, if the organization chooses to implement the Hoshin Kanri model, the different vectors will be aligned to the same direction. That means departments will start to communicate, share problems and solution to those problems, and share the same goals aligned also with the organizational goals. The management will pass from a management by function to a management by process where departments’ functions are integrated and where the performance process output will be higher than a management that does not use Hoshin Kanri. The differences between those two types of management style (Hoshin and Non- Hoshin) are showed in figure 2.9.
Figure 2.6 : Differences between Hoshin and Non-Hoshin Management (Hutchin,
2008)
In general figure 2.9 shows the typical organization, with conflicting departmental goals, and the ideal organization where the departmental goals are aligned with corporate goals. It is important to implement a Hoshin Kanri method within a company, in the way that every department aligns its own goals with the other department goals.
3 Method and implementation
3.1 What’s a research?
According to Williamson (2002), research can be described as one of the fundamental activities of human beings. The need to know, interpret the environment through exploring and comparing things is called research. While the “basic research” is about gaining new knowledge and tends to focus on theory building, “applied research” is based on solving problems in real-life situations and it is much more pragmatic and concrete.
3.2 Case study and action research
According to Yin (2009) a case study is “an empirical inquiry about a contemporary phenomenon, set within its real-world context, especially when the boundaries between phenomenon and context are not clearly evident”. According to Yin (2012), the main reasons why to choose this research method are related to:
• Research questions; • Collection of data • Aim of the research
The type of research questions that the study will address must be descriptive questions (“What results will be reached concerning quality and productivity within the paint department of Novaprint?”) or explanatory questions (“How can the improvement strategies and methods in the model of Gunasekaran be used in order to bring appropriate results in a SME?”), in the way that they highlight the problem, describe it, and focus on how to solve it. Moreover, the collection of data must be done in a natural setting, since the study is based on a real-world context, and it must not be based in data that has been used before. In the end the “case study” method is usually used to conduct evaluations and it is used also as a source of authoritative studies. (Yin, 2012)
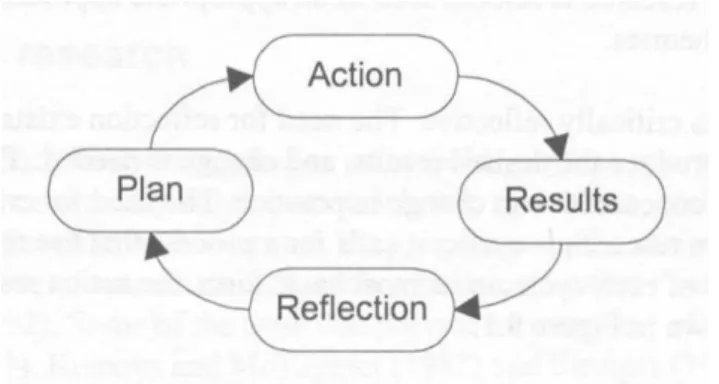
According to Williamson (2002) “Action Research” is a hermeneutical approach that is based on the study of human actions and social practices and it has been applied in fields like organizations and organizational behaviors. The main objectives of action research are the action in practice and the generation of knowledge. The action research process is based on four steps closely connected in cycle. Figure 3.1 shows the process of action research method:
Figure 3.1. Action research cycle process (Williamson, 2002).
The important thing that is shown on this figure is that from results of an action, some reflections (knowledge) are generated and, with those reflections a plan for another action research cycle is generated. This approach makes the study more practical and concrete based on traditional theories but, the reflections on previous studies are also considered as an important source (Williamson, 2002). According to Benbasat et al. (1987) the action research method differs from the case study because it involves actively the researcher within the study. In this way, the researcher becomes an active participant within the project rather than just an observer. Indeed, he will help and collaborate to solve problems and concerns in order to be an active part of the entire project.
Coghlan and Brannick (2005) said: “action research may be defined as an emergent inquiry process in which applied behavioral science knowledge is integrated with existing organizational knowledge and applied to solve real organizational problems. It is simultaneously concerned with bringing about change in organizations, in developing self-help competencies in organizational members and adding to scientific knowledge. Finally, it is an evolving process that is undertaken in a spirit of collaboration and co-inquiry”.
For this last reasons this study research is based on combination of a case study and an action research since it satisfies all the requirements of a case study and, at the same time, it involves actively the researcher in the research project as a participant.
3.3 Collection of Data
3.3.1 Collection of theoretical data
Within the project, the collection of theoretical data was conducted by the researcher though a literature review. According to Creswell (2003) “the literature review in a research study accomplishes several purposes. It shares with the reader the results of other studies that are closely related to the study being reported. It relates a study to the larger on-going dialogue in the literature about a topic, filling in gaps and extending prior studies”.
Regarding this project, the literature review was conducted collecting different types of materials. As references books and articles were used from two different libraries. The majority of the books used came from a library in Mexico City and some e-books, which were found on the web. The scientific articles came from both the library in Mexico City and the one in Jonkoping University. All this material was selected by several criteria. For what regards books, they were selected through the topic name and, then, just the chapters suitable with the topic were read and reported. The articles were searched in the on-line library and they were selected through a “cited by” selection method in order to highlight the most referenced and used papers. Within the on-line library, the “Scopus” database was used for a wider research of scientific articles. The most used search terms were: “JIT improvements”, “Hoshin Kanri method”, “ABM implementation”, “5S strategy”, “Productivity improvement”, “Quality development”, ect...
Mostly, the literature review was used to write the “Theoretical Background” chapter and in particular the topics showed by Gunasekaran et al. (2000) in his framework were individually searched and studied in order to have a strong base of theory and apply it to the project.
3.3.2 Collection of Empirical data
The empirical investigation and collection of data was conducted during 5 months, from January 2013 until May 2013. At the first interview with the General Director, the project was discussed and defined.
The project started with a deep observation of the processes and the activities carried out within the whole company in order to understand the process flow. At the same time questions were asked while the processes were observed. The second part of data collection regarded exclusively the department to which the project was assigned. At this phase pictures were taken in order to fix the actual situation of the environment that need to be developed and then, to see the differences between the old system and the after-project system. According to Creswell (2003), the collection of visual material, such us pictures, represents a discrete method of collecting data and, moreover, it is an opportunity for participants to share their reality. It, also, captures attention visually since it is creative.
Also documents were collected such us flow charts, organograms and other documents which contributed to get a clearer vision of how the processes worked within the company, how people are involved in those processes and how the main procedures works and are controlled within the departments.
3.3.2.1 Interviews
According to Kvale (1996) an interview is a conversation between two parts or people that are represented by the interviewer (most of the case a researcher) and the interviewee. The researcher has the task of asking questions and gain information from the interviewee. Interviews are considered as a systematic procedure to talk and listen to people in order obtain knowledge and information about a specific topic.
According to Williamson (2002), there are many types of interviews and they differ from each other based on the structure of questions or the number of interviewees. In this project unstructured interviews and E-mail interviews were used.
Semi-structured interviews are interviews that start with planned questions but the interviewer does not always follow the structure of the questions. Based on the answer of planned questions, the researcher can ask the next question (the answer will generate the next question) (Williamson, 2002). This type of interview was carried out by the researcher during the whole project in order to gain knowledge about the company, its processes and the issues that concern them. The interviewees were represented by the worker responsible for the paint department, and the responsible for the big warehouse, who had knowledge about all the processes regarding the various production departments.
E-mail interviews are used when there is impossibility for the interviewer and the interviewee to meet and talk face-to-face. They can also generate in-depth data and they consist of an exchange of information, gained through questions and answers, by e-mails (Basit, 2010). In this case study, e-mail interviews were conducted in different times of the project each time that the researcher had doubts about the processes or if she needed some company data, material or information. The e-mail interviews were conducted with the company-managing director and an on-line relation was maintained also with the warehouse responsible.
3.3.2.2 Observations
As interviews, observations are a primary source of data in qualitative research. Observation is a systematic research tool since it must answer to specific research questions. The main reason to conduct observations is to achieve some knowledge of a specific context and also to understand issues within the phenomena. Moreover observation can be very useful in a context where people may not feel free to talk or to be interviewed about a topic. In this way the observer can catch struggles and problems, among a group of workers, that an interview could not reveal (Merriam, 2009).
• Researcher can record information as it is revealed; • Researcher can notice unusual aspects;
• Researcher can explore topics, which are uncomfortable for participants to discuss.
According to Merriam (2009) a researcher has to observe several elements such as: • The physical setting and which resources or technologies are in that setting; • The participants and their organization within that context;
• Interactions between workers and their activities;
• Conversation between workers perhaps through a recorder; • Subtle factors such us informal and unplanned activities;
• Researcher behaviour since she is part of the scene as a participant.
At the moment when the researcher becomes familiar with the phenomenon and the setting, she starts to, gradually, be involved in the activities that have been observed. In this way the observer becomes a participant that is entirely involved in the same environment as the other participants (Merriam, 2009).
3.4 Gantt Chart
The Gantt chart shows how the project was carried on. Usually a project is divided in many activities and each one of them has a particular time period in which it should be completed. Figure 3.2 shows the Gantt chart made for this project with the different activities and dependencies between them. These dependences between activities are showed by an arrow connecting them.
3.5 Validity and Reliability
Williamson (2002) defines the concepts of validity and reliability as the following: • Validity is the capacity of a research to measure what is set by the
researcher to measure.
• “Reliability refers to the consistency of results produced by a measuring instrument when it is applied more than once in a similar situation”.
Validity can also be measured as internal or external. While the internal validity refers to collection of data that regards only the local context (company or department), the external validity refers to the applicability of data, collected in a specific context, in an external context (another company) (Williamson, 2002). The aim of reliability is that, if a researcher carry out a study with particular procedures, a later investigator should arrive at the same results and findings of the first researcher, using the same procedures. Moreover it is important to document these procedures in order to avoid a possible repetition of work and to make the reader aware of where that results really comes from (Yin, 1994).
This thesis was conducted with a good validity and reliability. The collection of data was conducted with a close relation with the responsible of the department and even more of the all company (General Director), who gave the right information about the research. It was possible visit many times the company and observe personally the processes within the department, participating actively to the project. All those reasons made the research valid and reliable.
4 Findings and analysis
4.1 Company Background
The project was based on a case study conducted in Novaprint, a Mexican company that produced packaging material for the pharmaceutical industry. Novaprint was a small company and needed to develop one of its departments following a theory-based research of methods and techniques, which could help the company to achieve the expected results at the end of this project.
Novaprint was a Mexican Company with more than 30 years of experience that produced pharmaceutical packaging material and distributed it to pharmaceutical industries. The biggest plant, situated in Mexico City, was 3000 m2 and 90
employees were working in 2 shifts (45 workers for each shift), since the plant was open from 6 in the morning to midnight, from Monday to Saturday. There was also a small plant situated in Guadalajara but it was about 1/5 of the biggest plant in dimension and production capacity.
The principal objective of the company was achieving competitive advantage by making a strategic connection with its customers, offering a big variety of packaging products with good quality, high level of flexibility and short delivery time. Novaprint had contacts with many important pharmaceutical industries in Mexico and also abroad. The company, moreover, offered direct exportation to other countries such as Brazil, Peru, Ecuador, Nicaragua, Colombia, Dominican Republic and also USA. In 2012 the company had a growth of sales of 15% compared with the past year and it run 6900 work orders.
Basically, the company production area was divided in three production departments working together in order to send the semi-final products to the final production line that consisted in a process of printing, rewinding and cutting the blister rolls. The project focused on one of the company departments: the Paint Department. This department included the production of various paints and their location in a small warehouse. This warehouse was separated from the central warehouse, where materials and final products were stocked, physically as well as in terms of type of organization and inventories handling.
4.2 Company Production Processes
The whole production process to get to the final product was divided in sub-processes handled in different production departments where the semi-final product was stored and sent to the final production line. For these reason, each production department had a specific production process, more or less complex, and a relatively small warehouse where the products were stored. Moreover, there was also a big warehouse where the supplied materials and the final products were stored. Each department sent their products to an area, placed in the big warehouse, where the materials from the different departments were combined with the supplied materials. This combination of material represented a work
order that was assigned to a specific printing machine and then sent to the final production line.
Figure 4.1: Company Production Processes
A work order was a kit of materials ready to be sent to the final production line. The material kit was composed by rolls, paper cylinders and paints put on a pallet, which was assigned to a printing machine and ready to be sent to the production line. Only when the pallet was complete with all the materials requested, it could be send to the production line.
4.2.1 Production Departments
Basically there were three different production departments: the roll department, the paper cylinder department and the paint department.
The rolls were produced in the roll department. They had different engravings based on the customer request. These rolls were produced and then stored in a small warehouse ready to be sent to the big warehouse directly in the work orders place.
The paper cylinder department was located in a small area where the big paper cylinders were stored and then cut by a semi-automated cutting machine based on the diameter of the foil coil that was going to be worked. Also these paper cylinders were sent to the work orders area.
In the end there was the paint department where requested paints were produced and stored in a warehouse of approximately 300 locations.
4.2.2 The principal warehouse
The principal warehouse was the place where the majority of material and final products were stored. The materials consisted of rolls of blister foil aluminum, plastic or laminated foil and the final products were, basically, printed and cut coil foils ready to be sent to the final customer. The maximum stored capacity was about 3000 tons of material in the principal warehouse, where 1500 tons were used for printed coils and about 1500 for only cut coils.
In the principal warehouse there was also an area where all the materials, divided by orders, were placed. The different work orders, as said before, consisted of a combination of materials put on a pallet that was sent directly to the final production line. These work orders were assigned to the respective printing machine where they were going to be run.
4.2.3 The final production line
The final production line was located in a big area where the coils were printed, cut, rewound and sent to the warehouse ready to be delivered. In the final production line there were ten printing machines, two cutting machines and three rewind machines.
The printing machines varied based on the number of paints to print on the coils. The width and the speed of the machine depended on the number of paints that could be used to print the coil. For example, there were printing machines for one paint, two paints, four paints and six paints. A printing machine of only one paint was smaller and produced with lower speed than the one with six paints. Moreover, the number of paint buckets and the number of rolls depended on how many paints the machine was going to print on the foil. Each year about 1500 tons of coils were printed in this production area. Some customer orders did not include the printing activity but only the cutting one.
4.3 Paint Department
The project focused on the paint department since it was the department less developed in comparison with the other departments.
The paint department was situated near the big warehouse on the second floor and it had access through a small spiral staircase. This made the material handling difficult since they needed an elevator to move the paint from the department to the big warehouse.
The paint department covered a small area of about 80 m2 and it included the area
where the paints were produced (paint-production area) and the area where the paints were stored (paint warehouse). The paint warehouse included the storage of basic paints, solvents and final paints.
Final paints were the produced paints and they were composed by mixing basic paints and solvent. All those paints were stored in buckets of 20 kg capacity in different locations within the warehouse. To each location was assigned two or three buckets depending on the space. The paint department presented almost 300 locations with 450 paint buckets. Even if each bucket had a capacity of 20 kg, not all the buckets were full or even at the half. For this reason it was assumed that the quantity average was 15 kg for each bucket. The average was calculated based on a sample of 20 buckets.
Figure 4.2: Average of buckets weight.
The total quantity of paint within the warehouse was calculated as the total number of buckets multiplied with the average weight quantity of each bucket:
444 buckets * 15 kg/buckets = 6660 kg. In total the warehouse contained about 6660 kg of paint.
The average cost of this paint was 7,00 $/kg, according to the interview with the general director. This meant that the value of the paint inventory was:
7,00 $/kg * 6660 kg = 46620 $
However the value of the paint inventory that was calculated above is not real since there was a big quantity of paint that had become obsolete for months or even years. Those paints lost their value due to the time passed that affected the properties of the paints.
The buckets’ locations were not registered in an IT archive system but they were registered in a handwritten notebook and this made difficult the placing and picking-up of the different buckets.
4.3.1 Paint Department Processes
When a request was sent to the paint department, there were two ways to satisfy the same request depending on the exiting stock of the requested paint. The process flow of this department is showed in figure 4.3.
Figure 4.3 Paint Department Process Flow.
• If the paint bucket requested was already stocked in the paint warehouse (red line), then the operator needed to pick it up and send it to the big warehouse (order area).
• Otherwise, if the paint bucket was not stocked (blue line), then the operator needed to produce it using raw materials that were located in the warehouse and following a production process procedure. In the end, the produced paint was sent to the big warehouse.
Obviously, if the paint was already stored in the warehouse, the worker would spend few minutes to pick up it and send it to the order area. At the contrary, if the paint was not stored, the time to send it to the order area would be a lot longer because of the production procedure that the worker had to follow.
4.3.2 Activities process
Regarding the case when the paint was already stored, it was not possible to get information about how much paint needed to be sent to the production line. The problem was due to the fact that it was currently not possible to calculate how much paint would be used to complete a customer order since it depended on the depth and the type of engraving of the roll. For instance, some rolls needed more or less use of paint comparing with others and the company lacked methods for calculating the exact amount of paint needed.
Since the buckets’ capacity was 20 kg, in some cases it resulted that it was too much to send a bucket of 20 kg of paint because a big quantity would be returned to the paint department to be stored again. For this reason, in some cases the paint department, instead of sending buckets of 20 kg of paint, sent buckets with the capacity of 10 kg (small buckets) to the printing process. For instance, if the printing would imply just a small text and the coil foil would be small, it was sure that not much paint would be used to print and so, the paint department would send the small bucket.
When considering an Activity-Based Management approach it is important to evaluate each activity and the costs involved for each activity. In this case study, activities were represented by what the worker needed to do in order to follow a process or a procedure and to complete a task. The analysis was limitaed due to the fact that the case study was based on a single department and there was a need to define boundaries for what regards the ABM strategy. The procedure that the worker had to follow, in order to send a bucket to the production line (if the bucket is already in the warehouse), was the following:
1. Receive the paint bucket request;
2. Pick up the big bucket from the warehouse; 3. Pour the paint from the big to the small bucket; 4. Send the small bucket to the final production line; 5. Receive the small bucket when it is returned;