J
Ö N K Ö P I N GI
N T E R N A T I O N A LB
U S I N E S SS
C H O O L JÖNKÖPING UNIVERSITYC u r r e n c y Tr a d i n g i n t h e F X m a r k e t
Will spectral analysis improve technical forecasting?
Bachelor thesis in Business administration Author: Gustaf Haag (870915-1933)
Jessica Häggman (840319-0062) Jacob Mattsson (870327-3931) Tutor: Prof. Andreas Stephan
Bachelor’s thesis within Business Administration
Title: Currency Trading in the FX market – Will spectral analysis improve technical forecasting?
Author: Gustaf Haag
Jessica Häggman
Jacob Mattsson
Tutor: Andreas Stephan
Date: 2010-05-24
Keywords: Technical analysis, foreign exchange market, spectral analy-sis, Fourier transform.
Abstract
Background: The efficient market hypothesis asserts that one cannot consistently achieve returns in excess of market returns by trading on publicly available informa-tion. Since there is no collective market return in the foreign exchange (FX) market, it has generally been perceived as impossible to consistently gener-ate a profit. There is now empirical evidence which seriously call into ques-tion the efficiency of the FX market and opens up the possibility to turn a profit on the FX market by ways of analysis.
Technical analysis is a method of analysis which by using historical price data tries to deduce future price changes. Technical analysis assumes that fi-nancial markets move in sine waves. There are stronger and weaker sine waves simultaneously. An accurate identification of the dominant sine wave gives the investor a good idea about future movement. Most technical trad-ing tools approximate the length of the sine wave by default. This static ap-proach does not consider the specific market or the recent lengths of the dominant sine wave. Spectral analysis will help to identify the dominant cycle, and thus determine the frequency of that cycle making the applied trading rules adaptive to the market.
Purpose: The purpose is to investigate whether adding spectral analysis to existing technical analysis tools can create a higher and more stable return on in-vestment on the FX market.
Method: An experiment involving four different sets of trading rules was conducted to answer the purpose. In the first test, trades were performed based on a static approach commonly used by technical traders today. In the other three tests different transforms of spectral analysis were applied, thus mak-ing the input not static, but adaptive to the market. The four sets of tradmak-ing rules where coded as an automatic trading algorithm and backtested on data collected for the currency-pair EURGBP during an 11-month period. All four tests were analysed in three different areas; performance, stability of re-turn and crash risk.
Results: The study shows that the application of spectral analysis to technical analy-sis methods on the FX market results in higher return on investment and better stability of returns. The win/lose ratio is significantly higher and the adaptive approach increases profit as well as decreases losses.
Kandidatuppsats inom företagsekonomi
Titel: Att spekulera på valutamarknaden – Kan spektralanalys för-bättra teknisk analys?
Författare: Gustaf Haag
Jessica Häggman
Jacob Mattsson
Handledare: Andreas Stephan
Datum: 2010-05-24
Ämnesord: Teknisk analys, valutamarknad, spektralanalys, Fourier trans-form.
Sammanfattning
Bakgrund: Den effektiva marknadshypotesen stadgar att det inte är möjligt att stadigt generera högre avkastning än marknadens kollektiva avkastning genom att köpa och sälja baserat på tillgänglig information. Eftersom det inte finns någon kollektiv avkastning på valutamarknaden har det länge ansetts omöj-ligt att generera någon stabil vinst på denna marknad. Det finns numera empiriskt bevis som tydligt ifrågasätter valutamarknadens egentliga effektivi-tet och som också i sin tur öppnar upp för möjligheten att generera stabil avkastning på valutamarknaden genom analys.
Teknisk analys är en analysmetod som genom avläsandet av historisk pris-data försöker utläsa framtida prisförändringar. Teknisk analys antar att fi-nansiella marknader rör sig i sinuskurvor. Det finns starkare och svagare si-nuskurvor. En exakt identifikation av den dominanta cykeln ger investera-ren en god idé om framtida rörelser. De flesta tekniska analysverktygen uppskattar längden på cykeln statiskt och tar varken hänsyn till den specifika marknaden eller hur den dominanta cykeln har sett ut nyligen. Spektralana-lys identifierar den dominanta cykeln varigenom frekvensen av densamma kan bestämmas och analysverktyget görs adaptivt till marknaden.
Syfte: Syftet med uppsatsen är att ta reda på huruvida teknisk analys på valuta-marknaden kan skapa en högre och mer stabil avkastning på investerat kapi-tal genom användandet av spektralanalys för att mäta den dominanta cykeln. Metod: Ett experiment innehållande fyra olika uppsättningar av analysverktyg
gjor-des för att besvara syftet. Handel i det första testet baseragjor-des på en statisk ansats som normalt används av tekniska analytiker idag. På de andra tre tes-terna applicerades olika transformer av spektralanalys och gjordes därige-nom adaptiva till marknaden. Analysverktygen kodades som en automatisk handelsalgoritm och testades retroaktivt på insamlad data för valutaparet EURGBP under elva månader. Samtliga fyra tester analyserades i tre olika områden; prestation, avkastningsstabilitet och risk att förlora hela kapitalet. Resultat: Studien visar att applikationen av spektralanalys på tekniska analysverktyg
på valutamarknaden resulterar i högre avkastning på investerat kapital och högre avkastningsstabilitet. Vinst/förlust ration är väsentligt högre och den adaptiva ansatsen ökar avkastning samtidigt som den minskar förluster.
Abbreviations
CCI – Commodity channel index DFT – Discrete Fourier transform GDP – Gross domestic product EMH – Efficient market hypothesis
EURGBP – Currency pair Euro / Pounds Sterling FA – Fundamental analysis
FX – Foreign exchange
MESA – Maximum entropy spectral analysis OHLC – Open high low close
Table of Contents
1
Introduction...1
1.1 Background ...1 1.2 Problem Discussion ...2 1.3 Purpose...3 1.4 Delimitations...3 1.5 Disposition...32
Theoretical Framework ...5
2.1 Technical analysis...52.1.1 A theoretical approach to technical analysis...5
2.1.2 Profitability of technical analysis ...6
2.1.3 The Efficient Market Hypothesis and the FX market...7
2.1.4 Technical analysis on the foreign exchange market ...8
2.2 Spectral Analysis...9
2.2.1 Introduction to Spectral Analysis...9
2.2.2 Application of Spectral Analysis in Finance ...10
2.2.3 Trigonometric curve fitting and Regression analysis ...11
2.2.4 Fourier Transform and the Frequency Domain...13
2.2.5 Spectral Resolution and Maximum Entropy...14
3
Method ...15
3.1 Theoretical method ...15
3.1.1 Choice of method ...15
3.1.2 Literature selection...16
3.1.3 Validity and Reliability ...16
3.2 Design of experiment ...17
3.2.1 Introduction to the experiment ...17
3.2.2 Choice of technical trading method: Commodity Channel Index ...17
3.2.3 Choice of Spectral Analysis Transform Methods ...18
3.2.4 Choice of Currency: EURGBP on the Asian Market ...19
3.2.5 Transaction Costs ...20
3.3 Data Collection Method...21
3.3.1 Introduction ...21
3.3.2 Source of Currency Data ...21
3.3.3 Software (Metatrader 4) ...22
3.3.4 Trading Algorithm Source Code...23
3.3.5 Backtesting...24
3.4 Data Analysis Method ...24
3.4.1 Measurement of Performance ...24
3.4.2 Measurement of Stability ...24
3.4.3 Crash Risk...25
4
Empirical findings...26
4.1 Introduction ...26
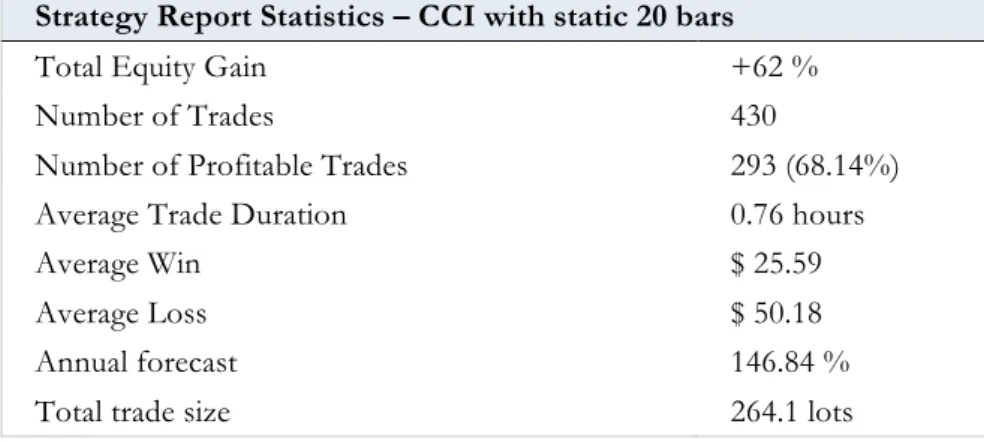
4.2 CCI with static 20 bars (M20)...26
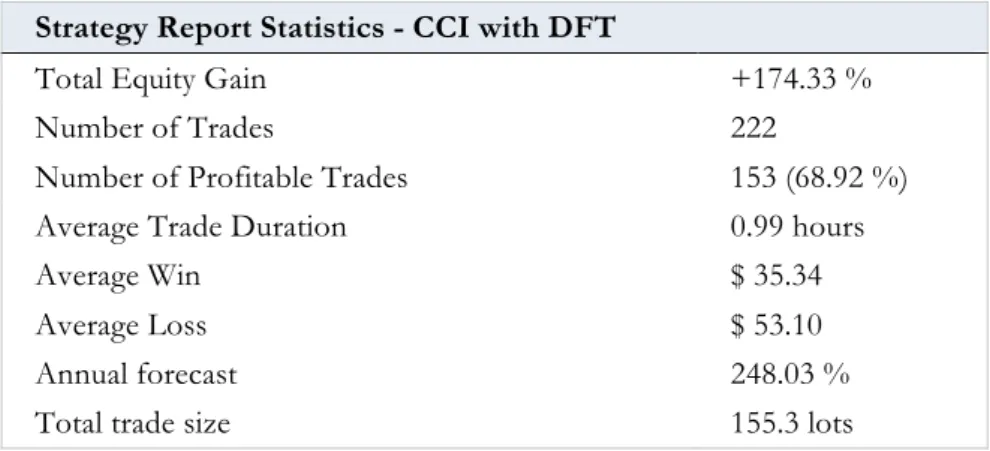
4.3 CCI with Discrete Fourier Transform (DFT) ...27
4.4 CCI with the Hilbert Transform...28
5
Analysis ...31
5.1 Measurement of Performance ...31 5.2 Measurement of Stability ...34 5.3 Crash Risk...356
Conclusion ...36
7
Discussion ...37
References ...38
Figures and Appendix...41
Table of Figures and Tables
Figure 1 - Plot of 20sin(x) and 2sin(25x)...12Figure 2 - Plot of 20sin(x) + 2sin(25x)...12
Figure 3 - Fourier Transform of 20sin(x)+2sin(25x)...13
Figure 4 - The Famliy of Fourier Transforms...41
Figure 5 - FX Market Segmentation...41
Figure 6 - Comparison of P&L between Profit-Seekers and Liquidity-Seekers...42
Figure 7 - Commodity Channel Index...18
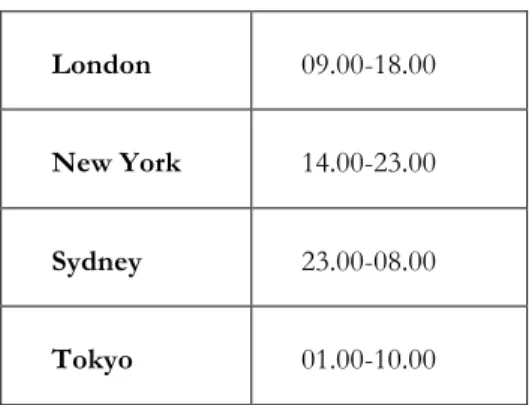
Figure 8 - FX Market trading time...20
Figure 9 - Flowchart of Trading Algorithm...43
Figure 10 - Sharpe Ratio...25
Figure 11 - Result from the CCI with static 20 bars...26
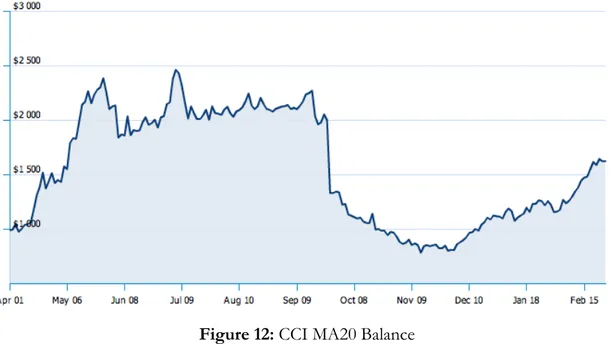
Figure 12 - CCI MA20 Balance...27
Figure 13 - Result from the CCI with DFT...28
Figure 14 - CCI DFT Balance...28
Figure 15 - Result from the CCI with the Hilbert Transform...29
Figure 16 - CCI Hilbert Balance...29
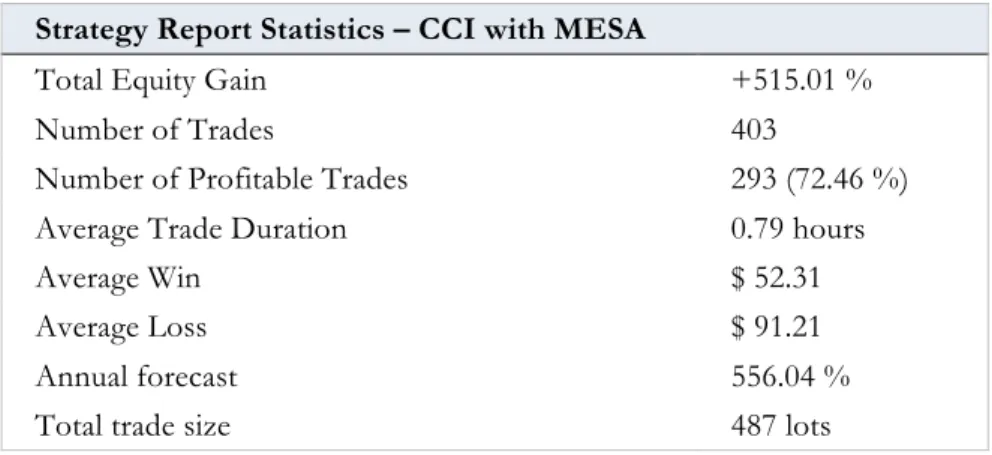
Figure 17 - Result from the CCI with MESA...30
Figure 18 - CCI MESA Balance...30
Figure 19 - Comparison between the performances of the four tests...31
Figure 20 - CCI MA20 Linear Regression of Monthly Gain...32
Figure 21 - CCI DFT Linear Regression of Monthly Gain...33
Figure 22 - CCI Hilbert Transform Linear Regression of Monthly Gain...33
Figure 23 - CCI MESA Linear Regression of Monthly Gain...33
Figure 24 - Comparison between the stability of the four tests...34
1 Introduction
In this chapter the subject of the thesis is introduced. A short background of technical trading and the for-eign exchange (FX) market will introduce the reader as to why technical trading on the FX market might be profitable. The problem - how one can improve the technical trading on the FX market - will then be discussed along with a short summary of the practical aspects of the experiment of the thesis. This will lead the reader into the purpose which will then be explained. Lastly, a disposition and delimitations will be pre-sented in the end of this chapter.
1.1 Background
It is in the nature of man to speculate and to pursue trade. An early example is the tulip mania in 1637 where prices of single tulips skyrocketed to ten times the annual wage of a craftsman. People started to speculate in tulips, buying them only to resell them at a higher price (Gyllenram, 1998). A financial market is society’s mechanism to enable people to speculate and trade amongst each other. The idea of trading has not changed, but with time, market places have grown more sophisticated. News, annual reports and stock prices are distributed in seconds all around the world and all actors have access to the same in-formation. However, it is virtually impossible to gather and process all the information, which has lead to a need to screen and analyse the available information.
When speculating on any financial market, including the FX market, one can use either fundamental analysis (FA) or technical analysis (TA) to evaluate when to buy and when to sell (Yioryalis, 2004). When applying FA to the FX market, the decisions should be based on market-driving factors. These contain of publicly accessible information such as political and economic conditions, GDP, growth, inflation, interest rates etc. By examining, analyz-ing and weighanalyz-ing these underlyanalyz-ing factors, the idea is to predict the future movement of the certain exchange rate, and to trade based on these predictions. However, it is virtually im-possible to get a perfect prediction over the future movement because there are simply too many factors affecting the market.
TA assumes that the price reflects all known information and the opinions of all market participants regarding that information. By analyzing historic price movements, using TA an investor will try to obtain guidance as to the future movement of that market (Schwager, 1999). When obtaining and analysing the relevant market information, the fundamentalist is primarily concerned with the ”why” of the market behaviour whereas the technician is more concerned with the ”when” (Schwager, 1999).
One could argue that it is hard to gain much of an advantage on the stock market using TA since all the participants on the market seek profit and share the same information at any given time. This is certainly not the case with the FX market. The FX market is the largest and most liquid financial market in the world with over 3200 billion dollars being traded on the world’s main financial marketplaces every single day (Johnson, 2009). Despite the huge amount of currency switching owner, no new value is created through this trade and it is considered a zero-sum game where every profit is equally matched by a loss (Hafeez, 2007). As a result, investors have long disregarded the FX market as a non-profitable market. Thus, relatively few participants on the FX market are actually trying to turn a profit on their investments. For instance, businesses who are conducting trade overseas are merely in it for the security of currency hedging (Johnson, 2009).
However, time is changing and investors have started to explore profit possibilities in this zero-sum game. A market where most of the actors are sitting ducks has turned out to be
an attractive playground for the skilled investor (Johnson, 2009). In the 2007 report Cur-rency Markets: Is Money Left on the Table?” the influential Deutsche Bank concluded that prob-ably as high as 75 percent of the participants on the FX market are not profit-seeking. But with the attention of skilled investors directed at the FX market, one could argue that this may be the end of a market without profit-seekers. However, even though the profit seek-ers are increasing fast in numbseek-ers, they are in total declining in percentage because of the even faster increasing numbers of participants conducting cross-border trade (Hafeez, 2007). This suggests that there are no signs of declining opportunities for the profit-seekers on the market.
It is easy to see why TA is the most widely used trading strategy in the FX market (Neely, 1997), and TA is considered to be better fitted for the FX market than any other financial market (Park & Irwin, 2004). A valid question at this point would be how investors using TA on the FX market can improve their trading game.
1.2 Problem Discussion
TA is based on the assumption that financial instruments move in cycles. By knowing and analyzing previous movements of the cycles, TA tries to predict the future movement, i.e. to approximate the future price of that particular foreign exchange rate, stock or commod-ity. Following this logic, there is a wide variety of technical indicators available to help iden-tify when a certain exchange rate, stock or commodity is overbought or oversold, i.e. when to sell or when to buy.
In order to estimate the future movement of the cycle, it is necessary to know as much as possible about the previous movement. The more information regarding the past move-ment one can extract, the easier the task of predicting future movemove-ment becomes. An espe-cially important piece of information about previous movement is the length of the cycle. Without this knowledge, it becomes virtually impossible to predict when the price is going to turn up or down. By contrast, it can also be expected that the more valid information one can deduce regarding the length of the cycle, the more accurate predictions can be made about the future.
Technical indicators take into account the length of the dominant cycle. However, they normally base their calculations on a length of the cycle which is set by default. This default setting is usually based on the average length of the dominant cycle. However, this does not consider changes in the length of the dominant cycle (the time factor) or what kind of market that is analysed. In other words, this static approach might give correct calculations most of the time, but they are not adaptive to the market cycle volatility thus making them perform predictions based on what might be inaccurate information.
A solution to this problem might be the application of spectral analysis. Spectral analysis aims at identifying the most frequent cycle within the market observed. Assuming that there is a dominant cycle, the use of spectral analysis can help to identify it. Naturally, this cycle is more likely to reoccur in the near future than other cycles. Instead of basing calcu-lations and future predictions on the use of a default length of the dominant cycle, which are often inaccurate, we will apply different types of spectral analysis to attain the dominant cycle at that particular time, on that particular market. We will add an adaptive approach to the use of TA within the FX market.
1.3 Purpose
Our purpose is to investigate whether adding spectral analysis to existing technical analysis tools can create a higher and more stable return on investment on the FX market.
1.4 Delimitations
A common technical trading tool, Commodity Channel Index (CCI), has been chosen as the basis of the experiment. The experiment consists of four tests. All tests include the CCI trading according to a pre-determined set of rules. These rules are controlled by a com-puter which is connected to the relevant market at all times. The relevant market for the study is the FX market and the exchange rate is EURGBP. In the first test, the CCI trades with a default approximation of the length of the dominant cycle (static approach). In the three latter tests, three different transforms of spectral analysis is added onto the CCI in-strument, allowing the approximation of the length of the dominant cycle to be adjusted to the market and time (adaptive approach). Everything else, such as the market, the technical trading tool and the time period is the same. Each test will have a starting capital of $ 1000 and will conduct trade for a period of 11 months. At the end of the test period, the results of the different tests will be presented and analysed to see if an adaptive approach creates a higher and more stable return on investment.
As described, the experiment designed for this study includes an array of choices delimiting the thesis. The test uses a single TA tool and three different spectral analysis transforms which is a limitation since there are many more tools and transforms available. We have chosen these based on their characteristics and description in our literature research. In the four tests of the study trade is only conducted during the European nighttime. Fluc-tuations in the exchange rates can depend on several factors, such as political and eco-nomic conditions. Since the European markets are closed during the nighttime, less trade is conducted during these hours. People can still trade in the currency pair from other mar-kets such as the Asian or American market, but the amount of trade is still significantly smaller. It is therefore less likely for an economic or political happening to create fluctua-tions in the EURGBP exchange rate and consequently safer to trade using technical analy-sis.
The thesis provides a theoretical approach to technical analysis, allowing the reader to un-derstand the basic elements and assumptions by which technical analysis is governed. This is also all the necessary information for the reader to absorb the content and idea of this thesis. The thesis is not a guide to technical trading and little is therefore explained about the practical aspects of technical analysis such as different trading rules and systems.
1.5 Disposition
In the introductory chapter the subject of the thesis is explained. A short background of tech-nical trading and the FX market will introduce the reader as to why techtech-nical trading on the FX market might be profitable. The problem - how one can improve the technical trading on the FX market - will then be discussed along with a short summary of the practical as-pects of the experiment of the thesis. This will lead the reader into our purpose. Lastly, a disposition and delimitations will be presented in the end of the chapter.
In the theoretical framework a few theories, hypothesis and rules of vital importance to an-swering the purpose are explained. TA in general is introduced along with empirical evi-dence of the profitability. After briefly explaining the efficient market hypothesis and its
doubtful application to the FX market, the reader will be introduced to technical trading on the FX market, the scale of such trading and empirical evidence of its profitability. Spectral analysis is then explained in general after which its application in finance and its possible contribution to technical trading is discussed.
The thesis proceeds into the method chapter, where the process of how the research has been conducted will be discussed. The chapter is divided into two major parts; the theoretical method and the practical method. In the theoretical part of the method, the choice of method is presented and explained, after which the literature selection is discussed. Finally, the validity and reliability of the thesis is presented and scrutinized. The practical method allows the readers to follow the practical aspects of the working process and evaluate for themselves the validity and reliability by reading about the frames of the experiment such as chosen trading rules and chosen market. Moving on, the selection and retrieval of the data is scrutinized. Lastly, the different ways in which the data is processed and analysed to meet our purpose is explained.
The empirical findings will then be presented. An algorithm has been used to trade retrospec-tively with the exchange rate EURGBP and reports on how the specific trading rules would have performed during the backtested timeframe will be presented. The empirical findings consist of four different tests, three of which involve spectral analysis. The result of all tests will be presented in graphs and statistics, which will also be explained in words to facilitate readability.
The analysis reflects the problem discussion and the purpose of the thesis. In order to de-termine if the empirical data can answer the purpose, different ways of analyzing the data need to be considered. Three different areas of performance are analysed. The different re-sults of the different tests within each area of analysis is discussed and compared. In total, the analysis will give an answer to if spectral analysis gives a higher and more stable per-formance.
At this point, the conclusion of the thesis is presented. The purpose will be answered accord-ing to, and based on, the analysis and the results of the empirical data.
Finally, a discussion regarding the findings and their possible impact will take place. A brief suggestion as regards to further research will also be given at this point.
2 Theoretical Framework
The theoretical framework aims to explain a few necessary theories, hypothesis and rules to the reader. TA in general is introduced along with empirical evidence of the profitability. After briefly explaining the effi-cient market hypothesis (EMH) and after its application onto the FX market is questioned, the reader will introduced to technical trading on the FX market, the scale of such trading and empirical evidence of its profitability. Spectral analysis is then explained in general after which its application in finance and its pos-sible contribution to technical trading is discussed.
2.1 Technical analysis
2.1.1 A theoretical approach to technical analysis
Whether or not the market is efficient and whether it is possible to forecast and analyse fi-nancial markets has long been a discussed topic among scholars and scientists (Neely & Weller & Ulrich, 2009; Yen & Lee, 2008; Jagric & Podobnik & Kolanovic, 2005). In rela-tion to this, three different schools of thought are TA, FA and the efficient market hy-pothesis (EMH) (Yioryalis, 2004). TA and FA commonly agree that publicly available in-formation can provide guidance as to future changes in price, whereas the EMH states that this is not possible.
Two well-known prediction methods for financial prices are FA and TA (Sweeney, 2005). FA includes all information about the instrument being traded and the purpose is to iden-tify what moves the value of the instrument. When using FA, decisions are based on pub-licly accessible information mainly from the well being of the economy, industry groups and companies. As with most analysis, the goal is to forecast and profit from future price movements by examining the underlying forces affecting it (Yioryalis, 2004). It is both dif-ficult and time-consuming to gather, analyse and weigh against each other the wide variety of factors affecting the market. As opposed to FA, TA evaluates former price movement to forecast the future. TA exclusively uses historical data. By using technical indicators such as charts or other tools the analysis can identify patterns suggesting future activity (Yioryalis, 2004).
The users of FA will examine and weigh fundamental factors that can affect the future stock value or exchange rate. Fundamental factors are economic data such as political and economic conditions, GDP, growth, inflation, interest rates, and other economic condi-tions.
The technicians record the history of trading (price changes and volumes of transactions) after which they try to deduce a probable future price from that history (Edwards & Magee, 1997). This is done based on two assumptions. Firstly, the price reflects all knowable in-formation and the opinions of all market participants regarding that inin-formation. Hence, the technicians do not dismiss the fundamental factors, they merely argue that such factors are already reflected in the price. Secondly, the fundamental information and market opin-ions reflected by price will result in recurring price patterns that provide clues to potential future price movement. By analyzing historic price movements, the technicians will try to obtain guidance as to when a trend is beginning, ending or continuing (Schwager, 1999). When obtaining and analysing relevant market information, the fundamentalist analysts are primarily concerned with the ”why” of the market behaviour whereas the technicians are more concerned with the ”when” (Schwager, 1999).
Although technicians do not dismiss the importance of fundamental factors, fundamentals are only one factor driving the market. Consumer confidence, supply and demand, geo-political factors and expectations of price movement are others. It is extremely difficult to trade using all these factors manually (Kaufman, 2005). For instance, expectations of price movements are a factor driving the market. But not only the opinions or expectations of recognized analysts have an impact on the price, but also hopes, fears, guesses and moods of potential buyers and sellers. It is virtually impossible to know and weigh all factors driv-ing the market in order to end up at a future price. Luckily, there is no need for the techni-cian to study all these factors – it is only the price that is essential since all these factors, some of them for which there are no fundamental statistics, are incorporated and reflected in market psychology, which in turn rules the price movement (Edwards & Magee, 1997). The idea is to identify psychological barriers, trends and oscillations in the price-data and base the prediction on the collective behavior of the participants. To find these patterns in the price-data TA uses a wide variety of mathematical tools used as a supplement for the manual trader or stand-alone in automatic trading systems.
2.1.2 Profitability of technical analysis
Conventional efficient market theories, such as the random walk theory, deny the profita-bility of technical trading rules because the market is efficient, i.e. the price completely re-flects all available information. Given the current price and its past development, no pre-dictions regarding the future development can be made according to this theory. However, there are now plenty of other theories suggesting that technical trading rules may create a profit presuming that price adjusts sluggishly to new information due to noise, market fric-tions, market power, investors’ sentiments or herding behavior, or chaos (Park & Irwin, 2004). In turn, the debate between the efficient market and the other models has been thoroughly scrutinized amongst scholars.
Brown and Jennings (1989) argued that TA has a value in a model in which the prices are not fully revealing, i.e. where the price does not fully reflect all the information available. Closely related to this, Grossman and Stiglitz (1980) came to the conclusion that prices cannot fully reflect all the available information, because the information is costly (see 2.1.3).
Brock, Lakonishok and LeBaron (1992) analysed 26 different technical trading techniques using 90 years of daily stock prices from the Dow Jones Industrial Average. They found that all the trading techniques performed better than the market.
Lo, Mamaysky and Wang (2000) looked into the profitability of TA on US stocks over a period of 31 years and found that various technical trading rules contributed with informa-tion and may be valuable.
Park and Irwin (2004) found consistent evidence that technical trading strategies were prof-itable in various speculative markets, at least until the early 1990s.
Sullivan, Timmerman and White (1999) researched the use of a wide variety of TA tools in the American indexes Dow Jones Industrial Averages and Standards and Poor’s 500 be-tween 1897 and 1996. They found that almost every TA tool tested performed better than using a buy-and-hold strategy until 1980. After 1980 the buy-and-hold strategy performed better.
Dourra and Siy (2001) researched a selection of American stocks during 1999 and found that by combining three TA tools (Rate of Change, Stochastics and Momentum) they out-performed the buy-and-hold strategy. In their research they included the brokerage fees and other costs associated with the trades.
These studies are a few of the most important empirical studies that have examined this subject during the last four decades (Park & Irwin, 2004). Together with more than 130 other studies the vast majority conclude that there is a possibility to earn higher profits with TA. Consequently, empirical evidence is a key consideration in determining the profitability of technical trading rules (Park & Irwin, 2004).
2.1.3 The Efficient Market Hypothesis and the FX market
The theory of efficient markets assumes that financial markets are efficient, meaning that the price of an asset reflects all available information and the price is therefore “right” in the sense that it reflects the collective analysis of all investors (Fama, 1970). The hypothesis states that it is not possible to consistently win over a market by using any information that the market already knows, except possibly through inside information (Dryckman & Morse, 1986). Applied to the FX market, this would mean that exchange rates reflect in-formation making potential excess returns unpredictable. In other words, you can not steadily profit in the FX market by trading on publicly available information (Neely, 1997). Early research on the EMH displayed strong support, and very little evidence suggested that there were profitable trading rules (Fama, 1970).
TA and the EMH commonly agree that the exchange rate reflects all available information. An important distinction between the two is that the EMH suggests that exchange rates ad-just instantly to new information, preventing investors from gaining excess returns. Ac-cording to TA, current and previous changes in the exchange rates includes just the infor-mation needed to make a future profit, because exchange rates adjusts sluggishly to new in-formation (Neely, 1997).
If the EMH holds true for the FX market it would be impossible for a trader to predict any future movement, and in turn to gain excess returns. Since there is no new value created on the FX market, there is no collective market return either (Johnson, 2009). However, if the starting point is the opposite, assuming that the EMH is not applicable to the FX market, it would indicate that it would be possible for a skilled investor to generate a value over the expected return of zero.
Later research has shown that the EMH fails to describe how the FX market functions. As a result, economists have started to question the applicability of the EMH to the FX mar-ket (Neely, 1997).
Eichenbaum and Evans (1995) found that the FX market adjusts sluggishly to new infor-mation, instead of instantly reflecting the new information in exchange rates.
Dryckman and Morse (1986) concluded that the EMH was not applicable on any financial market due to the lack of knowledge of the majority of participants. Even if all information necessary to make the correct decision are present for all investors at the same time, a large part of them lack the skill to understand the information and use it to make correct deci-sion. This implies a possibility for participants qualified enough to create a stable return on investments. Hafeez (2007) researched the segmentation of the FX market and found that
approximately 24-49 percent of the participants are profit-seeking.1 Even with this conser-vative approach it becomes evident that the FX market is very different from other finan-cial markets in that at least half of the participants engage without any intention of making a profit on their investment (Hafeez, 2007). This would in theory make it possible for the profit-seekers to turn a profit from the participants seeking to trade the currency for other reasons, the liquidity-seekers. Hafeez (2007) researched the distribution of profit and loss and found that the profit-seekers have collectively earned profit while the liquidity-seekers collectively had losses (Figure 6).
Another closely connected subject to what Hafeez (2007) and Dryckman and Morse (1986) found about the inapplicability of the EMH on FX markets is what is usually referred to as central bank intervention. In an attempt to steer inflation and employment rates, some cen-tral banks will engage in the FX market. Since this sort of intervention derives from macro-economic and political motives, instead of making money, the central bank may be willing to incur a loss. The losses incurred by the central banks may in turn end up with the skilled investors (Neely, 1997). Neely and Weller (1997) found that intelligent trading rules usually buy dollars if the Federal Reserve sells, and vice versa.
Grossman and Stiglitz (1980) researched the efficiency of markets and found that a market cannot be perfectly efficient. An exchange rate is governed by fundamental values, such as interest rates, national price levels and public debt levels. Gathering and analyzing this in-formation for traders is costly and time-consuming. Therefore, traders would not succumb to this allegedly futile way of trading, unless they were able to profit from it. But according to the EMH, no prediction of future changes in exchange rates can be made on perfectly efficient markets. This problem with the EMH was called the ‘paradox of efficient mar-kets’.
These studies show that the FX market is distinct from other financial markets, and call into question the applicability of the EMH on the FX market, which means that there may well be a possibility to earn stable profit from investments.
2.1.4 Technical analysis on the foreign exchange market
TA as a method of trading has become widespread within the FX market. Neely (1997) concludes that TA is the most widely used trading strategy in the FX market. Park and Irwin (2004) conclude that TA works best on FX market, compared to futures markets and stock markets.
Taylor and Allen (1992) report that more than 90 percent of FX dealers in London use some form of TA to inform their trading decisions and 60 percent consider TA to be at least equally important to fundamentals when generating exchange rate predictions. In an-other survey, Lui and Mole (1998) found that over 85 percent of the respondents, all of which were FX dealers in Hong Kong, rely on both FA and TA. TA was more popular at shorter time horizons. Similarly, Hutcheson (2000) found that TA is better at explaining short term movements in rates. In an overview of the empirical studies in the area, Park and Irwin (2004) found that most survey studies indicate that TA has been widely used by market actors in FX markets. At least 30 to 40 percent of practitioners considered TA
1 It should be noted that a very conservative approximation approach was used, i.e. all unknown trades were
categorized as profit-seeking including hedging strategies. Hafeez therefore assumed that a more reasonable approximation would rather be in the range 5-25 % (See Figure 5 for a visualization of the segmentation).
portant when determining price movement at shorter time horizons up to six months. Bearing in mind that there was very little evidence 30 years back of TA even working, one might ask: why then has TA become so popular on the FX market? A simple explanation to the noticeable popularity could be that it is profitable (Rubio, 2004). A few studies have researched the profitability of TA on the FX market.
LeBaron (1999) found reliable evidence that simple rules used by traders have some predic-tive value over the future movement of foreign exchange prices.
Using technical trading rules in the FX market for a period of 15 years, Neely, Weller and Dittmar (1997) found that the applied trading systems created noticeable excess returns for all six of the studied exchange rates.
Neely (1997) applied 10 different trading rules to the dollar/deutsche mark exchange rate during a sample period of 23 years, and found that nine out of ten of the trading rules were profitable.
Some empirical studies have focused on the time aspect of profitability. As the FX market has become a more crowded playground for profit-seeking investors, doubts regarding the profitability of TA on the FX market have grown more valid. There are plenty of empirical studies showing that TA in FX markets has been profitable, before the mid 1990s (Taylor 1992; Olson 2004). Some studies imply that the profitability of TA in FX markets have un-dergone a decline in recent years (Neely & Weller 2001; Olson 2004). As transactions costs decrease, available computing power increases and the number of profit-seeking market participants increase, it could be argued that TA on the FX market may not work as great as it used to (Sewell 2007). However, there are also studies pointing to the contrary, arguing that even though the profit seekers are increasing fast in numbers, they are in total declin-ing in percentage because of the even faster increasdeclin-ing number of participants conductdeclin-ing cross-border trade (Hafeez, 2007).
Instead of dismissing TA as astrology, as was done in the 1970s, there is now empirical evidence on the profitability of technical trading rules. This has lead economists to recon-sider concerning the impact of institutional features that might justify TA, such as private information, central bank intervention, sequential trading and the role of risk (Neely, 1997). The speculation on the FX market is growing rapidly and investors are now targeting this zero-sum game. Since the TA methods have improved and the automatic algorithm trading has increased in popularity the possibility to exploit the market and earn profit has arisen (Hafeez, 2007). Fast execution time, strict automated trading rules and new technology make it possible to speculate on the FX market which earlier was regarded as too fast and difficult to invest in (Johnson, 2009).
2.2 Spectral Analysis
2.2.1 Introduction to Spectral Analysis
The purpose of spectral analysis is to identify all the sine waves within a signal in order to be able to find the dominant cycle. By processing the gathered price data, a spectral analysis transform measures all the existing waves by their occurrence and amplitude to determine the frequency of the most common wave with the highest amplitude, defined as the domi-nant cycle.
The most used visualisation of the price and performance of any financial instrument is the value in respect of time. This presentation is defined as the time domain and provides in-formation about value over time. Another approach to the same function is to bring the function from the time domain into the frequency domain where the power of the signal is visualized in respect of frequency instead of time. The calculation that brings a function from the time domain to the frequency domain is the Fourier transform and analysis of the function in the frequency domain is defined as spectral analysis.
2.2.2 Application of Spectral Analysis in Finance
Spectral analysis in finance was first tried out in the 1970s where it was done manually without the help of algorithmic trading. It is not until recent years, influenced by the tech-nological development, that it has been applied more than experimentally and even as of today; technical traders use it modestly. The tools of spectral analysis are not designed to be applied in finance and have received criticism for being too slow (Ehlers, 2002). It was not until recently the tools were thoroughly refined to fit financial markets.
Hurst (1970) used a transform of spectral analysis called Discrete Fourier Transform (DFT) to make investment decisions. In an actual trading experiment using his newly-found technique, Hurst managed to produce an average return on investment of 8.9 per-cent on an average of 9.7 days (Hurst, 1970). This would implicate a yearly yield of over 2 470 percent and thereby outperforming by far any buy-and-hold strategy. Hurst explained the reason for the performance to be the opportunity to make shorter trades with higher leverage when the timing due to the spectral analysis is optimized. The accumulated interest will then create an impressive yearly yield.
Ehlers (2002) researched the use of the Maximum Entropy Spectral Analysis (MESA) on 50 selected stocks from 1998 to 2001. With a total of 116 trades Ehlers’ system made 62.9 percent profitable trades with a profit factor of 5.88. This outperformed the buy-and-hold strategy as well as the same technical trading strategy without the adaptive MESA input. Dunis and Miao (2006) researched the existence of cyclical properties on the FX market using spectral analysis. They used spectral analysis to find when the market was in an oscil-latory mode and used different settings for the TA tools depending on the result of the spectral analysis. When the market went sideways, a non-trading filter was used since all their TA tools were meant to measure trends and not momentum. They concluded that the use of a spectral analysis filter significantly improved the performance of the traditional technical trading models on the FX market since they were used in their right environment. Brooks and Melvin (2006) measured intra-day cycles on the FX market by using DFT. They found eight and 15-hour cycles on almost every currency pair and they suggested that the existence of three major markets (New York, London, Japan) with different opening hours created cyclic trade volumes which made the price movement cyclic as well. They thereby concluded that trading a currency pair during its original market (yen on the Asian market etc.) was more volatile and therefore included higher risk, but could also result in higher returns on short intra-day trading. The eight hour cycle was present for currency pairs from the same market and 15-hour cycles were present when the currency pair from two of the three markets was traded.
In conclusion, there seems to be a consensus among academics about the existence of dominant cycles on the FX market which create possibilities for investors to earn small but fast profits by identifying them. The key to successful trading is therefore to find a good method to find the cycle to be able to improve transaction timing, which is crucial when
trading on small fluctuations with high leverage (Hurst, 1970). Naturally, the use of spectral analysis has been researched as the method to measure these short-term cycles since it has been applied in physics to perform similar tasks. With the increased computing power spectral analysis has been adopted quickly and the need for more advanced methods and calculations are being investigated to make more precise estimates of the future price movement (Ehlers, 2001). Different approaches to use spectral analysis on different mar-kets has been performed, the measurement of the cycle has been used as non-trade filters (Dunis & Miao, 2006), complete trading rules based on turning points (Ehlers, 2002) and in combination with regression lines (Hurst, 1970). All together they succeed to improve technical trading on any market since spectral analysis makes it more adaptive and will make any system relying on identifying the cycle more accurate as long as the transform method is fast enough (Ehlers, 2001). Still there is a need for more advanced spectral analy-sis methods and research to determine how to best use the information provided by the analysis.
2.2.3 Trigonometric curve fitting and Regression analysis
As described by Isaac Newton in 1687 every function of time is regarded as a signal pos-sible to describe through a mathematical function (McElroy, 2005). This makes the cur-rency exchange rate as a time series comply with the same mathematical rules as regular sound or trembles from an earthquake. This basic assumption is important to understand because even though the cause and behaviour of the signal is very different the tools to analyse their characteristics are still the same.
In 1822 the French mathematician Joseph Fourier first claimed that any function, continu-ous or discontinucontinu-ous, is possible to describe mathematically through the use of only sine functions (McElroy, 2005). By studying the flow of heat he realized that the sine waves are the only building blocks required to attain any signal how irregular it might seem at first glance. This simplified the area of trigonometric series in analysis introduced by Leonard Euler in 1753 (McElroy, 2005).
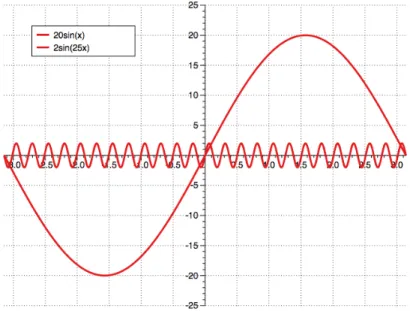
All sine and cosine functions have three parameters to determine the characteristics of the wave; the amplitude, phase and frequency. The amplitude is the magnitude of change within each oscillation and is measured as the vertical distance between the highest point of the sine wave and the median. The phase is the horizontal shift of the sine wave and cor-responds to the offset at time x=0. The frequency is the number of times the sine wave os-cillates during a full 360° interval (Boggess, 2001). From the frequency we can find the pe-riod, which is (1/frequency). The period is therefore the length on the x-axis required for a sine wave to perform a complete oscillation.
In Figure 1 the functions 20sin(x) and 2sin(25x) are plotted to make a simple example of the characteristics of the sine wave. The first sine wave has an amplitude of 20 and a fre-quency of one, making it vibrate only once during the 360° interval (between –π and a π) with a height of 20 units. The second sine wave has a frequency of 25 making it vibrate 25 times more than the previous one but with lower amplitude of just 2 units. None of the two sine wave has any phase that otherwise would shift the waves on the x-axis.
Figure 1: Plot of 20sin(x) and 2sin(25x)
In Figure 2 the two sine waves in Figure 1 are combined to a single signal. This signal is an example of how the combination of only sine and cosine is necessary to construct any sig-nal by combining sufficient amount of waves with the right amplitude, phase and fre-quency.
Figure 2: Plot of 20sin(x)+2sin(25x)
Hurst (1970) was first to investigate how the cycles could be measured and used to deter-mine the direction of any financial market. Hurst concluded that when the frequency of the cycle with the highest amplitude, the dominant cycle, is known it is possible to draw a re-gression line to define the movement and direction of the trend. This line, known as the least-square-error straight line (Hurst, 1970), is the linear regression of the sample points present within one period of the dominant cycle. If the line is horizontal it indicates that the market is ranging sideways and price is moving in cyclic oscillations around the trend line. This is true for about 23 percent of all price motion making the movement of the price semi-predictable (Hurst, 1970). If the market is ranging sideways the price will move oscillatory making it possible to predict the turning points and make small put frequent
profits. However, to find the dominant cycle and perform the curve fitting it is necessary to understand the Fourier transform of a function and how to analyse the function in the fre-quency domain.
2.2.4 Fourier Transform and the Frequency Domain
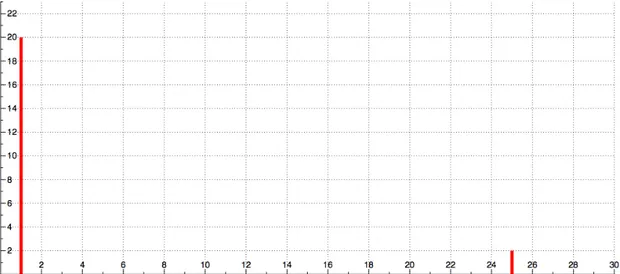
The Fourier transform is a process where a function of time is decomposed into a set of orthogonal cyclic components of different frequencies and amplitude (Dunis & Miao, 2006). This is done by fitting the signal into a series of sine waves resulting in a visualiza-tion of the signal in the frequency domain. The frequency domain visualize the signals am-plitude as a function of frequency instead of time and is an easy way to discover the differ-ent sine and cosine waves a specific function is composed by. In Figure 3 the signal used previously, 20sin(x)+2sin(25x), is transformed into the frequency domain and the presence of two different sine waves with the frequency one and 25 and the amplitude of 20 and one becomes clear. The representation of a function in the frequency domain consists of ex-actly the same information as the same function in the time domain, but examined from a different viewpoint. The visualization of a function in both domains often contains the key to successful problem solving (Brigham, 1988). A seemingly irregular scatter of sample values might with the use of a Fourier transform become much clearer and the frequency with the dominant amplitude can be identified and all frequencies with low amplitude might be subtracted from the function to remove the noise they contribute with in the sig-nal. This technique is widely used to find the correct signal in environments where factors disturbs the transmission and adds noise. When there is no obvious dominant cycle and the power of the different frequency are fairly evenly distributed we have a random signal also known as white noise. This is how the signal always would behave if the market was per-fectly efficient and the random walk theory would apply. By doing spectral analysis it is possible to identify when the market is not behaving randomly.
Figure 3: Fourier Transform of 20sin(x)+2sin(25x)
Even though the transforms are named after Joseph Fourier the development of the calcu-lations begun before he was even born. The use of trigonometric series in analysis origi-nates from the Swiss mathematician Leonard Euler who introduced the concept amongst other important contributions to mathematics in 1753 (Heidman, Johnson & Burrus, 1970). His work was later extended by the French mathematician and astronomer Joseph Louis Lagrance in 1759 who published the first transform calculation (McElroy, 2005). Since then, various forms of Fourier transform has been developed and used in a wide area
of applications. But even though there are several different types of Fourier transforms used to visualize a signal in the frequency domain, the purpose of these different trans-forms are mainly the same. They are only developed for different purposes and for differ-ent types of signals. The most important diversification of signals is the continuous-time and discrete-time signals. Another important difference is the signal being periodic or aperiodic where the periodic signal has an infinite nature and can be found at any point in time. The aperiodic signal is based upon observed sample values and has a finite nature. In Figure 4 the four main types of Fourier transforms, their formulas and the type of signal that they apply are presented. The mathematical derivation of the Fourier transform is present in Appendix 1.
Cooley and Tukey (1965) introduced the fast Fourier transform making it possible for computers to calculate large amount of data fast to perform discrete Fourier transform. With this new algorithm the spectral analysis gained a lot of attention and was quickly ad-opted into various sciences and new areas of application. Five years later Hurst published his findings bringing the spectral analysis into predicting the cycles of financial markets (Hurst, 1970). He concluded that all signals in finance are discrete and aperiodic making the use of the discrete time Fourier transform suitable for finding the sine and cosine waves.
2.2.5 Spectral Resolution and Maximum Entropy
Successful spectral analysis requires not only the use of the correct Fourier transform and thorough analysis of the frequency domain but also sufficient amounts of previous data. The number of sample points used in a discrete time Fourier transform will affect the spec-tral resolution in the frequency domain. The specspec-tral resolution is defined as the clarity of the spectrum. If the number of data samples are 64, the longest cycle length the discrete time Fourier transform are able to measure has a frequency of 64, the next longest is 64/2 and the third 64/4 and so on (Ehlers, 2002). This makes the gap between the possible fre-quency very high and the resolution low if not large amount of data points are used in the transform.
Ehlers (2001) realized that this lack of resolution would distort the performance of Fourier transforms in finance. He concluded that the requirement of large amount of data points makes the discrete time Fourier transform unreliable for applications on fast moving mar-kets as the currency exchange market. To obtain a high spectral resolution the DFT re-quires large amounts of sample points. This makes the transform calculate the spectrum for a larger timeframe include high-amplitude cycles that occurred several hours ago when the market had different volume of trades. This results in to large dominant cycles and a more evenly distributed range of frequency making it similar to random white noise.
As a solution to this problem Ehlers (2001) suggested the use of the principle of maximum entropy to obtain a higher resolution without adding more sample points. By this he intro-duced the MESA to finance. This transform takes the noise in a spectrum and uses the principle of maximum entropy to estimate the spectrum thus improving the spectral accu-racy. This more modern and advanced transform method is theoretically more suitable for the FX market due to its ability to increase spectrum resolution based on estimates.
3 Method
In this chapter we will discuss the process of how the research has been conducted. The chapter is divided into two major parts; the theoretical method and the practical method. In the theoretical part of the method, the choice of method is presented and explained, after which the literature selection is discussed. Finally, the va-lidity and reliability of the thesis is presented and scrutinized. The practical method allows the readers to fol-low the practical aspects of the working process and evaluate for themselves the validity and reliability by reading about the frames of the experiment such as chosen trading rules and chosen market. Moving on, the selection and retrieval of the data is scrutinized. Lastly, the different ways in which the data is processed and analysed to meet our purpose is explained.
3.1 Theoretical method
3.1.1 Choice of method
There are different strategies and approaches to write a thesis. An inductive approach means that that the scientist starts collecting empirics without any expectations and pro-ceeds to draw conclusions and create theories from the findings. Another strategy is the deductive approach, which means that the scientist sets off from theory and end with em-piric data. This means that the working process starts with creating expectations, followed by collecting empiric data to see whether or not the empiric data correspond to the expec-tations (Jacobsen, 2002). This implicates that the expecexpec-tations can be a hypothesis that em-pirically can be tested in the specific case (Patel & Davidson, 2003).
Our purpose is to investigate if it is possible to create a higher and more stable return on investment on the FX market by using spectral analysis on existing technical trading tools. We have used data collected from an 11-month period and tested four different algorithms with different trading rules. One algorithm is static and uses only TA while three of the al-gorithms incorporate spectral analysis, making it adaptive. Our study is therefore a com-parative study between the technical static tool and the same technical tool after adding spectral analysis. We started by programming the trading rules as an automatic trading al-gorithm and then submitted them for testing retrospectively on gathered currency data. We also had an assumption about the findings that resulted in a hypothesis. Hence, our ap-proach is deductive.
Our hypothesis is that by adding spectral analysis the return on investment will be both higher and more stable due to the theoretical ability of spectral analysis to find the domi-nant cycle and adapt the trading to it. When having a defined prediction or assumption that can be tested empirically and that can be falsified; what is claimed is a hypothesis (Jacobsen, 2002). Within a problem area where a great amount of education and theories have been developed, the study will be a test of the hypothesis (Patel & Davidson, 2003). To test a hypothesis means that there is enough knowledge within the area, and it is therefore pos-sible to write a hypothesis and make assumptions about relations in the reality (Patel & Davidson, 2003). The possibility to prove or to disprove a hypothesis is embedded within the notion itself (Denscombe, 2004).
Within the scientific field of research there are two main methods for collecting and analyz-ing data: qualitative and quantitative research. The choice of method is dependanalyz-ing on the nature of the study and the result desired (Patel & Davidson, 2003). Quantitative and quali-tative study is related to what kind of information is gathered: numbers (which are quantita-tive) or words (which are qualitaquantita-tive) (Jacobsen, 2002). Our purpose is to investigate if it is
possible to create a higher and more stable return on investment by using spectral analysis added to existing technical trading tools. To reach our purpose and conclude if the use of spectral analysis will make the performance better and more stable, we need to analyse the performance of a technical trading strategy with and without the application of spectral an-alysis. A qualitative approach to reach our purpose would be to find FX fund managers and interview them about their experience with spectral analysis and its contribution to TA. We are not using a qualitative approach in this study. We obtain data to compare by simulating periods of trading, which makes it possible to evaluate and analyse the performance of ap-plying different trading rules. These simulations will use only raw FX data downloaded from an actual FX broker and processed by a backtesting platform that will simulate the outcome of using the stipulated trading rules. This is a quantitative approach to reach our purpose and the most accurate way to perform our study since it will give us the exact dif-ference in performance and stability of different trading strategies performed by the same system on the same data. Hence, to reach our purpose we will use a quantitative research method.
3.1.2 Literature selection
We conducted a literature search in the university library in order to find relevant literature to our topic. TA has been widely discussed for decades amongst scholars, ranging from studies concerned with a theoretical approach regarding the possibility of profitability to profound practical guides on different trading techniques and systems. Our particular sub-ject, spectral analysis on the FX market, has been around for decades but it was considered only a theoretical possibility due to the lack of platforms able to actually perform the calcu-lations in real time. In the wake of the increasing computing power and the recent in-creased profit-oriented investing on the FX market, spectral analysis on the FX market has just recently become an area of serious research. Therefore, the material within the particu-lar subject is limited - only a few books have been written on this topic. We are aware that the objectivity is depending on the amount of sources and we have searched actively for ar-ticles in high quality journals that are up to date on the subject.
3.1.3 Validity and Reliability
There is a lot of background material in the area dealing with theories and hypothesis on the economic market. However, when it comes to our specific subject, spectral analysis on the FX market, the material is limited. We are aware that the objectivity is depending on the amount of sources and we have tried not to be too influenced by certain material, how-ever, complete objectivity is impossible.
When it comes to the quality of quantitative studies it is crucial that the collected data is valid. Generally, validity is related to the data used in the research and the analysis of such data. Further, validity is also concerned with the accuracy and the precision of the ques-tions that are subject to experiment and the data collected (Denscombe, 2004). When col-lecting information of quantitative nature, for example screening numbers or data, it is im-portant to show that the gathering of data is complete, not selective and not distorted in any way. It is essential to use all of the data collected within the 11-month period to get an accurate and reliable result. Since the algorithm is set to gather all data within the time pe-riod, it does not choose what kind of data to collect or dismiss and the empirical findings are therefore complete in the sense that no information is missing or absent. The selection of the studied 11-month period is made without any analysis beforehand and the period should be sufficiently long to include possible seasonal fluctuations and specific macroeco-nomic impact.
Further, it is also important to be aware of the usefulness of the data collected and under-stand how to analyse it (Burell & Kylén, 2003). The question is consequently if we can an-swer our purpose in a representative and valid way by using the gathered information. We think that we have covered the fundamental parts in this research and that we objectively can analyse the result.
When it comes to reliability the most central part is what kind of methods we have used to collect the data and the interest of how to keep it stable and not to distort the result of the research. Further, the reliability is concerned with the process of the research and to give a result which does not vary from time to time (Denscombe, 2004). Hence, the reliability of the instruments is depending on how stable the measuring device is (Burell & Kylén, 2003). The tools we have used can give a different result depending on the time period. For ex-ample, another 11-month period could give another result. However, it is still possible to see the trend and how stable the return on investment is in a longer time period, which is the purpose of this study. In addition, the algorithm decides when and how to trade by es-tablished rules set in advance. Even so, the study requires some static selections and deci-sions to be made by us, and this will inflict on the performance and stability of the chosen method. On the other hand, since the study focuses on the difference between adding spectral analysis and using static input, all selections are meant to inflict equally. This means that no selections will distort the analysis of the relative comparison between the static and the different adaptive empirical data collected. Still, it is necessary to make some selections since the trading strategy need to be strict to be able to mathematically backtest and com-pare the gathered results.
To get the empirical findings of this study, we have used a trading platform installed on a server. We have downloaded data from a FX broker retrospectively and afterwards simu-lated the result if we had invested following strict trading rules from the beginning. We have downloaded the data from an 11-month period and tested four different algorithms with different trading rules.
Finally, it would be interesting to compare our findings with other markets or other ex-change rates but due to the limitations of the thesis, this has not been possible.
3.2 Design of experiment
3.2.1 Introduction to the experiment
To get the empirical findings in this study, we have used a trading platform installed on a server. This means that we have downloaded data from an FX broker retrospectively and afterwards simulated the result that would have been if we invested in it from the begin-ning. We have downloaded the data from an 11-month period and tested four different al-gorithms with different trading rules. The algorithm decides when and how to trade by es-tablish rules set in advance.
3.2.2 Choice of technical trading method: Commodity Channel Index
The choice of a specific TA tool is required to represent TA in general. This study uses the Commodity Channel Index (CCI) due to its characteristics of using one full sine wave as required input. Usually this input is set as 20 bars making it an average length of the cycle. The CCI uses standard deviations to measure the distance between the moving average and the actual price making sell and buy signals two standard deviations from the average. This is supposed to be the turning points, and therefore the amplitude, of the cycle and a suit-able level to open trades. Generally the signals are described as a turning point where the
price movement either reverses or continues creating a trend. In this study we have a time filter making the algorithm active only during hours where a trend is unlikely.
The CCI originates from an article by Donald Lambert who developed the CCI to identify cyclical turns in commodities (Lambert, 1980). Traders soon realized the value of the model and started to use it as part of their TA to identify price reversals, price extremes and trend strength. The formula, Figure 7, consists of the price minus the moving average of the price divided by the standard deviation. This ratio is multiplied by a constant (1/0.015) to make the levels more easy to apprehend by making the signal levels at +200 and -200 for two standard deviations.
Figure 7: Commodity Channel Index
This TA indicator is commonly used and similar to many other channel-based indicators designed for oscillatory (sideways) markets. It uses the static input from the investor as the length of one cycle and tries to measure the amplitude from that input based on previous price movement. Almost all indicators of this type has the same general purpose, but use different calculations to find the amplitude, thus making the overall result different be-tween the choice of TA indicator. The relative difference bebe-tween using spectral analysis or not should still be the same. Therefore we find it sufficient to use only one TA indicator in our study since they would all render the same conclusions.
3.2.3 Choice of Spectral Analysis Transform Methods
The study uses three different transform methods to perform the calculations necessary to find the dominant cycle. These are DFT, MESA and Hilbert transform. The selection of these methods are based on literature describing characteristics of the different transforms making them suitable for determining trend and cycles on financial markets.
The DFT is the general transform used in various applications and recommended in litera-ture to be used with TA. Several early studies have been performed with DFT or similar transforms and it is suitable to use this transform in our study to be able to compare it with previous research. However, the DFT is designed for calculations on large sets of data that does not change over time as much as the financial markets and has therefore been rejected as to slow for trading applications (Dunis & Miao, 2006; Ehlers, 2001). In an experiment testing spectral analysis this transform is necessary to include since it is the most basic and most widely used transform of all (Brigham, 1988).
The Hilbert transform is suggested by Ehlers (2001) as a simple and straightforward method to find the dominant cycle even thought it might be too blunt for the financial market. The Hilbert Transform uses very small amounts of data compared to the DFT and does not require even a full-length cycle within the samples to measure the frequency of the wave (Ehlers, 2001). The transform uses the small amount of data available and draws a full series of sine waves by using regression analysis. It estimates how the signal probably looks like and then performs the spectral analysis on the rendered, longer signal (Kaufman, 2005). To include this transform in the study makes it possible to test if this is a solution