http://www.diva-portal.org
This is the published version of a paper published in Open Biotechnology Journal.
Citation for the original published paper (version of record):
Mara, G., Olga, C., Marita, G., Karlis, S., Nehrenheim, E. et al. (2015)
Application of FT-IR Spectroscopy for Investigation of Pink Water Remediation by Pine Bark.
Open Biotechnology Journal, 9
http://dx.doi.org/10.2174/1874070720150430E007
Access to the published version may require subscription.
N.B. When citing this work, cite the original published paper.
Permanent link to this version:
Send Orders for Reprints to reprints@benthamscience.ae
The Open Biotechnology Journal, 2015, 9, 1-5 1
1874-0707/15 2015 Bentham Open
Open Access
Application of FT-IR Spectroscopy for Investigation of Pink Water
Remediation by Pine Bark
Mara Grube
1, Olga Chusova
2, Marita Gavare
1, Karlis Shvirksts
1, Emma Nehrenheim
2and
Monica Odlare
21Institute of Microbiology and Biotechnology, University of Latvia, 4 Kronvalda Blvd., Riga LV1010, Latvia 2School of Business, Society and Engineering, Mälardalen University, P.O. Box 883, SE-721 23 Västerås, Sweden
Abstract. This study demonstrates the application of FT-IR spectroscopy for investigating the remediation of pink water
with the low cost adsorbent pine bark. The removal of 2,4,6-trinitrotoluene (TNT) from pink water by adsorption to pine bark was accompanied by a reduction in intensities of peaks at 1544 and 1347 cm-1 in the spectra of acetonitrile extracts of the pine bark. Hierarchial cluster analysis differentiated samples with high (30-180 mg/L) and low (0-4 mg/L) TNT concentrations, demonstrating the potential of this approach as a quick screening method for the control of the removal of TNT from pink water. The amount of lignin in pine bark was inversely proportional to the size of the pine bark particles, while the concentration of phenolic hydroxyl groups increases with increasing size of pine bark particles. FT-IR spectra showed that as well as TNT, pine bark can also adsorb nitramine explosives such as RDX and HMX.
Keywords: Adsorption, FT-IR spectroscopy, explosives, lignin, low-cost adsorbent, pine bark, pink water, TNT
INTRODUCTION
Pine bark, a timber industry residue, has been successfully used as a low-cost adsorbent for removing heavy metals from landfill leachates [1], pink water [2] and stormwater [3]. This adsorbent has also been studied for the removal of organic pollutants such as PAHs [4], bisphenol [5], estradiol (E2) [6] and lindane [7] from contaminated water. Chusova et al. [8] showed that pine bark can effectively remove TNT from pink water, a wastewater generated during the process of demilitarization of explosives at army ammunition plants.
The most frequently used method for the treatment of pink water in Sweden today is adsorption on activated carbon, which as well as being costly, creates sludge that must be incinerated off-site [2]. Our previous research [8] showed that biotransformation of TNT in the presence of pine bark has potential as a possible substitute for conventional granular activated carbon treatment of pink water. However, additional research is needed to evaluatethe economic feasibility of pine bark for the treatment of pink water, its affinity toward compounds other than TNT constituents and the necessity of pine bark pre-treatment to enable higher treatment efficiency and safety. Lignin is anticipated to be the main contributor to adsorption by the pine bark [9]. Acidic leachates of pine bark, caused by desorption of water-soluble phenolic acids, are toxic to some aquatic organisms [10,11]. Increasing the lignin content and reducing the amount of phenolic acids in pine bark will thus
*Address correspondence to these authors at the Institute of Microbiology and Biotechnology, University of Latvia, 4 Kronvalda Blvd. Riga LV1010, Latvia; Tel/Fax: + 371 67034885; E-mail: kshvirksts@gmail.com
positively affect both the treatment efficiency and ecotoxicological safety of the adsorbent.
Numerous laboratory and on-site studies and analysis are needed to address the research questions raised by these issues. Therefore there is a need for low cost and environmentally sound analytical tools. Fourier transform infrared (FT-IR) spectroscopy is a time saving method that requires a relatively small amount of sample and no sample pre-treatment, and information about all components is gained simultaneously. The FT-IR spectrum can be used for both qualitative and quantitative analyses of chemical components and is thus highly informative for analysis of multicomponent samples. FT-IR spectroscopy is thus a well-regarded analytical method for evaluation, monitoring and analysis of various biotechnological processes [12-15].
The main objective of this study is to investigate how low-cost FT-IR spectroscopy can partially replace expensive
high-performance liquid chromatography (HPLC) in
studying pink water remediation by pine bark. The two specific aims are to establish how the amount of lignin and phenol groups in pine bark changes depending on the particle size, and to investigate what explosives other than TNT are removed from pink water by pine bark.
MATERIALS AND METHODS
TNT-contaminated industrial sludge was collected from the treatment plant at the demilitarisation factory Nammo Vingåkersverken AB (Vingåker, Sweden, 59°60′N, 16°56′E) directly before the activated carbon batch adsorption step. The sludge was transported to the laboratory as a 1:5 mix with water for safety reasons. Because of the high solid particle content, the solution was decanted and the water
2 The Open Biotechnology Journal, 2015, Volume 9 Gulbe et al.
phase, subsequently referred to as pink water, was filtered (Vacuum Filtration System, 0.22 µm, VWR, USA) before the batch experiment. Pine bark, provided by Zugol AB (Falun, Sweden), was used as received or sieved to obtain ≤ 1 mm, ≤ 0.045 mm and ≤ 0.025 mm fractions. EPA 8330 Mix A high-performance liquid chromatography (HPLC) standards containing 100μg/mL of 2,4,6-trinitrotoluene (TNT), 2-amino-4,6-dinitrotoluene (2-ADNT), 1,3,5-trinitrobenzene, hexogen (RDX), octogen (HMX), 1,3-dinitrobenzene and 2,4-dinitrotoluene in acetonitrile (ACN) were purchased from AccuStandard (New Haven, CT, USA). Isolation and Culture Conditions of Inocula
A mixed culture was collected from a municipal wastewater treatment plant in mid-Sweden (59°60′N,
16°56′E). Two cultures were enriched for three weeks with glucose (0.2% w/v) in an anaerobic jar on a horizontal shaker at 130 rpm and 28 °C. The first culture, subsequently referred to as In1, co-metabolised TNT (0.4 mM), while the second culture, referred to as In2, co-metabolised the previously described TNT-contaminated industrial sludge mixed with water (1.5 - 2.0% v/v). The cultures were transferred weekly into fresh mineral salt medium M9* [8] containing glucose and TNT in the case of In1 and glucose and sludge particles in the case of In2.
Batch Experiment Setup
100 mL crimp-top serum bottles were filled with 70 mL of pink water and amended with 0.2% w/v glucose solution and 1.75 g pine bark according to the experimental setup shown in Table 1. Anaerobic conditions were initiated by purging the headspace of the bottles with nitrogen. Media (as defined in Table 1) were then inoculated through the septum with liquid cultures (2.0% v/v) of inocula In1 and In 2. As In 1 and In 2 were expected to have quite similar effect in treated batches, In1 was not tested in the presence of pine bark due to experimental space and technical conditions limitations. The bottles were incubated on a horizontal shaker at 130 rpm and 28°C. One of each replicate was taken as a sample on Day 7 and a second was taken on Day 14.
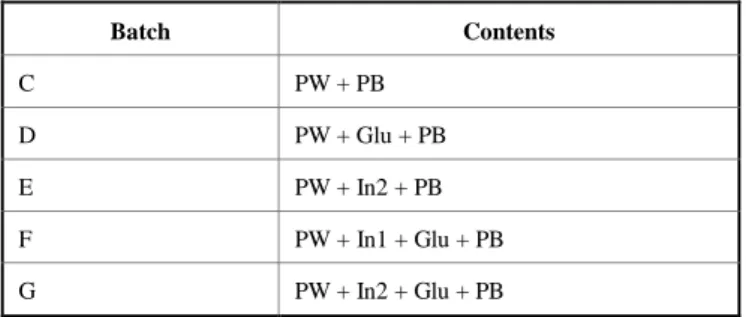
Table 1. Batch experiment treatments. Abbreviations: PW - pink water; In1, In2 – inocula; Glu - glucose; PB - pine bark. Batch Contents C PW + PB D PW + Glu + PB E PW + In2 + PB F PW + In1 + Glu + PB G PW + In2 + Glu + PB
Pine Bark Affinity Toward Explosives Other Than TNT At the end of the experiment pine bark from batch C was extracted with acetonitrile (see section Sampling). FT-IR spectra of the ACN extracts of batch C, mixA and TNT
HPLC standard were recorded and the average spectra from two replicates were analyzed.
Comparative Analysis of Different Pine Bark Fractions 0.7 g of each pine bark fraction, i.e. unsieved pine bark, ≤ 1.000, ≤ 0.045 and ≤ 0.025 mm, was weighed into eppendorf tubes to which 800 µL of ACN was then added. The pine bark constituents were extracted for 4 hours by horizontal shaking at 1000 rpm at room temperature. After centrifugation the supernatants were transferred to new eppendorf tubes and stored at -20 ºC until further analysis. Each sample was run in duplicate.
Sampling
Samples for HPLC and Fourier transform infrared
(FT-IR) spectroscopy were taken from both liquid and solid
phases (pine bark) throughout the experiment. Liquid phase (i.e. supernatant) sampling was performed by piercing the septum with a hollow needle and withdrawing approximately 1 mL of medium after mixing all the components and briefly shaking by hand at the beginning of the experiment (Day 0), and subsequently on Day 1, Day 3, Day 7 and Day 14.
In order to obtain extracts of pine bark (EPB), samples of the solid phase were taken on Day 0, Day 7 and Day 14. For sampling, one of the each triplicate was centrifuged at 5,000 rpm and 4 °C for 10 minutes. The supernatant was removed and 0.5 g (wet weight) of the pine bark from each sample was mixed with 800 µL of ACN. TNT and metabolites were extracted from pine bark by horizontal shaking for 3h at room temperature. All supernatant and EPB samples were stored at -20 °C for further analyses.
FT-IR Spectroscopy
FT-IR absorption spectra were recorded on a VERTEX 70 coupled with the HTS-XT microplate reader extension (Bruker Optik GmbH, Ettlingen, Germany). Samples were dried on a 384 well silicon plate at T<50 °C. Transmission spectra were collected between 4000-600 cm-1 and displayed as absorbance spectra. Spectra were acquired at a resolution of 4 cm−1, and 64 spectra were coadded. Each spectrum was baseline corrected by the rubber band method and CO2 bands
were excluded. Only spectra fitting within the absorption limits between 0.25 and 0.80 (where the concentration of a component is proportional to the intensity of the absorption band) were used for data analyses. Measurements for each analytical sample were performed at least in triplicate. Data were processed using OPUS 6.5 software. The second derivative spectra were evaluated and Wards algorithm was used for Hierarchial cluster analysis (HCA).
HPLC Analysis
For detection and confirmation of TNT and its metabolites, HPLC was performed with the Agilent Series 1100 LC/MSD Trap XCT LC-MS system equipped with an in-line degasser, a binary pump, an autosampler and a column thermostat (Agilent Technologies, Santa-Clara, CA, USA). A photodiode array detector ( 254 nm) and ESI-MS were used for detection. Chemstation (Rev.A.10.02) and LCMSD Trap Control (Version 5.2) software were used for
Vertex PI Index and Szeged Index of Certain Special Molecular Graphs The Open Biotechnology Journal, 2015, Volume 9 3
data acquisition and analysis. Nitroaromatics quantification was performed based on eight known concentrations of external standards of 2,4,6-trinitrotoluene (TNT), 4-amino-2,6-dinitrotoluene (4-ADNT), 2-amino-4,6-dinitrotoluene (2-ADNT), 2,4-diamino-6-nitrotoluene (2,4-DANT), and 2,6-diamino-4-nitrotoluene (2,6-DANT) (AccuStandard, New Haven, CT, USA). Nitroaromatics were separated on a Synergi Hydro-RP 80 Å column (4.60 mm x 250 mm, 4 μm; polar endcapped stationary phase) (Phenomenex) with a 4.0 mm x 2.0 mm guard cartridge, polar endcapped C18 (Phenomenex) using a water-methanol mixture (70:30 v/v) and a flow rate of 0.8 mL/min.
RESULTS AND DISCUSSION
1. Analysis of Supernatants and the Extracts of Pine Bark (EPB) by FT-IR Spectroscopy and HPLC
As TNT was the main subject of this study, the analysis of recorded FT-IR spectra was specifically focused on the absorption regions corresponding to nitro groups, i.e. 1359-1328 cm-1 assigned to the symmetric stretch of the para-nitro group (4-NO2) and 1562-1535 cm-1 assigned to the
asymmetric stretch of the ortho-nitro group (2,6-NO2) [16,
17]. Spectra of supernatants and EPB show obvious qualitative differences in the absorption regions of the nitro groups (-NO2): absorption peaks at 1544 cm-1 and 1347 cm-1
in the EPB spectra are pronounced whereas they are scarcely detectable in the spectra of supernatants due to the broadness of the band (Fig. 1). The raw spectra of the supernatants were therefore not suitable for analysis of nitroaromatics by FT-IR. The broadness of the nitro group absorption band in supernatant spectra may be due to the complexity of the pink water matrix. In addition, as well as pink water, the supernatants contain dissolved substances such as glucose, pine bark components, and extracellular compounds from the inoculum. Besides TNT, pink water may also contain varying concentrations of other explosives such as RDX, HMX, 2,4- and 2,6-DNT, tetryl, 1,3-DNB, 1,3,5-TNB, and nitrobenzene [18].
Removal of TNT from pink water by pine bark could be seen clearly through the decrease in peak intensities at 1544 and 1347 cm-1 in the EPB spectra as the experiment progressed (Fig. 2.). Unlike in spectra from Day 7 samples of batches C and D, the nitroaromatics peaks were not detected in spectra from the Day 7 samples of batches E, F and G. The only Day 14 sample that produced a (low intensity) peak at 1347 cm-1 was from batch C. These results were in complete agreement with the HPLC analysis, which are shown in Table 2. Thus, raw spectra of EPB can be used as a screening method for the overall removal of nitro group-containing substances from pink water using pine bark.
In our study the amino group-containing TNT metabolites, such as ADNTs and DANTs, could not be analysed by FT-IR spectroscopy because the 3400-3500 cm-1 region that is assigned to the vibrations of N−H bonds in amino groups [19,20] overlaps with the 3000 – 3600 cm-1 spectral region attributable to the vibrations of O-H groups [21].
2. Second Derivative Spectra Analysis of Supernatants and EPB
Since absorption bands in FT-IR spectrum are a superposition of all bond vibrations at specific frequencies, the second derivative is used to differentiate the absorption peaks of specific vibrations. The second derivative spectral analysis is used for qualitative and quantitative analysis, especially of multicomponent samples [22, 23]. This approach was used for analysis of supernatants and EPB.
HCA of the second derivative spectra clustered the size-sorted pine bark samples along two branches. One branch of cluster groups was populated by the ACN extracts of unsieved pine bark and the ≤ 1mm fraction, whereas the other branch contained the extracts of fine-grained adsorbent, i.e. ≤ 0.045 and ≤ 0.025 mm (Fig. 6).
The second derivative spectra of supernatants did not show any absorption peaks of particular interest. However,
4 The Open Biotechnology Journal, 2015, Volume 9 Gulbe et al.
the second derivative spectra of EPB samples showed a distinctive decrease in peak intensities at 1544 and 1347 cm-1
and were thus used for semi-quantitative analysis.
Fig. (2). FT-IR spectra of the EPB from batches C, D, E, F and G. Blue=Day 0, red=Day 7 and black=Day 14.
Table 2. TNT, ADNTs and DANTs concentration in EPB and TNT concentration in supernatants, determined by HPLC.
Batch TNT in EPB, mg/L TNT in supernatant, mg/L ADNTs in EPB, mg/L DANTs in EPB, mg/L
C Day0 160 12.8 ± 1.1 0 0 C Day7 30 8.0 ± 0.9 19 n.d. C Day14 4 n.d. 32 n.d. D Day0 164 16.9 ± 1.1 0 0 D Day7 62 7.0 ± 0.4 8 n.d. D Day14 n.d.* n.d. 10 6 E Day0 175 11.7 ± 0.6 0 0 E Day7 n.d. 1.5 ± 0.8 17 n.d. E Day14 n.d. n.d. 11 3 F Day0 179 12.0 ± 0.7 0 0 F Day7 n.d. n.d. 17 n.d. F Day14 n.d. n.d. 8 7 G Day0 162 13.1 ± 1.0 0 0 G Day7 n.d. n.d. 4 10 G Day14 n.d. n.d. 2 5
Where: C: PW + PB; D: PW + Glu + PB; E: PW + In2 + PB; F: PW + In1 + Glu + PB; G: PW + In2 + Glu + PB *n.d.: not detected
Vertex PI Index and Szeged Index of Certain Special Molecular Graphs The Open Biotechnology Journal, 2015, Volume 9 5
3. Semi-quantitative Analysis of EPB by the 2nd Derivative Spectra
3.1.Hierarchial Cluster Analysis
Hierarchial cluster analysis (HCA) allows differentiation of spectra by particular absorption bands, bonds or substance. In this study the HCA of EPB was performed in two spectral regions assigned to nitrogroups: 1356-1336 cm1 (para-nitro group (4-NO2) symmetric stretch) and 1559-1534
cm-1 (ortho-nitro group (2,6-NO2) asymmetric stretch) [16,
17]. The 2nd derivative spectra of EPB formed two sub-clusters: 1) Day 0 samples from all batches and Day 7 samples from batches C and D; and 2) Day 7 samples from batches E, F and G and Day 14 samples from all batches (Fig. 3).
These results correlated with the HPLC data (Table 2) and showed that HCA was able to discriminate between spectra from samples with higher and lower TNT concentrations.. The correlation between HCA and HPLC data indicate that this approach can serve as a quick screening method for the detection of TNT in pink water. 3.2. Comparative Analysis of FT-IR Spectroscopy and HPLC Data
We applied the approach suggested by Torabi et al. [23], making use of selected peaks of the second derivative spectra for quantification of particular compounds to establish the linear relationship between the total nitroaromatics, i.e. the sum of the concentrations of TNT and/or its metabolites (4-ADNT/2-ADNT; 2,4-DANT/2,6-DANT) determined by
HPLC, and the integrated areas of each of the two characteristic nitro group regions (1356-1336 and 1559-1534 cm-1). The corresponding correlation coefficients between HPLC and FT-IR were relatively high R2=0.987 and R2=0.977 for the 1356-1336 cm-1 and 1559-1534 cm-1 regions respectively (Table 3), which indicates that this approach is suitable for monitoring the degradation of TNT and its metabolites. Furthermore, the region at 1356-1336 cm-1 appeared to relate to TNT and not the metabolites, because in the raw spectra of batch C Day 14, a small peak, which corresponds to 4 mg/L of TNT determined by HPLC (Table 2), was observed at 1347 cm-1,i.e. in the 1356-1336 cm-1 region. This could be explained by absorption of the asymmetric –NO2 modes dominated by the N-O stretch components, while the symmetric –NO2 modes additionally
contain the major C-N stretching components which respectively stretch between the benzene ring and nitro groups [24].
In the second derivative spectra the intensities of peaks in the 1356-1336 cm-1 region remained constant throughout the experiment, but the 1559-1534 cm-1 region shifted and split into two peaks with minimums at 1551 and 1538 cm-1 in Day 7 and Day 14 samples (Fig. 3). The peak at 1551 cm-1 originated from the pine bark, as demonstrated by the spectrum of the pine bark control extract. Nevertheless, a linear relationship was established with correlation coefficient R2=0.912 between the integrated area in the 1543-1534 cm-1 region, which is ascribed to the 1538 cm-1 peak, and ADNT concentration as determined by HPLC (Table 4). Since the peak at 1538 cm-1 overlaps with the TNT peak at 1544 cm-1, only those batches in which TNT
Fig. (3). Second derivative FT-IR spectra of batch E and HCA of all EPB samples (vector normalized at regions 1559-1534 and 1356-1336
cm-1). Marked are the integrated regions of the TNT characteristic nitro groups (1356-1336 and 1559-1534 cm-1). Blue=Day 0, red=Day 7 and black=Day 14.
6 The Open Biotechnology Journal, 2015, Volume 9 Gulbe et al.
and the metabolites do not occur simultaneously could be used for this comparative analysis. HPLC analysis showed that these batches were E, F and G (Table 2).
4. The affinity of Pine Bark Towards Explosives Other Than TNT
As well as TNT, pink water may also contain varying levels of RDX and HMX, depending on the particular formulation being handled. According to the report by
Hinshaw et al. (1987), the nitrobodies of greatest concern in pink water collected from an Iowa army ammunition plant were TNT (100 mg/L), RDX (30 mg/L), HMX (30 mg/L) and 2,4-DNT (1 mg/L). In order to determine whether pine bark adsorbs explosives other than TNT, FT-IR spectra were analyzed to identify absorption bands common to MixA and EPB (Fig. 4). All three spectra, i.e. the spectra of TNT and MixA HPLC standards and the representative spectra of EPB from batch C Day14, showed common absorption bands around 1600, 1545 and 1345 cm-1. The spectra of TNT and
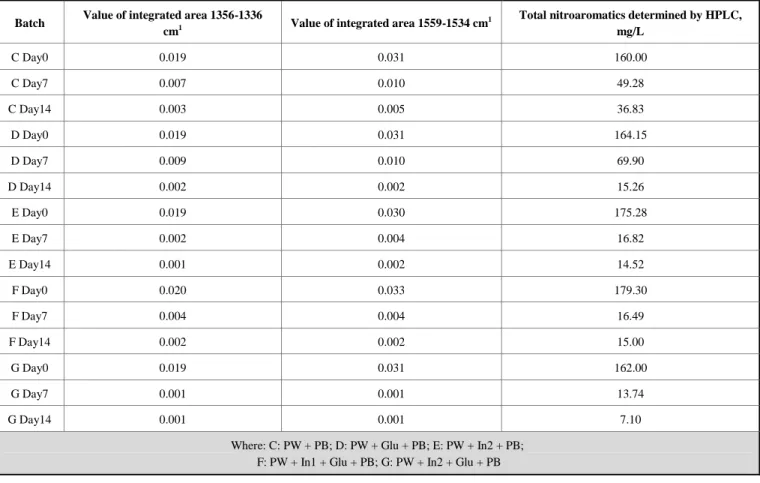
Table 3. Values of the integrated area of characteristic nitro group absorption bands at 1356-1336 and 1559-1534 cm-1 in the second derivative FT-IR spectra and the corresponding sum of the concentrations of total nitroaromatics determined by HPLC.
Batch Value of integrated area 1356-1336
cm1 Value of integrated area 1559-1534 cm
1 Total nitroaromatics determined by HPLC, mg/L C Day0 0.019 0.031 160.00 C Day7 0.007 0.010 49.28 C Day14 0.003 0.005 36.83 D Day0 0.019 0.031 164.15 D Day7 0.009 0.010 69.90 D Day14 0.002 0.002 15.26 E Day0 0.019 0.030 175.28 E Day7 0.002 0.004 16.82 E Day14 0.001 0.002 14.52 F Day0 0.020 0.033 179.30 F Day7 0.004 0.004 16.49 F Day14 0.002 0.002 15.00 G Day0 0.019 0.031 162.00 G Day7 0.001 0.001 13.74 G Day14 0.001 0.001 7.10
Where: C: PW + PB; D: PW + Glu + PB; E: PW + In2 + PB; F: PW + In1 + Glu + PB; G: PW + In2 + Glu + PB
Table 4. Integrated area values of IR absorption bands 1543-1534 and 1556-1544 cm-1 of the second derivative spectra and
concentrations of ADNTs and DANTs determined by HPLC.
Batch value of integrated area 1543-1534 cm-1 value of integrated area 1556-1544 cm-1 ADNT, mg/L
E Day7 0.004 0.002 16.82 E Day14 0.002 0.002 11.41 F Day7 0.004 0.002 16.49 F Day14 0.002 0.002 7.80 G Day7 0.001 0.003 3.81 G Day14 0.001 0.002 1.90
Where: E: PW + In2 + PB; F: PW + In1 + Glu + PB; G: PW + In2 + Glu + PB
Vertex PI Index and Szeged Index of Certain Special Molecular Graphs The Open Biotechnology Journal, 2015, Volume 9 7
MixA were obviously different but showed two strong common absorption bands at 1545 cm-1 and 1350 – 1346 cm
-1. Thus there was only one common absorption band in the
spectra of Mix A and EPB, in the region 1250-1300 cm-1. The absorption maximums were at 1272 cm-1 in the EPB spectrum and 1268 cm-1 in the Mix A spectrum. The bands in the region 1250-1300 cm-1 are assigned to vibrations of N-NO2, NO, C-H, (C–N) of primary aromatic amine and esters
of aromatic acids [24,25,26]. As most common nitramine explosives, such as RDX, HMX and tetryl, are characterised with all these vibrations, the spectra indicate that the pink water contains nitramine explosives, and that these are adsorbed by the pine bark.
5. FT-IR Spectral Analysis of the Acetonitrile Extracts of Pine Bark Fractions
FT-IR spectra of ACN extracts of four pine bark fractions with different particle sizes were analyzed to evaluate the dependence of lignin and phenol groups content on the particle size. The main absorption bands had maximums at
2924 cm-1 and 2852 cm-1 (symmetric and assymmetric vibrations of CH2, CH3 groups) and 1721 cm-1 (uncoupled
carbonyl groups in ketones and carboxyl groups), at 1660-1405 cm-1 from lignin, at 900-1100 cm-1 from cellulose, and a peak at 1364 cm- 1 which is assigned to the phenolic hydroxyl groups [27,28,
29,
30,31] (Fig. 5). The profile of spectra in the lignin absorption region 1660-1405 cm-1 was similar in all pine bark fraction extracts, indicating that the extracted lignin did not vary qualitatively.The lignin band intensities in raw and second derivative spectra increased with decreasing particle size, meaning pine bark extracts with smaller particle size had higher lignin content. Reducing particle diameter is also known to increase the adsorption capacity of an adsorbent due to the increase in the surface area per unit weight [32,33].
In the second derivative spectra the absorption peak at 1375 cm-1, which is assigned to phenolic hydroxyl groups, was highest in spectra of unsieved pine bark. The intensity of this peak was halved in the spectra of fine-grained pine bark
Fig.(4). FT-IR spectra of TNT and MixA HPLC standards and EPB (Bach C, pink water + pine bark particle size 0.045).
Fig. (5). FT-IR spectra of the can extracts of four pine bark fractions: unsieved pine bark (green), ≤ 1 mm (black), ≤ 0.045 mm (blue), and ≤
8 The Open Biotechnology Journal, 2015, Volume 9 Gulbe et al.
extracts. Thus, the concentration of phenolic hydroxyl groups remaining in the pine bark increases with increasing size of pine bark particles.
CONCLUSIONS
The study showed that FT-IR spectroscopy applied to the analysis of acetonitrile extracts of pine bark is a useful tool for investigating, optimising and monitoring of pink water remediation by adsorption to pine bark. FT-IR spectra of pine bark extracts showed that as well as TNT, pink water collected at the demilitarisation factory Nammo Vingåkersverken AB also contained one or more nitramine explosives, such as RDX, HMX and tetryl, which were adsorbed by the pine bark. The highest lignin and lowest phenol group content was detected in the pine bark fraction with the smallest particle size of the four tested, which indicates that sieving of pine bark is needed as a pre-treatment method in order to increase the removal efficiency and ecological safety of the adsorbent.
FT-IR spectrocopy could not be used for the analysis of nitroaromatics directly in pink water because the peaks of interest overlap with other components of the multicomponent mixture under study.
Good correlation between HPLC and FT-IR spectroscopy analysis of pine bark acetonitrile extracts show that FT-IR analysis can serve as a quick, green and cheap screening method for the analysis of TNT and nitramine explosives removal from pink water. Overall, FT-IR spectroscopy can serve both to complement and partially substitute HPLC as an analytical tool for studying and monitoring the removal of nitroaromatics from pink water, thus significantly reducing costs and ensuring environmental soundness of the chemical analysis.
ACKNOWLEDGEMENTS
The authors would like to thank Zugol AB (Falun, Sweden) for supplying the pine bark, and the project financing partners: Knowledge Foundation, Nammo
Vingåkersverken AB, KCEM AB, Bofors Test Center AB, Cesium AB and Eriksson Patent AB.
CONFLICT OF INTEREST
The authors confirm that this article content has no conflicts of interest
REFERENCES
[1] Ribé V, Nehrenheim E, Odlare, et al. Ecotoxicological assessment and evaluation of a pine bark biosorbent treatment of five landfill leachates. Waste Managm 2012; 32: 1886-94.
[2] Nehrenheim E, Odlare M, Allard,B. Retention of 2,4,6-trinitrotoluene and heavy metals from industrial waste water by using the low cost adsorbent pine bark in a batch experiment. Water Sci Technol 2011; 64: 2052-58.
[3] Genç-Fuhrman H, Mikkelsen PS, Ledin A. Simultaneous removal of As, Cd, Cr, Cu, Ni and Zn from stormwater: experimental comparison of 11 different sorbents. Water Res 2007; 41: 591-602. [4] Li Y, Chen B, Zhu L. Enhanced sorption of polycyclic aromatic
hydrocarbons from aqueous solution by modified pine bark. Bioresour Technol. 2010; 101:7307-13.
[5] Antunes MSG, Pinto S, Braga FG, Esteves Silva JSG. Optimisation of bisphenol A removal from water using chemically modified pine bark and almond shell. Chem Ecol 2012; 28: 141-152.
[6] Braga FG, Pinto S, Antunes MSG. Comparative study of 17β-estradiol removal from aqueous solutions using pine bark and almond shell as adsorbents. Microchim Acta 2011; 173: 111–17. [7] Sousa S, Jiménez-Guerrero P, Ruiz A, et al. Organochlorine
pesticides removal from wastewater by pine bark adsorption after activated sludge treatment. Environ Technol 2011; 32: 673-83. [8] Chusova O, Nõlvak H, Truu J, et al. Effect of pine bark on the
biotransformation of trinitrotoluene and on bacterial community structure in a batch experiment. Environ Technol 2014; doi 10.1080/09593330.2014.909888
[9] Dizhbite T, Zakis G, Kizima A, et al. Lignin — a useful bioresource for the production of sorption-active materials. Bioresource Technol 1999; 67: 221-28.
[10] Ali I. The quest for active carbon adsorbent substitutes: inexpensive adsorbents for toxic metal ions removal from wastewater. Sep Purif Rev 2010; 39: 95-171. [11] Ribé V, Nehrenheim E, Odlare M, Waara S. Leaching of
contaminants from untreated pine bark in a batch study: chemical analysis and ecotoxicological evaluation. J Hazard Mater 2009; 163: 1096-1100.
Fig. (6). The dendrogram of HCA of the acetonitrile extracts of four pine bark fractions: unsieved pine bark, ≤ 1.000, ≤ 0.045 and ≤ 0.025
Vertex PI Index and Szeged Index of Certain Special Molecular Graphs The Open Biotechnology Journal, 2015, Volume 9 9 [12] Grube M, Gapes JR, Schuster KC. Application of quantitative IR
spectral analysis of bacterial cells to acetone–butanol–ethanol fermentation monitoring. Anal Chim Acta 2002; 471: 127-33. [13] Mazarevica G, Diewok J, Baena JR, Lendl B. On-line fermentation
monitoring by mid-IR spectroscopy. Appl Spectrosc 2004; 58: 804-10.
[14] Grube M, Dimanta I, Gavare M, et al. Hydrogen-producing Escherichia coli strains overexpressing lactose permease: FT-IR analysis of the lactose-induced stress. Biotechnoly Appl Biochem 2014; 61: 111-7.
[15] Liu J, Mukherjee J, Hawkes JJ, Wilkinson SJ. Optimization of lipid production for algal biodiesel in nitrogen stressed cells of Dunaliella salina using FTIR analysis. J Chem Technol Biotechnol 2013; 88:1807-14.
[16] Clarkson J, Smith WE, Batchelder DN, et al. A theoretical study of the structure and vibrations of 2,4,6-trinitrotolune. J Mol Struct 2003; 648: 203–14.
[17] Grube M, Muter O, Strikauska S, et al. Application of FT-IR for control of the medium composition during biodegradation of nitro aromatic compounds. J. Ind. Microbiol. Biotechol 2008; 35: 1545-49.
[18] Hinshaw, G.D., Fansk, C.B., Fiscus, D E. and Sorenson, S.A. (1987). Granular activated carbon (GAC) system performance and capabilities and optimization, Report AMXTH-TE-GR87111, U.S. Army Toxic and Hazardous Materials Agency, Aberdeen Proving Ground, MD, U.S.
[19] Zhang X, Lin Y, Shan X, Chen Z. Degradation of 2,4,6-trinitrotoluene (TNT) from explosive wastewater using nanoscale zero-valent iron. Chem Eng J 2010; 158: 566-70.
[20] Zhang J., Lina X, Luo X, et al. A modified lignin adsorbent for the removal of 2,4,6-trinitrotoluene. Chem Eng J 2011; 168; 1055–63. [21] Marechal Y. Configurations adopted by H2O molecules: results
from IR spectroscopy. Faraday Discuss 1996; 103:349-61.
[22] D’antonio J, Murphy BM, Manning MC, Al-azzam WA. Comparability of protein therapeutics: quantitative comparison of second-derivative amide I infrared spectra. J Pharm Sci 2012; 101: 2025–33.
[23] Torabi K, Karami A, Balke ST, Schunk TC. Quantitative FTIR detection in size-exclusion chromatography. J Chromatogr 2001; 910: 19–30.
[24] Rusu E, Jurcoane S, Rusu G. Rapid evaluation by UV-Vis and FT-IR spectroscopy of DINOCAP residue in soil: Microbiological implications. Romanian Biotechnol Lett 2010; 15: 5801-12. [25] Bellamy LJ. The Infra-red Spectra of Complex Molecules. Richard
Clay, Bungay, Suffolk 1962 pp. 65–84, 249–261.
[26] Green JHS, Lauwers HA Vibrational spectra of benzene derivatives-XIII. The dinitrobenzenes. Spectrochim Acta 1971; 27A: 817-24.
[27] Naumann D. In: Encyclopedia of Analytical Chemistry. Meyers RA, Eds., John Wiley & Sons, Chichester, UK., 2000 pp. 102–131. [28] Helm D, Naumann D. Identification of some bacterial cell
components by FT-IR spectroscopy. FEMS Microbiol Lett 1995; 126: 75–80.
[29] Szczepkowski A, Nicewicz D, Koczon P. The relationship between three health a nd chemical compositions of beech (Fagus sylvatica L) and oak (Quercus robur L.) wood of Polish provences. Acta Sci Pol 2007; 6: 77-88.
[30] El Mansouri NE, Yuan Q, Huang F. Glyoxalated alkaline lignin. Bio Resources 2011; 6: 4523-36.
[31] Schwanninger M, Rodrigues JC., PereiraH, Hinterstoisser B.Effects of short-time vibratory ball milling on the shape of FT-IR spectra of wood and cellulose. Vibrat Spectrosc 2004; 36: 23-40.
[32] Bras IP, Lemos L, Alves A. Pereira MF. Sorption of pentachlorophenol on pine bark. Chemosphere 2005; 60: 1095-102. [33] Al-Ashen S, Duvnjak Z. Sorption of cadmium and other heavy
metals by pine bark. J Haz Mat 1997; 56: 35-51.