V¨
aster˚
as, Sweden
Thesis for the Degree of Master of Science in Engineering
DVA502 Robotics 30.0 credits
MULTISENSOR STRESS
MONITORING FOR
NON-STATIONARY SUBJECTS
Anette Hilmersson
ahn09014@student.mdh.se
Examiner: Maria Lind´
en
M¨
alardalen University, V¨
aster˚
as, Sweden
Supervisor: Martin Ekstr¨
om
M¨
alardalen University, V¨
aster˚
as, Sweden
Company supervisor: Erik Matti,
Motion Control, V¨
aster˚
as, Sweden
Abstract
Monitoring stress in real-time, in a non-laboratory environment can be beneficial in several ap-plications. One of these, which have been the motivation for this thesis, is to to perform this measurement during Attention deficit hyperactivity disorder (ADHD) diagnosis. Monitoring sev-eral physiological responses to internal or external stimuli in a single soft-real-time system is not a solution widely used in an application like this. The thesis starts by studying several stress re-lated responses in detail. Sensors for all of the responses are not implemented nor is it possible to implement in to the desired system.
After the study is was decided to implement two measurement modules. The first a Photo-plethysmogrophy (PPG) measurement module to measure heart rate and also estimate breathing. This module is prepared for estimating arterial blood oxygen levels but the calculation or verification have not been done. The second is Skin Conductance (SC) measurement module and in to both of these add a temperature sensor to measure the temperature of the skin. Time constraints limit the SC module to only be presented in theory. The PPG module on the other hand have been realised in a prototype. This prototype performs the measurement in transmissive mode on the left earlobe, which leaves the hands free and it does not affect the hearing on that ear. The prototype give out acceptable signal quality when good contact with the measurement site is achieved. The signal interpretation, such as performing the signal analysis to count the beats per minute, is outside the scope of this thesis and will therefore not be presented but the signals can be seen in figures.
Sammanfattning
Att m¨ata stress i realtid i verkliga situationer kan vara f¨ordelaktigt f¨or flera applicationer. Det som har legat som grund f¨or denna uppsats ¨ar att kunna m¨ata stress under ADHD diagnostiser-ing. Genom att kombinera de vanliga testerna med stressniv˚aer hos patienten hoppas man kunna utveckla nya metoder f¨or diagnostisering. Att m¨ata flera parametrar samtidigt i realtid ¨ar inte n˚agot ofta utf¨ors idag. F¨or att komma ig˚ang har flera kroppsliga funktioner som p˚averkas p˚a olika s¨att av stress studerats. Alla dessa funktioner kan inte inkluderas i det system som ¨onskas konstrueras antingen p˚a grund av systemets karat¨ar eller p˚a grund tidsbrist.
Efter att unders¨okningen var klar beslutades det att konstruera tv˚a moduler. Den f¨orsta anv¨ander en m¨at-teknik som kallas PPG och anv¨ands f¨or att m¨ata hj¨artfrekvens, ¨aven andningsfrekvensen estimeras och modulen ¨ar f¨orberedd f¨or att estimera blodsyre niv˚a men singalbehandling och valid-ering f¨or detta ¨ar inge gjord. Den andra modulen m¨ater resistans i huden. I dessa moduler lades ¨
aven till en temperatur sensor f¨or att m¨ata hudtemperaturen. Tidsbrist har gjort att endast en av dem tv˚a modulerna kunnat realiserats. Den som realiserat ¨ar PPG modulen och modulen f¨or hudresistans presenteras endast teoretiskt. PPG modulen genomf¨or m¨atningen med en transmissiv teknik p˚a v¨anster ¨ora och ger ut en acceptabel signalkvalite om sensorn f˚ar bra kontakt. Arbetet ¨ar avgr¨ansat och inkluderar inte signalanalysen av signalen d¨aremot visualiseras singalen i figurer.
Table of Contents
Acronyms 5 1 Introduction 6 1.1 Hypotheses . . . 6 1.2 Purpose . . . 6 2 Background 7 2.1 Previous work . . . 7 2.2 Introduction to ADHD . . . 7 2.3 Introduction to stress . . . 7 2.3.1 Perspiration . . . 8 2.3.2 Heart-Rate . . . 9 2.3.3 Breathing frequency . . . 9 2.3.4 Blood pressure . . . 102.3.5 Blood oxygen saturation . . . 10
2.3.6 Blood count . . . 13 2.3.7 Blood flow . . . 13 2.3.8 Body temperature . . . 13 2.3.9 Cortisol level . . . 14 2.3.10 Eye Movement . . . 14 3 Method 15 3.1 Motivation . . . 15 3.2 Tools . . . 16 4 PPG-module 17 4.1 Block diagram . . . 17 4.2 Sensor PPG . . . 18
4.3 Filters and Amplification . . . 18
4.4 Sample and Hold . . . 19
4.5 Required components . . . 20
4.5.1 Sensor red . . . 21
4.5.2 Sensor IR . . . 22
4.5.3 Operational amplifier . . . 24
4.5.4 Conclusions from Components Investigation . . . 24
4.6 Simulations . . . 25
4.7 End design . . . 27
4.7.1 Presentation of data . . . 27
4.7.2 Analogue signal conditioning . . . 28
4.7.3 Prototype Evaluation . . . 29
5 SC-module 30 5.1 Block diagram . . . 30
5.2 Sensor SC . . . 30
5.3 Wheatstone Bridge . . . 30
5.4 Filters and Amplification . . . 31
5.5 Required components . . . 31
5.6 Simulations . . . 32
6 Temperature sensor 36
8 Firmware 38
8.1 PPG LED Control . . . 38
8.2 Data Acquisitions . . . 39
8.3 Temperature sensor . . . 39
8.4 Gathering and Sending data . . . 39
9 Result 40 9.1 Research questions . . . 40
9.2 Component test values . . . 40
9.3 Results from PPG prototype . . . 41
9.3.1 Fronted of the prototype . . . 41
9.3.2 Prototype specifications . . . 42
9.3.3 Summation of the questionnaire . . . 42
10 Discussion 43 10.1 Research questions . . . 43 10.2 Prototype developed . . . 44 11 Conclusion 45 12 Future work 45 13 Acknowledgements 45 References 49
Acronyms
ADC Analogue-to-Digital Converter. 33,34
ACF Adaptive Comb Filtering. 9
ADHD Attention deficit hyperactivity disorder. 4, 5,12,37
AS-LMS Adaptive Step- size Least Mean Squares. 9
BPF Band Pass Filter. 21,24,26,27
bpm beats per minute. 6,16,21,22
CAD Computer Aided Design. 13
CKF Centrum f¨or Klisniskforksning. 5,37
CNAPTM Continuous Non-invasive Arterial Pressure. 8
DTCWT Dual-Tree Complex Wavelet Transform. 9
ECG Electrocardiograph. 6,12
EMD Empirical Mode Decomposition. 7
EOG Electrooculogram. 11,12
GSR Galvanic Skin Response. 13
IR Infra-red. 15–19,21,34,35
LDF Laser Doppler Flowmetery. 10
LDR Light-Dependent-Resistors. 15
LED Light Emitting Diode. 6, 15–19,21–23, 32,33
LPF Low-Pass-Filter. 16,21,22,24, 26,27
MMSB Modulated Magnetic Signature of Blood. 10
OP-AMP Operational Amplifier. 16,19–22, 28, 29
PCA Principal Component Analysis. 7
PCB Printed Circuit Board. 13,23, 26
PI perfusion index. 9
PPG Photoplethysmogrophy. 7–10,12–16,18,19,23,24,26–29, 32–34,37
PWTT Pulse Wave Transit Time. 8,12
RIIV Respiratory-Induced Intensity Variations. 7,21
µS microSiemens. 6
S/H Sample and Hold. 19–24,33
SC Skin Conductance. 6,12,26–30,33,37
1
Introduction
Monitoring stress in a real environment can be beneficial in several applications. One of these, which have been the motivation for this thesis, have been to perform this measurement during
Attention deficit hyperactivity disorder (ADHD)diagnosis. The physiological response to internal-and external stimulus can be of help for physicians to assess the mental internal-and physical state of a person. The body is complex and monitoring a single response will only give a limited picture of what is going on. While it is impossible to every response the body gives to stimulus measuring several relevant responses can be helpful for diagnosis or monitoring. The aim of this thesis has been to develop a clinical prototype of a system that is unobtrusive and can measure these responses continuously in real-time. There is also a desire for the system be able to be used for long-time monitoring. The signal interpretation of the data acquired is outside the scope of this master thesis.
1.1
Hypotheses
The Hypotheses for this master thesis was as follows:
To create a clinical prototype that will improve the monitoring procedures for real-time evaluation of a non-stationary subject.
The thesis work has been to realise the hypotheses, to create a working prototype from available theories. The prototype is desired to be easy to use, reusable and disturb the test subject as little as possible. There have been an aim for the prototype to function in a real environment rather than only in a laboratory setting.
The main focus has not been to be able to use the prototype in combination with strainius exercise.
1.2
Purpose
Monitoring several physiological responses to internal or external stimuli in a single soft-real-time system is not a solution widely used. The goal of the thesis has been to create a system that is unobtrusive to the user. One way to achieve this is to try and make the prototype small, comfortable to wear and user friendly. There have been a desire to make the monitoring equipment reusable. For that purpose it was required both to have a suitable mounting for the sensors but also to be able to disinfect the system between different uses. The thesis have focused on the following research questions. To limit the scope of the thesis delimitations are described beneath each respective question.
RQ1 Is it possible to monitor several responses simultaneously without them
interfer-ing with each other?
This question will be answered empirically by testing the system created. If they do inter fear each other out when used simultaneously the test is consider successful. No further testing will be done due to time constraints.
RQ2 Can these test be carried out without disturbing the test subject to a degree
that significantly skews the results?
Due to the limitations on the size of the project this was investigated in the form of a questionnaire given to handful of test-subjects.
RQ3 Which are the main difficulties with monitoring a moving subject?
This is a question that have been kept in mind as the system was developed. And will be answered in with the practical experiences learned throughout the thesis.
2
Background
This thesis have been proposed by Motion Control [1] in V¨aster˚as. They have a collaboration with
Centrum f¨or Klisniskforksning (CKF).CKFis a drive from Landstinget V¨astmanland to perform
patient close research [2]. CKF is developing new methods for diagnosing ADHD by measuring physiological responses and movement patterns at the same time as the regular tests are being performed.
The project had already been started my Motion Control and more information of the back-ground can be found in Section2.1.
2.1
Previous work
Motion Control have already designed a system for measuring movement patterns but the complete system needs to be complemented with the stress monitoring. Also a base unit has been created to facilitate the stress-monitoring sensors. This base unit called DVG have 4 connections that can supply the sensor with 5V and maximum 100mA. Each of these connections have aUniversal Asynchronous Receiver/Transmitter (UART)interface that runs on 3.3V for communication and data acquisition from the sensor. The DVG also have Bluetooth⃝Rcapability, this is not intended
to be used during this thesis but as a future development. The modules to be created in the thesis were to be compatible with this base unit.
2.2
Introduction to ADHD
ADHD is a neurological condition that affects a persons ability to concentrate on a given task. Both over- and under-concentration is part of the symptoms ofADHD. It is normally discovered in childhood and around 3-5% of the population is expected to haveADHD. In 40-70% of cases the condition is still present in adulthood [3]. To get diagnosed with ADHD, the symptoms which include hyperactivity, concentration difficulties and lack of impulse control, must persist a minimum of six months and occur in several settings (school, home, daycare etc). The symptoms are however not unique and other underlying conditions such as depression, sleep deprivation, thyroid conditions, fetal alcohol syndrome among others need to first be excluded. This is usually done by questionnaires and interview of parents, relatives and school/daycare staff [4]. After these questionnaires to confirm diagnosis and help adjust medications a so called Qb tests are performed. The aim in a Qb test is to identify geometrical shapes as quickly and accurately as possible on a computer screen [5]. Despite the vigorous testing there is an belief that some people are incorrectly diagnosed withADHD. By adding an extra level to these tests and measure movement patterns as well as stress levels of the patient undergoing these tests,CKF hopes to be able develop new methods for diagnosis.
2.3
Introduction to stress
Stress is not something that can be easily defined and manifests itself in several ways. Unlike a broken bone a single test cannot evaluate the stress level a person experience. The responses to external and internal stimulus to the body are controlled by the nervous system. This consists of the somatic nervous system and the autonomous nervous system. The somatic nervous sys-tem is controlled with willpower and control conscious movements, such as lifting you arm. The autonomous nervous system on the other hand controls unconscious actions such as hormone pro-duction, heart-rate and digestive system etc. The autonomous nervous system is divided into two sub groups, the sympathetic nervous system and the parasympathetic nervous system.
These two systems are designed to work in unison. For the body to function on an optimal level a bit of both are necessary. Fear and anger stimulates the sympathetic nervous system while normal relaxing situations stimulates the parasympathetic nervous. The sympathetic nervous system prepares the body for ”fight or flight” situation. It heightens the body’s senses, increases the heart-rate and blood pressure, blood vessels contract and the internal organs activities are lowered while the skeletal muscles get more of the blood flow. Breathing-rates are increased and stored sugars and fat are turned into energy to handle the stressful and dangerous situation. It
also starts the body’s perspiration system in order to reduce the heat from the increased energy output, all to prepare for either fight or flight
The parasympathetic nervous system on the other hand lower the heart-rate and blood-pressure the broncs in the lung contract. It increases the digestive system activity in order to re-build and prepare the body for dangerous situations. If the body never gets to rest and turn on the parasympathetic nervous system it cannot keep up the energy to run the sympathetic nervous system. If the body is stressed for long periods of time the sympathetic nervous system can become overly active and secretion of cortisol from the adrenal cortex increases. This combination is not good and the digestive system can decrease in efficiency. The body resources are depleted and the blood pressure rices. Long term stress can increase the risk of heart disease as well as make the person more susceptible to infections [6].
Below are a list of some of the bodily function connected to stress. These responses are described further in Sections2.3.1-2.3.10.
1. Perspiration 2. Heart-rate
3. Breathing frequency 4. Blood pressure 5. Blood oxygen level 6. Blood count 7. Blood flow 8. Body temperature 9. Cortisol level 10. Eye movment
Due to time restrains of this project as well as the desire to keep the prototype small not all of these responses can be monitored. To see what was implemented and why see Section3.1.
2.3.1 Perspiration
Perspiration, or sweat as it is also called, is a watery substance secreted by sweat glands in the skin. Sweat is not solely water but also contains Na+ and Cl− ions among others [6, 7]. Sweat production can go up for several reason. Such as high ambient temperatures, exercise but also when emotional stress is put on the body [6,8].
There are three types of sweat glands: eccrine, apocrine and apoeccrine and they are controlled by different nerve-types. Eccrine sweat-glands are controlled by sympatric nerves and are there by mostly involved in emotional responses. They are located all over the body but is most dense in the palms with a density of 600-700 glands per cm2, the forehead have around 180 glands per cm2 while the lower limbs have around 60 glands per cm2 of eccrine sweat-glands [7].
A common method of studying sweat is by measuring the resistance of the skin or the Skin Conductance (SC). It is traditionally measured on the fingers or palms and are presented in mi-croSiemens (µS). This can be problematic if the measurement are to be measured over a long period of time or in this system where it is not to obstruct the user. Marieke Van Dooren et al. [7] conducted a study to evaluate other locations. They studied 16 location including the common lo-cations of the palm-side of the finger and forehead. Other lolo-cations included shoulder, wrist, soles, chest among others. The test subject were to watch seven film-clips to induce different emotion such as fear anger sadness etc. They found that compared to palm measurement the lowest corre-lation was with the measurement of the abdomen,back,arm and armpit and the highest correcorre-lation were at the shoulders, wrist, neck, chest and calf [7].
It is not just the rate and amount of sweat perspiration that is interesting. Also content and pH level is of interest meaning that a chemical and electrical measurement can be performed. An EU-funded project named BIOTEX has been conducted with the aim develop textile-based sensors to accomplish this. By integrating an pH sensitive dye and examining this with an optical
Deirdre Morris et al. [9] has constructed a sensor for sweat analysis that measured pH-level, skin temperature, conductivity as well as sodium level. They did this by screen printing an acrylic hydrophobic paste on either side of a polyamide lycra⃝R. This creates a passive pump that controls
the fluid flow. The sweat is then lead to a pH sensor consisting of a colorimetric sensor that changes color depended on pH level. The color can then be examined by two Light Emitting Diodes (LEDs), one emitter and one as a detector [9].
Shirley Coyle et al. [8] continued this research, the team wanted to be able to integrate this in to clothing such as T-shirts. Earlier methods of sweat analysis have been ungainly and this research team wanted to find a way to do this that could be more suitable in a non-laboratory setting using the sensor described above in addition to other sensors. The sensors were strapped to the chest of the test subject. Data were recorded and compared to point measurement data collected with already proven methods. This showed close correlation between the results of the sensors and the data gathered from the old methods [8].
2.3.2 Heart-Rate
Heart-rate is affected by body-temperature, nerve impulses and hormones in the body. Without these interferences, the human heart-rate would be constant at around 100 beats per minute (bpm). Instead a normal resting rate is around 70 bpmand during activity can go up to close to 200bpm[6].
There are several ways to detect heart-rate. One way is to use a method called Photoplethys-mogrophy (PPG). This method are discussed in more detail in Section2.3.5[10].
A second option is to listen for sound or vibrations. This can be done with a pizeo-microphone sensor. The sensor turns the vibrations of the heartbeat in to electrical signal. These can then be digitized and studied further [11]. Another well-known measurement technique is to detect poten-tial differences using anElectrocardiograph (ECG). When the heart contracts it spreads electrical currents that creates differences in electrical potentials throughout the body. This potential dif-ference can be detected and recorded by surface electrodes on the skin [12].
Also here in Sweden research with a similar approach is ongoing. For example Linda Rattf¨alt [13] did her doctoral thesis on this subject at Link¨oping University. She investigated the possibility to integrate electrodes into normal clothing [13].
2.3.3 Breathing frequency
The repository rate is controlled by the medulla oblongata. It sends out a series of nerve impulses that activates the breathing muscles. After about 2 seconds these impulses are stopped and due to the elasticity of the ribcage the lungs are re-contracted. This procedure is repeated for about 12 times a minute if the body is not active. When the body is active and extra ventilation is required, also the contractions are aided by the muscle in the ribcage these are also controlled by the medulla oblongata [6].
The lungs does not have an active function to press air into the lungs. It instead relies on the fact that gases wishes to be evenly distributed all over the space available. The pressure of a gas correlates to the volume it is contained in according to Equation 1. What the body does instead is to increase the volume of the lungs by extending the ribcage as well as pushing the diaphragm downwards. This mean that the pressure in the lungs is decreases and as long as there is no blockage in the trachea air will be sucked down in to the lungs to even out the pressure [6].
V1∗ P1= V2∗ P2 (1)
Because of this a convenient way to measure breathing frequency is to measure the circumference differences of the ribcage. In healthy adults this expansion can be around 5-8 cm. Janusuz Zieba et
al. have developed a shirt with integrated an electro conductive sensor to be able to detect these
volume changes if the ribcage in a comfortable way. They proved that the shirt worked but there is still room for improvements. For example were there disturbances if the person bended over or the shirt got twisted [14].
Another way is to use an electronic stethoscope to listen for breath signs. This has been done by Andrew Spiewaket al., their main focus have been on how to utilize this method to get the best
breath sounds without distorting the signal and not continuous monitoring. This is something they to discuss in their future work as a possible use but that further investigation is needed [15]. A method mainly used for Polysomnography, used to diagnose sleep apnea, which consist of pressure transducers that are strapped around the chest and abdomen. The pressure on the bands increase with the breathing movement and the pressure transducers give out a response [16].
Breathing frequency can also be estimated byPPG, discussed in Section2.3.5. For each breath there is a an effect on the signal calledRespiratory-Induced Intensity Variations (RIIV). TheseRIIV
arises from the variation in intra-thoracic pressure due to autonomous control of the peripheral vessels and are synchronous with respiration. Traditionally this is evaluated with the help of a band pass filer in the region of repository frequencies with varying results. Therefore additional methods such asEmpirical Mode Decomposition (EMD)andPrincipal Component Analysis (PCA)
are sometimes used [17].
2.3.4 Blood pressure
Early blood pressure measurements was performed by Stephen Hales in 1773. He performed the measurement by inserting an open ended tube in to an artery in the neck of a live unanaesthetized horse. He did this to see how high the blood rose in the tube. This occurred when the weight of the blood matched the pressure in the horses artery. At first this height was around 4 ft. but later on it had risen to around 8 ft. The level was pulsating up and down around 2 or 3 inches. The pulsation shows the systolic and diastolic pressure inside the artery. This invasive measurement is not recommended for routine checking of blood pressure and instead indirect measurement have been developed [12].
Blood pressure measurements today are routinely checked in clinics by inflating a cuff around the patients upper arm, a stethoscope is placed over an artery below the cuff. The cuff is inflated so that the blood flow is completely restricted. No sound can then be heard in the stethoscope. The air is then slowly let out of the cuff, and the pressure around the arm decreases. When the blood is able to start to push though the pressure of the cuff, this can be heard in the stethoscope, is the systolic pressure. The air is the continuously let out, when the sound disappeared again the blood can run freely, this is the diastolic pressure [12].
There are commercially available products to measure blood pressure monitors that detects the blood pressure with the help if auscultatory or oscillometric methods. These still require the inflation and deflation of a cuff and cannot be used for continuous monitoring. They can be pre-programmed to performed at intervals but this can impend on normal activities and does not perform true continuous measurements [18].
Continuous pressure is today limited to invasive measurement where catheter is placed in an artery. There are however research conducted on developing ways to do this without catheter-ization. One method to do this is Continuous Non-invasive Arterial Pressure (CNAPTM). The measurement are done in the fingers with two adjacent reusable finger cuffs. The cuffs apply such a pressure that the blood volume in the finger arteries are constant (i.e volume-clamping). The pressure measured in the fingers were then scaled to a reference measurement from the upper arm performed every 15 minutes. With this scaling operation it corresponds to the measured value from a catheter placed in an artery [19]. There are however studies that show that these sometime underestimate low pressures and overestimate high pressures [20].
Another way to perform this a method called Pulse Wave Transit Time (PWTT). The time difference between a beat is detected in different parts of the body is in relation in the systolic blood pressure. Individual calibration is necessary but when this is done acceptable accuracy have been achieved [18]. With future improvements in signal acquisition as well as data processing it had a good possibility of being a simplistic reliable and accurate way of measuring blood pressure continuously [20].
2.3.5 Blood oxygen saturation
The blood and circulatory system main assignment is to transport nutrients and oxygen to the cells as well as transport the carbon dioxide and other waste from the cell for excretion. Blood oxygen saturation or pulse Pulse oximetry are measured in percentile and assesses how much of
according to Equation2. SO2is the saturation level HbO2is the red blood cells that have bonded with oxygen and the Hb is the cells that have not. Normal levels for blood oxygen in an artery is between 95-99% [21].
SO2=
HbO2
HbO2+ Hb
(2) The blood oxygen level can help physicians assess different functions dependent if the level is measured in arterial or venous blood. Saturation in venous blood is related to the amount of blood flow and how effective the gas exchange is in the tissue. According to Meir Nitzan and Haim Taitelbaum [21] there is no method to routinely check venous oxygen saturation non-invasively that are convenient and accurate enough to be used in a clinical setting. Arterial Saturation on the other hand, that show the adequacy of the ventilation and respiratory function, is routinely controlled with the help of a finger or earlobe probe using a method called pulse oximetry or
PPG[21].
PPGcan be performed in two modes, reflective or transmission mode. In reflective mode the emitter and receiver is on the same side of the tissue part and the light reflected by the tissue that is measured. In transmission mode is the emitter and receiver is on opposite sides and the light need to travel though the tissue. Transmission mode can therefore only be performed on thin peripheral parts of the body [21].
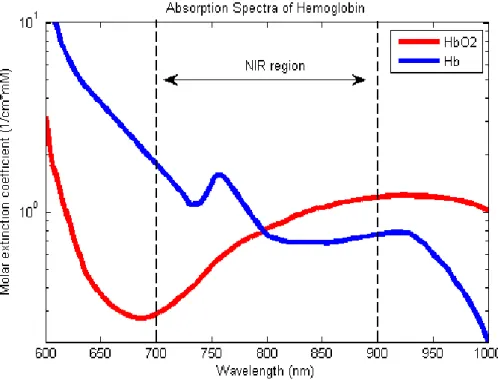
The amount of light hitting the receiver depends on the blood volume, the extinction coefficient (how much of the light the blood absorbed) and the optical path-length for that wavelength in the tissue. For each heart beat cycle the blood volume in the tissue changes in relation to this cycle. If a single light source is used this is mainly what you see. To create a system that is less dependent on volume and more on oxygen saturation two different wavelengths that have different extinction coefficient can be used this can be seen in Figure1. In many commercially available products these wavelengths are chosen so that one is in the red light spectrum and the other in the infra-red light spectrum. This to create the maximum distinction between oxygenated and de-oxygenated blood extinction coefficient [21].
Figure 1: Absorption spectra of oxygenated hemoglobin (HbO2) and deoxygenated hemoglobin (Hb) for red and infrared wavelengths. Image obtained from [22] distributed under the Created Common license.
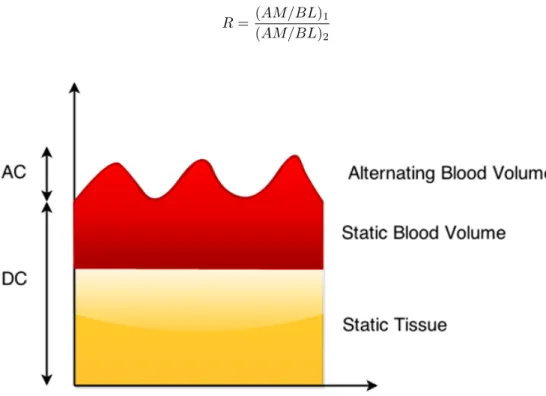
The PPG signal consists of one DC part and one AC part. The DC part is the light that is reflected or not absorbed by the tissue. The AC part is the change in the hitting the diode dependent on the blood-volume change [10]. The different parts of the signal are visualised in Figure 2. To estimate the oxygen level both the top peak, or base-line BL, is measured as well and the amplitude of the wave, the AM coefficient [21]. These are then compares according to Equation3.
R = (AM/BL)1
(AM/BL)2
(3)
Figure 2: The build up of aPPGsingal
Many systems used today work in transmission mode and thereby measures peripheral parts of the body. Under normal circumstances this is not a problem. In some life-threatening situations however, such as sepsis, hypothermia and shock, can blood to extremities be lowered in favour for vital organs such as heart lung or brain (centralization). For this reason Boudewijn Venema et
al. [23] have developed a reflective measurement sensor to be used in ear. This way they get closer to the brain and the effect of centralization is lowered [23]. They have also tested this system in surgical patients to test the clinical application of the product with satisfactory results.
Another solution is proposed by Shirley Coyle et al. [8] they created a sternum sensor since they wanted a sensor that is possible to integrate into a T-shirt. They created a sensor consisted of PPGs in the middle and used optical fibres in a circle around these to receive the reflected light. This sensor need to be pressed against the skin and are fasten with a shoulder strap in the article [8]. There are advantages to test this in the finger instead of the sternum since theperfusion index (PI)1 is allot higher. PIcan be seen in Table1but they manage to get the sensor working in tests with satisfactory result [8].
In order to deal with motion artefacts disturbing the signal there are several digital filters to be studied more closely. A few of these areAdaptive Step- size Least Mean Squares (AS-LMS)[25],
Adaptive Comb Filtering (ACF)[26],Dual-Tree Complex Wavelet Transform (DTCWT)[27].
1PI, is a relative assessment of the pulse strength at the monitoring site. PI display ranges from .02% (very weak pulse strength) to 20% (very strong pulse strength). PI is a numerical value that indicates the strength of the IR (infrared) signal returning from the monitoring site [24]
Location Perfusion index % Red light Perfusion index % Infra-red light Finger 2.92 5.09 Forehead 0.57 1.16 Chest 0.13 0.18
Table 1: Perfusion index of red light in different parts of the body[8].
2.3.6 Blood count
The composition of blood can tell physicians al lot about the over all health of the patient and are often an early step in a clinical diagnosis. Usually these tests are carried out by extracting a blood sample to be analysed outside the body. This means that the measurements are not real-time and cannot be used for long time monitoring. Several methods to analyse blood compositions have been tried but most require florescent dies to label different cells. This to more easily distinguish between different cells. These dies can be toxic and often have a short lifetime and is only used in research and specific clinical application. There are methods to this without florescent dies but they require bulky dual-axis scanning mechanism. This increases both the size and complexity of the system [28].
Lior Golan et al. [28] proposes a new technique where they utilize the unidirectional flow of a blood vessel. They study a single blood vessel and a transverse spectrally encoded line is shon on the vessel. The reflectance of the cells flowing in the vessel can then be recorded. With this they manage to directly and continuously monitor blood in side the patient without the use of dies. By applying image-analyses on the resulting images blood count can be calculated [28].
2.3.7 Blood flow
Measuring blood flow in different tissues have several application. One being that if the tissue is cut off from a constant blood flow it no longer gets any nutrients and also waste products are not removed. This can lead to tissue damage such as pressure ulcers among other things [10].
Optical measurement methods such asLaser Doppler Flowmetery (LDF)andPPGcan be used to measure the flow. PPGis the method described in Section2.3.5if the signal is there, it means that blood is flowing. LDFuses laser and one studies the frequency shift of a laser beam. When the laser beam hits the red blood cells the frequency is shifted due to the speed of the blood cell. Light that is scattered by the static tissue is not frequency shifted and keep the same frequency as when it entered the tissue. Jimmie Hagblad [10] combines these two methods in his Licentiate Thesis to study the blood flow of different depths. He created a sensor that places the LEDs required or both measurement on a single soft probe. To make sure the two methods do not disturb each-other they are switch between with a small delay in-between [10].
Another method is to study the magnetic disturbance created by the blood flow in a localised magnetic field. Chee Teck Phua and Ga¨elle Lissorgues studies this by placing a small magnet on a major blood vessel. This magnet acts as a biasing field at the same time as a uniform magnetic flux for blood flow disturbance. This detects theModulated Magnetic Signature of Blood (MMSB). The advantage of this above an optical measurement technique is that is does not require a good optical contact [29].
2.3.8 Body temperature
A normal core body temperature is around 37◦C and varies during the day. During strainius activities the body’s temperature can increase to as much as 40◦C. This is because the body’s cooling system is not at first as effective and fast as the heating form the muscles. Body temperature is often measured in the mouth, ear or anus since it is in the closest correlation with the core temperature and relatively easy to access [6].
When continuous monitoring is desired or if the subject is to be doing anything else than take there temperature the above listed measurement techniques are not practical. There are also
mea-surement techniques (and commercially available products) to measure the tympanic membrane. Several research groups have studied the possibility to measure this continuously [30,31].
Carlo Alberto Boano et al. [31] have created a system that are compatible for runners. The movement of the runners can easily disturb the sensor data as well and re-position the sensors so that the measurement become faulty. As well as outside influences such as rain, sunlight etc need to be taken in to consideration. The group develops a measurement device that covers one ear with a resizable headset to provide a more secure fit. With this device they manage to track the temperature both of the tympanic membrane and the outside of the ear of three test runners during a marathon race without disturbing the runners too much. The head peace was ”Well-accepted by
all marathon runners” [31].
J. Miguel Sanches et al. [30] proposes a similar modes to be integrated in to a Bluetooth⃝Rheadset.
Their main focus is to study the rhythm of melatonin. This is hard to measure in real time but does have a correlation between the level of melatonin and body temperature so for an indirect measurement body temperature can be useful. They manage to get a product that are small and energy efficient enough to do 24h testing. The storing and calculation of data is performed in the mobile phone paired with the Bluetooth⃝Rdevice [30].
Another method to estimate the core temperature is to measure the temperature of the skin. The further away from the core the measurement are preformed it is more prone to errors. Espe-cially for different ambient temperatures. For example measuring the temperature of the foot will vary a lot dependent on ambient temperature. However if the measurement is preformed near the core or brain, such as forehead, abdomen or chest the varied dependent on ambient temperature is smaller. It is still there but are in most cases probably possible to compensate for as stated by Olav Sand et al. [6].
2.3.9 Cortisol level
Cortisol is a stress hormone that is excreted by the adrenal cortex. Cortisol is part of the human digestive system and stimulates the degeneration of fat and proteins. Lengthy periods with high levels of cortisol can increase the risk of osteoporosis decreased muscle mass as well as impairing the immune system. If these high levels coincide with growth periods can the hormone impede growth [6].
Cortisol is most often measured with a blood sample but the invasiveness and cost of such a test drives researchers to try to develop alternative methods [32]. One method is to test the cortisol levels in saliva, usually these are performed several times during a 24h period to then be sent to a lab [33].
Masaki Yamaguchi et al. [34] wanted to speed up this process and developed a dry-chemical strip to facilitate point-of-care measurement of salivary cortisol using disposable strips and a reader small enough to keep on a desktop [34].
Another method is proposed by A. Garc´ıa-Cort´es et al. [32] is to scene the cortisol level in sweat. They do this by a so called electronic nose that consist of a series of gas sensors with different selectivity. Their nose can detect concentrations between 5µM and 50µM [32].
2.3.10 Eye Movement
Studying eye movement can be used to estimate human vigilance in a task. Drowsiness mainly at work can be a real issue if the person is operating for example a vehicle or high accuracy operators. Several techniques for monitoring drowsiness by monitoring eye movement have been developed. Mainly this is done with cameras monitoring eye movement and blinking patterns.
It can also be monitored by measuring the electrical activity from the muscles of the eye. Traditionally the electrodes are placed around the eyes using a method calledElectrooculogram (EOG)[35].
For monitoring systems to be used in real life application this is inconvenient. Hao-Yu Cai et
al. [35] proposes a model where the electrodes are moved to the forehead. Making it possible to integrate these into a headband or hat. They were successful in their test and had a 93% correlation for eye movement compared to a reference standardEOG[35].
3
Method
All of the responses studied in the background is not possible to implement in the desired system. Either because of the characteristics of the system (portable, contiguous and real-time) or of size and time constraints on the thesis. After the initial study it was decided to continue to develop two modules. One that utilise thePPG measurement technique to measure heart rate and estimate breathing rate as well as blood oxygen level and the other to measureSC. It was also decided to integrate a off-the-shelf temperature sensor to measure the skin temperature in both modules. The
PPGmodule were to be used on the earlobe in order to keep the hands non-obstructed as well as not affect the subjects hearing. TheSCsensors were to be possible to mount on several location and have room for different length straps to be attached. The motivation behind this decision can be read in section3.1. For details of the modules see Sections 4 and5 respectively. Information of the temperature sensor can be read in Section 6. For the two modules there are surrounding electronics that are the same, micro-controller power management ect. Details of these can be found in Section 7. Basic firmware to collect data and send it along to a secondary processing device have also been developed, information about this can be read in Section8.
3.1
Motivation
Initially the modules are to be wired to reduce complexity, in the future there is a desire to be able to make them wireless and battery powered. This have been kept in mind during the development. Eye-movement could be measured with cameras, a feasible solution for ADHDdiagnosis that take place in front of a computer monitor. The system however is desired to be an electrical system that possibly could be used in several situations, not onlyADHD diagnosis. A camera approach would also mainly be an image-processing, and thereby outside the scope of this thesis that focus on electronics. The electrical approach of designing aEOGwould require electrodes to be placed in the face and even if Hao-Yu Cai et al. successfully created a method to implement these in a headband (presented in section2.3.10) the most likely position of the electrodes would be close to the eyes, something most people would likely find discomforting and the solution was excluded. AnEOGsystem would however be possible to implement into a system like this.
The methods presented on blood-count were considered bulky and/or overly complicated. The same was found for measuring cortisol level. The methods found was decided to be in a too early stage of research or too complicated to be able to fit into the level and time constraints of the thesis. Also a swift research in to suitable components yielded no interesting results.
The heart-rate, blood oxygen level and breathing frequency can be measured with PPG if a good quality signal can be achieved. Since several responses could be monitored from one signal it was decided to implement aPPGsystem.
A method of measuring blood pressure for a system like this one is the PWTT, this method also does not necessarily require the use of the patients hands. The above mentionedPPGsignal could be part of a system estimating blood pressure thoughPWTT, the other could for example beECG. Time constraints of the thesis however limits the possibility of implementing two system for pulse measurement since other responses were considered higher priority than blood pressure in an initial stage.
The blood flow measurements is a somewhat double sided problem, just measuring that there is a flow in the body will not provide useful information, however this could be measured with an appropriate PPG system. What generally makes blood flow interesting is where it is being measured. This most likely demands a custom made sensor, such as the one Hagblad developed (see section2.3.7). This response had the same faith as theEOGin the end, it would be possible to implement in a system like the one desired but its information was not prioritized and due to time constraints will not be implemented.
To measure perspirationSCis a viable option for a system like this. Studying the compound of perspiration is considered too complicated and expensive for this thesis. A quick search for appropriate components for pH-measurement or compound like the electric nose yielded viable results. MeasuringSC could be done by creating a small module that could be placed at several places.
temperature sensor if performed at central parts. Central part of the body generally lies a few degrees below the core but are less sensitive to ambient temperature differences. If the core temperature rises the skin temperature in central parts will generally go up as well. It is also connected to what is sometimes called centralization than can occurs in stressful situations where blood in moved from extremities to the core, this will increase the temperature of the core and lower the temperature is example fingers. Studding this temperature difference can help estimate the state of the person.
3.2
Tools
To realise the prototypeComputer Aided Design (CAD)software have been used. For electronics CADSTAR 8 [36] have been used both for schematics and Printed Circuit Board (PCB)design. Images drawn for this report have been drawn using a free on-line tool called draw.io [37]. The firmware have been written using MPLAB X IDE 2.35 [38] and programmed to the device with ICD 3 In-Circuit Debugger [39].
The system consist of modules meaning that one module were to be developed from idea to finished prototype. Then this process was to be repeated as many times as could be fit in to the time plan. In the original time-plan two modules were planned. As stated before robustness had priority over the number of features on the final prototype and only one module, thePPGmodule were realized. The theory and design have been developed for theSCsensor as well but have not been physically implemented. In Sections4 and5details of the separate modules are provided.
4
PPG-module
The theory of PPG can be read in Section 2.3.5. In short it works by illuminating the tissue and studying how it is absorbed. This can be done in reflective or transmissive mode. Motion control have developed severalPPGmodules before all of them have been utilising reflective mode measurement. The experience of Thomas Jansson at Motion Control[40] is that a transmissive mode sensor would be less sensitive to movement. When the pressure against the skin varies the intensity of light will be different. This hold true for both ways of measurement. In reflective mode there have been discussions that the light might take a shortcut from sender to receiver and there by cancel out all of the signal while it in transmission mode would more likely only affect the strength of the signal. This makes the reflective method less attractive, however limits the possibilities to perform measurement to extremities. A common place to perform this measurement in commercial products today is on the fingers. The hands are however used in most activities performed on a daily basis. To reduce impact on the test subject and to open up for the possibility for long-time monitoring it was decided to do the measurement on the earlobe instead of a finger. One complete sensor was found that possibly could be implemented into the system. This however only measured heart rate and did this in reflective mode. During brief tests of the sensor it turned out to be highly sensitive to ambient light, movement, fit and pressure against the skin. Also it only measured heart rate and could not estimate blood-oxygen saturation or breathing rate. This made the sensor less attractive and instead custom made electronics were created.
4.1
Block diagram
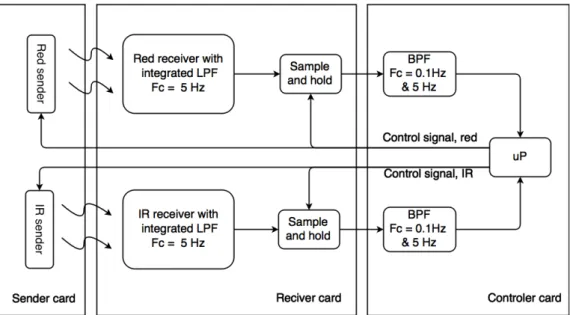
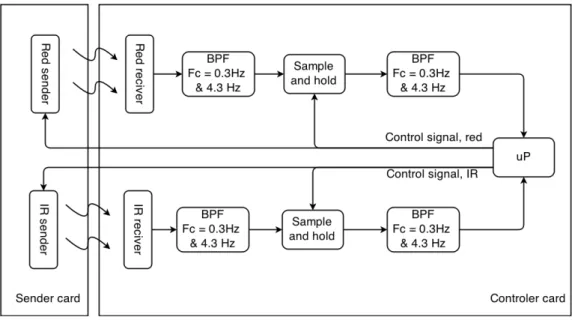
The original idea for thePPGmodules analogue signal conditioning can be seen in Figure3. Since the sensor is desired to be used on the ear-lobe it is required to follow the anatomy of the ear. On top of this it the measurement is desired to be performed in transmissive mode. The first idea was to split the card in to three parts to be able to shape the prototype more closely to different ear shapes. One that transmit the light that was to be studied, one to receive the light transmitted through the tissue and one where the micro controller were to be placed. This divide can be seen in the block diagram in Figure3by the three large boxes grouping the boxes of the diagram.
Figure 3: Original block diagram of thePPGsensor with its analogue signal conditioning.
To reduce complexity and after discussions that it might be enough to shape the card the receiver and micro controller card was merged in to one card during the development of thePCB. Leaving the prototype to only be divided in to two cards, the block diagram of thePCBcreated can be seen in Figure4. This card have later been patched to a slightly different functionality in
the end design, what was changed can be read in Section4.7.2.
Figure 4: Block diagram of thePPGsensor prototypePCBlayout.
4.2
Sensor PPG
For the sensor of thePPGmodule it is required to have a light source and a light sensor. Preferably the light-source are to have a narrow beam of light while the light sensors should have a narrow spectral range of sensitivity. The light-source peak wavelength should be near that of the receptors maximum reactants peak. This so that the energy is directed where desired and the light sensor be less sensitive to light pollution from the surroundings. In addition a light source with a high intensity will help yield a strong signal.
Even though two measurements are performed in different light spectrum’s it can be beneficial if they are similar when it comes to size, chip-style, beam angle ect. This because the two signals need to be compared for measurement of the blood oxygen level. If one signal is received more efficiently or significantly more amplified or filtered it can yield incorrect results. Because of that it is beneficial if the two wavelength are emitted, absorbed and process as similarly as possible. Calibration will still be needed but the more alike the signal are the better. Unfortunately it was discovered that components are divided in to the visible spectrum and Infra-red (IR) spectrum. This meant that similar components for both wavelength was significantly reduced for bothLED
and light-sensor. More on this Section4.5.
4.3
Filters and Amplification
The heart-rate of a human adult is around 60-180bpm, translated to Hz that are more commonly used in electronics this yields a frequency of 1-3Hz. Repository rates are usually between 6 to 30 breaths per minute meaning theRIIV than can occur on the signal is usually around 0.1-0.5Hz. The signal that the sensor yields are small and prone to noise and need to be both filtered and amplified. It was decided in this first prototype to not separate the heart-rate and breathing-rate portions of the signal with the analogue filter but to leave this to digital signal conditioning.
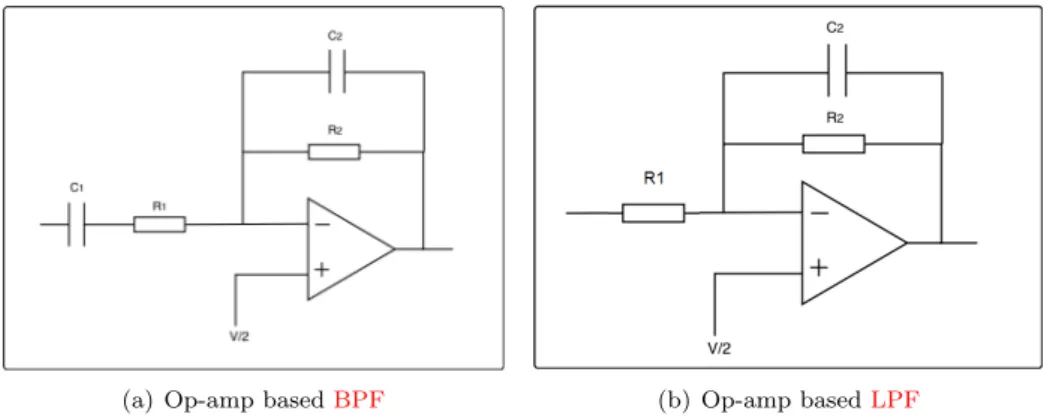
The signal need to be amplified at the same time as keeping the low frequencies of the relevant signal. First intuition can then be to only use low pass filters. This however makes the equip-ment more sensitive to variations of tissue depth since the DC level is kept, and from experience movement and skin contact. Also because of the small signal range (0-3.3V) if the DC part was kept the signal had a tendency to drift outside the signal range when it was being amplified. The
filters used are active first-orderBand Pass Filter (BPF)andLow-Pass-Filter (LPF)like the ones in Figure5.
(a) Op-amp basedBPF (b) Op-amp basedLPF
Figure 5: Filters to be used for the analogue conditioning of thePPGmodule
The low frequencies require large and resistors and capacitors. The cut off frequency of the filters are decided by Equation4 and the gain by Equation 5. This have been a big challenge to trim the filters to desired preference. The large components cause problems for the Operational Amplifier (OP-AMP)that could not handle such a large load.
F c = 1 2π∗ Rx∗ Cx (4) G =−R2 R1 (5)
4.4
Sample and Hold
In order to detect the blood oxygen level, both how red andIR are absorbed by the tissue need to be measured simultaneously. However the receptors for the two wavelengths reacts to both wavelengths and get disturbed if the opposite wavelength is on. To work around this problem the measurement is performed by only have one of theLEDs shining at a time. Since the bodily functions are so much slower than the reactions of the electronics. Several measurement points for both wavelengths can be performed in each cardiac-cycle so the non-contiguous measurement is in itself not a problem. It will however make the signal fluctuate and it will not be a smooth signal when the output is visualised. Therefore aSample and Hold (S/H) were implemented to reduce this fluctuation.
AS/Hworks by having a capacitor that gets charged by the signal. Then then the signal gets cut off, the capacitor then keep the level that it was charged to (ideally), this is illustrated in Figure6. The capacitor will obviously discharge causing some fluctuations to still be percent but it will be allot less than before [41].
The original idea here were to use a OP-AMP with a shut-down option as the switch in the
S/Hbut it was later changed to a P-channel MOSFET. MOSFET are beneficial in this application they have a more distinct ON/OFF functionality than bi-polar transistors. There were however difficult to find a MOSFET for the small signals used especially without internal safety-diode. In this application it allows for the signal to escape when the MOSFET is closed and there by the sample-and-hold turned in to a sample-and-release (not desired). To fix this a diode was placed to stop the signal from leaking backwards. This caused a voltage drop across the diode. It solved the problem of the sample and hold but caused problem for the filtering of the signal, see Section
4.7.2.
In the end the functionality of the sample and hold were replaced by software and the electronics were by-passed. How this was done can be read in section8.1.
Figure 6: A sample and hold and how it affect the signal. The switch is opened and closed and the capacitor charges and discharges accordingly. Black (smooth signal) is the original signal that is going to be sampled. Red (squared) is the ideal sampled signal. The Blue (dashed) is a representation of what a real signal might look like.
4.5
Required components
In order to reduce weight and size surface mounted components were primarily studied. For light source aLED is the natural choice. It is widely available, power efficient, small and generally do not generate as much heat as other light sources. However when it came to finding similarLED
for both red andIR there were still some difficulties. Vishay[42] was the only manufacture found that madeLEDsin the same chip-type for both red andIR wavelengths. This is what ultimately separated theLEDsused from all of the ones available on the market and was the main reason for the decision to use VLMH3100[43] as red LEDand VSMB3940X01[44] as theIR LED.
When it comes to light sensors there are more options available. There are Light-Dependent-Resistors (LDR), photo-diodes or photo-transistors. LDRare generally not used for this application since they do not generally react on a specific wavelength[45] and were excluded form investigation at an early stage and no LDR was tested. Photo-diodes are considered faster in their response but give out a smaller signal since there is a current amplification in the transistor of the photo-transistor[41]. The pulse changes incredibly slow electricity speaking. A heart rate of 180bpm, that is considered a fast heart rate, still only yield a frequency of the signal of 3Hz. The extra speed of a photo-diode is therefore not really necessary.
The main focus have been put on finding photo transistors, for the IR spectrum there are several components straight off-the-shelf to choose from. For the red on the other hand there were a bit more of a challenge. There were not many available light sensors with a peak wavelength in the red spectrum. A few ambient light sensor, most with peak wavelength in the green spectrum, were available that have such a broad spectral range that red also are detected. Because it was difficult to distinguish what sensor were best suited from their data sheet specifications it was decided to buy and test a few sensors. This test can be read in Sections4.5.1and4.5.2
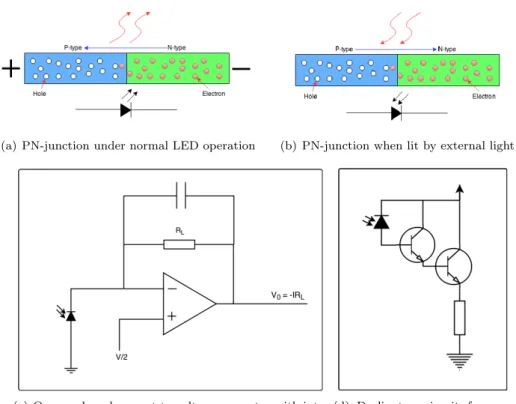
There is also a third option, sometimes used inPPG[45]. That is to utilize the fact that when a commonLEDin exposed to light a negative current is created. ALEDconsist of two materials, one that has a shortage of electrodes, called P-type, and the other have an excess of electrons, called N-type. In-between these materials is what is called a PN-junction. The electrons in the P-type material have a lower energy level, meaning that it is more appealing for the electrons to be there. However it need a nudge to be able to move from one material to the other. Under normal operation, seen in Figure 7(a)external energy is applied, nudging the electron from the N-type material in to the P-type. When the electron reaches this lower energy level the excess energy is relished in the form of a photon. The wavelength of the photon, and with that the colour of light is decided by the material in the N- and P-type materials. However if the junction is instead illuminated the energy of the photon can instead be absorbed by an electron in the P-type material and the energy absorbed causes the electrode to jump to the N-P-type material. This create a movement of electrons and there by a negative current. This phenomenon is illustrated
(a) PN-junction under normal LED operation (b) PN-junction when lit by external light
(c) Op-amp based current to voltage generator with inte-grated low pass filter. This solution was not used in the final product.
(d) Darlington circuit for cur-rent amplification. Solution used inPPGmodule.
Figure 7: Illustration of anLEDwhen supplied with external power (normal operation) or illumi-nated, and how this could be used in a system
The original idea was to utilize this phenomenon for both wavelengths and use a current-to voltage OP-AMP based converter, seen in Figure 7(c). By adding a capacitor to the feedback loop integrate aLPF to this circuit[46]. However testing showed that the LED chosen gave out to little current for theOP-AMP to amplify. A lager LED generated a larger current but were considered too bulky for the application. Instead a Darlington pair was connected to amplify the current from the diodes. A Darlington-pair is a current amplification using two NPN-transistors. The two transistors share a common collector while the drain of the first transistor is connected to the second transistors gate[47]. The circuit can be seen in Figure7(d).
It was decided that the most efficient way to see what sensor solution would work here it was to purchase a few sensors and test them out. The tests can be read in Sections4.5.1and4.5.2.
4.5.1 Sensor red
Measuring red light generally has no application. Therefore not many manufactures produce light sensors with a peak value in the red spectrum and sensor options were limited. A few ambient light sensors with a peak in the green spectrum, around 570nm, reacted on such a broad spectrum according to their data sheet that red could possibly be picked up with acceptable strength. Three of light sensors were purchased and tested to see if they could work for this application. Their names and some of the data provided in the data sheet can be read in each components table in Table2,3 and4.
These were then tested together with the red LED connected as a photo diode to see what component gave the best performance for this application. Positive characteristics are given below
• Large signal strength
• Large difference in signal strength between when no light and full light intensity is applied. • Low reactants when the opposite wavelength light is applied.
TEMT6000X1 Photodiode build to react in a similar way as human eyes, suggested for cameras and automated screen lighting for ex. cell phones.
Parameter Min Typ Max Unit Condition
Kind Red(green), photo diode
Sensitivity (IC) 20 mA Ee=0.1W/cm2
Wavelength peak 570 nm
Table 2: Parameters taken from the data-sheet for TEMT6000X1[48]
ALS-PT19-315C Light sensor in the form of an photo transistor, according to data sheet shouldn’t absorb infra read light
Parameter Min Typ Max Unit Condition
Kind Red, photo transistor
Sensitivity (IC) 5 15 mA Ee=100 Lux
Wavelength peak 630 nm
Table 3: Parameters taken from the data-sheet for ALS-PT19-315C[49]
APDS-9007-020 Light sensor with analogue output, logarithmic output in correlation with light intensity, beneficial for applications with allot of ambient light.
Parameter Min Typ Max Unit Condition
Kind Red, light sensor
Sensitivity (IC) 5 15 mA EC=100 Lux
Wavelength peak 630 nm
Table 4: Parameters taken from the data-sheet for APDS-9007-020[50]
The test was carried out on the 13th of March 2015 in the lab area at Motion Control facilities in V¨aster˚as and the florescent light in the ceiling was on. It was preformed twice once with a black plastic box covering the test electronics to shut-out ambient light and once without the box, otherwise the two tests were the same.
Since the system were to be run with 3.3V supply the same was used here. It was supplied by TTi EL302RT Tripple power supply, with a current limit of 200mA2. The current and voltage was measured with two DMM Agilent 34410A, one measured current and the other voltage. Both measuring devices were connected simultaneously and continuously. The LED were also supplied with 3.3V from the same power source with a 33Ω resistor in series the 1 cm distance was approx-imated with the help of a ruler. The components were connected according to recommendation in their data sheet if it was provided. The light sensor were all connected according its respected diagram in Figure8. The load resistor for the photo-transistors varied. The Equation6[49] was used to determine the size of the load resistor RL.
Vout(max.)= IP H(max.)∗ RL (6) Using Equation6 yields RL for the ALS-PT19-315C to be 18kΩ and for TEMT6000X1 to be 56kΩ.
The results of the measurements can be found in Results Table 11and 10. The voltage mea-surement for ALS-PT19-315C are missing for this test. Since the purpose here for the sensor was to measure red light and it reacted more toIR in this test it was decided not to redo the test to obtain the missing values.
4.5.2 Sensor IR
ForIR-light there are several receivers available. With the desire to use surface mounted devices and also when it was decided to use the redLEDas light sensor the two following was the most
(a) Schematic for APDS-9007-020 test con-nection
(b) Schematic for how the LED was connected
(c) Schematic for how the photo transistor was connected
Figure 8: The different connections for the components in testing their performance for use in
PPGmodule
interesting choice for infra red sensor. They have the same chip style as the red andIR LED, this meant, in this case, that the two sensors have same beam width. Both of the sensors have a version with a coloured lens that help filter out light of other wavelength. Here though the clear lens is used because of availability. In Table5and6 part of the data sheet is summarized.
OP501 Photo transistor with the possibility to have a coloured lens filtering out light of other wavelength than infra red
Parameter Min Typ Max Unit Condition
Kind Infra red photo transistor
Sensitivity (IC) 0.1 15 mA Ee=0.15 mW/cm2
Wavelength peak 900 nm
Table 5: Parameters taken from the data-sheet for OP501[51]
SFH320 Photo transistor with the possibility to have a coloured lens filtering out light of other wavelength than infra red.
Parameter Min Typ Max Unit Condition
Kind Infra red photo transistor
Sensitivity (IC) 15 µA Ee=0.15 mW/cm2
Wavelength peak 900 nm
Table 6: Parameters taken from the data-sheet for SFH320[52]
It was decided to test these to and the IR LEDwith the same method as the red LEDto be able to compare the results. When ordering the components it was discovered that OP501 was no longer in production and was not possible to test or use. The test was carried out in the same way as it did for the red. And in a similar fashion both being able to sense theIR LEDand to ignore the redLEDand other light pollutions was considered positive characteristic’s. The test was carried out on on the 13th of March 2015 in the lab area at Motion Control facilities in V¨aster˚as and the florescent light in the ceiling was on.
The components were supplied by TTi EL302RT Tripple power supply, with a current limit of 200mA3. The current and voltage was measured with two DMM Agilent 34410A, one measured current and the other voltage. Both measuring devices were connected simultaneously and
uously. TheLED were also supplied with 3.3V from the same power source with a 33Ω resistor in series the 1 cm distance was approximated with the help of a ruler. The components were connected according to recommendation in their data sheet if it was provided. The Equation6in Section4.5.1was used to determine the size of the load resistor RL to 33kΩ for the SFH320. The test was preformed twice for theIRsensor as well, once with a black plastic box covering the test electronics to shut out ambient light and once with out the box. The test result can be read in Tables12and13in the Result section. The voltage measurement of VSMB3940X01 is not a typo, the results have been double checked but no significant voltage change was detected.
4.5.3 Operational amplifier
There is a verity ofOP-AMP available on the market, most specialised in some way. Some key points that makes for a suitableOP-AMPfor this application are. Low input bias current so that incorrect amplification can be avoided. Low noise, the signal is already noisy it is not desired that theOP-AMP add more noise in to the system. Since the module is in the future to be battery operated and to be compatible with the DVG communication module the OP-AMP need to be single supply with a minimum requirement of 5V. Because of the small signal range, a rail-to-rail is required to maximize signal range. For theS/H a shut-down option would be nice but is not required.
SeveralOP-AMPswere investigated, the top candidates are presented with their strengths and weakness for the different parts of the system in Tables7,8and9
OPA336 Single supply, micro-power CMOS amplifier Micro-AmplifierTMSeries. Suggested for Medical instrument, photo-diode pre-amps battery pow-ered applications and high impedance applications
Parameter Min Typ Max Unit Condition
Packages SOT-23-5 SO-8 MSOP-8 SSOP-16 Surface mount
Supply 2.3 5.5 V
Input bias current (IB) ±1 ±10 pA +25◦C
Noice 3 µVp−p f=0.1-10Hz
Voltage Output Swing from Rail
3 mV RL= 100kΩ AOL 70dB
Offset drift ±1.5 µV /◦C dVDS/dT
Temperature range -55 +125 ◦C Operating range
Table 7: Parameters taken from the data-sheet for OPA336[53]
OPA340 Single supply, Rail-to-Rail Micro-AmplifierTMSeries. Suggested for A/D converters, Audio processing, Active filters, Test Equipment
Parameter Min Typ Max Unit Condition
Packages SOT-23 SO-8 MSOP-8 SO-14 SSOP-16 Surface mount
Supply 2.7 5 V
Input bias current (IB) ±0.2 ±10 pA +25◦C
Noice 8 µVp−p f=0.1kHz-50kHz
Voltage Output Swing from Rail
1 5 mV RL = 100kΩ AOL 106dB
Offset drift ±2.5 µV /◦C dVDS/dT
Temperature range -55 +125 ◦C Operating range
Table 8: Parameters taken from the data-sheet for OPA340[54]
4.5.4 Conclusions from Components Investigation
LMV341 Rail-to-Rail output CMOS, with shut-down. Suggested for portable/-battery powered, filters, sample and hold circuits
Parameter Min Typ Max Unit Condition
Packages SOT-23 SOIC-8 TSSOP-14 Surface mount
Supply 2.5 5.5 V
Input bias current (IB) ±1 ±120 pA +25◦C 2.7V supply
Noice 40 nV /sqrtHz f=1kHz
Rail-to-Rail 3 mV RL = 100kΩ AOL 70dB
Offset drift ±1.7 µV /◦C dVDS/dT
Temperature range -40 125 ◦C Operating range
Table 9: Parameters taken from the data-sheet for LMV341[55]
transistor were complemented with external transistors creating Darlington-pairs. The transistor used were the BC817[56] after recommendation from a retailer. With this complement these were the options that reacted most efficiently to their own wavelength at the same time as being best at ignoring the opposite wavelength. With the Darlington-pairs the signal was already converted from a current to a significant voltage. And the current to voltage converter were no longer necessary. Still the signal obtained requires to be filtered and amplified, to do thisOP-AMPwere required.
TheOP-AMPLMV341 was mainly considered for theS/Hbut due the size of the component and to reduce the number of different components it was decided that this could be replaced by buffers and a p-channel MOSFET transistors.
Ultimately the OPA336 was chosen in a quad-chip to reduce size. It had been used before at Motion Control and no issues had been documented. Also since its suggested application area coincide with the application this made it an attractive choice. In addition the noise measurement preformed by the manufacture were done on the low frequencies used for this project. Wile for the OPA340 have been tested at a much higher frequency. The actual noise level were not tested for eitherOP-AMP. Since it had been used before there were spare components available to test without having to order them. Even if it could not amplify the diode alone with the additional transistors initial tests suggested that it would be functional.
Test showed that the OPA336 had limitations in how big capacitive load it could handle. TheOP-AMPis also used to create a reference signal for amplification. To reduce noise on this reference, decoupling capacitor were placed. This however were too big for the OP-AMP and the reference started to oscillate corrupting the signal. By the removing the capacitors meant to decrease noise the oscillation were reduced.
4.6
Simulations
A few simulations were done early on to test the concept. The simulations were made using LT-spice IV [57]. To save time standard components were used for resistors and capacitors. An already available OP-AMP was also used instead of creating or finding a spice model for the OPA336, instead aOP-AMPcalled LT001 was used during the simulations.
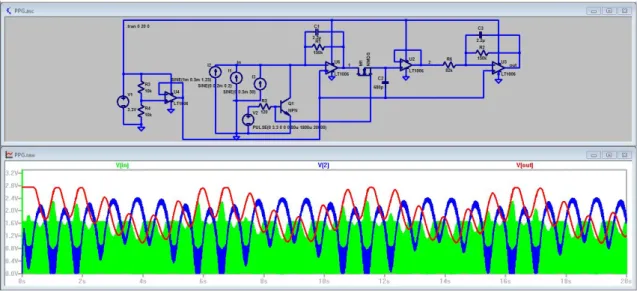
The simulations did give some useful information and insight in to the desired function of the system. However not allot of that was simulated have been kept in the current prototype. A screen shot from a simulation can be seen in Figure9. The simulations used onlyLPF, which later were be changed. It simulated the sensor as a pure ideal current source, and it was no problem for the
OP-AMPto convert the current. The current later turned out to be grossly over estimated. A App of 0.5mA is used in the simulation, the actual value turned out to be around 15nA for the diodes used in the system.
In Figure9 the left current source (I2) simulates the heart rate and represents a heart-rate of 75 bpm. The middle represents RIIV and represent a breathing rate of 12 breaths per minute. The third represent 50Hz noise, this was added to check that the filter actually filtered anything. The other two frequencies were supposed to be let though. To the left of the three current sources there is a bi-polar NPN transistor. This represents the LEDs being pulsed. When the control signal (generated by the voltage source V2 here to be controlled by the micro-controller later)
Figure 9: Early simulation of the PPG module
went high it would open the NPN, grounding the signal, and close the P-channel MOSFET in the
S/Hactivating it and when it went low the opposite occurs. By trimming the time the MOSFET is open and the size of the capacitor C2 a perfect output from the S/H could be achieved, in simulation.
![Table 1: Perfusion index of red light in different parts of the body[8].](https://thumb-eu.123doks.com/thumbv2/5dokorg/4750567.126187/14.892.259.637.125.220/table-perfusion-index-red-light-different-parts-body.webp)
![Table 3: Parameters taken from the data-sheet for ALS-PT19-315C[49]](https://thumb-eu.123doks.com/thumbv2/5dokorg/4750567.126187/23.892.121.768.450.562/table-parameters-taken-data-sheet-als-pt-c.webp)