Mälardalen University
School of Innovation, Design and Engineering Västerås, Sweden
Thesis for the Degree Master of Science in Software Engineering 30.0 credits
Measuring Combinatorial Coverage
of Manual Testing
Miraldi Fifo
mfo12002@student.mdh.se
Examiner:
Associate Professor Wasif Afzal
Mälardalen University, Västerås, Sweden
Supervisor: Dr. Eduard Paul Enoiu
Abstract
Introduction:
Software testing is a very important activity which assures the quality of the software under test. It becomes crucial in safety-critical systems, where an unexpected behavior of the software can even cause loss of human life or environmental disasters. However, in such complex systems it becomes infeasible to test all possible software scenarios for possible faults. Experience shows that software faults, which can cause unexpected software behavior, are caused by the interactions of variables of the tests. Combinatorial testing is the technique which focuses on the variable interactions of the tests and aims to reduce the number of tests needed to cover all software scenarios while still preserving a high fault detection rate.Background:
Manual testing is the technique used to assure software quality in Bombardier Transportation AB, a Swedish company whose focus is on rail transport and development of trains. Since this process depends on the skills of the engineers, it can result in a large portion of tests not created and consequently in a large number of scenarios uncovered with tests. Therefore, combinatorial testing technique is used to measure the combinatorial coverage of these tests created from experienced engineers. Many comparisons of manual testing and other testing techniques in terms of test coverage, code coverage or mutation analysis. To the best of our knowledge there are no other studies in literature that have measured the combinatorial coverage of manual tests designed from experienced engineers, for different strength interactions of the variables of the tests nor other available tools that generate the number of missing tests to achieve full combinatorial coverage for specific interactions.Aim:
The goal of this thesis is to answer the two research questions: RQ1. What is the combinatorial coverage achieved by tests manually created by experienced engineers in industry? RQ2. Can the effectiveness of manually created tests be improved in terms of combinatorial coverage using combinatorial testing?Method:
In this thesis we investigate the combinatorial coverage of manually created tests by engineers working in industry and the implications of using combinatorial testing in practice. The Combinatorial Coverage Measurement(CCM) NIST tool is used to measure the test coverage achieved. The research questions are answered by the following steps: 1) Review the scientific literature for related work, 2) Refine thesis research questions based on the previous step, 3) Propose the case study design and perform the measurements needed for data analysis, 4) and the results are analyzed and discussed in terms of test efficiency (i.e., number of test cases) and effectiveness (i.e., achieved combinatorial coverage).
Results:
The 2-way interaction combinatorial coverage achieved by manual tests is 78.6% on average, 57% for 3-way combinatorial coverage, 40.2% for 4-way combinatorial coverage, 20.2% for 5-way combinatorial coverage and 13% for 6-way combinatorial coverage. Full combinatorial coverage can be achieved for 2-way and 3-2-way interactions by adding eight and 66 missing tests on average, respectively. For 4-way interactions full combinatorial coverage can achieved by adding 658 missing tests. For 5-way and 6-way interactions full combinatorial coverage can be achieved by adding 5163 and 6170 missing tests on average respectively.Conclusion:
The combinatorial coverage decreases as the strength of interactions increases. The effectiveness of the tests can be improved for 2-way and 3-way interactions and fully or partially improved for 4-way interactions, depending on the decision of engineers to add all missing tests or part of them, since the number of missing tests is increasing significantly, thus resulting in a very large number of tests to be added. It is not particularly efficient to improve test effectiveness by augmenting manual tests cases using combinatorial testing for higher strength interactions, since in most of the tests suites we studied one would need to generate additional 10.000 missing tests. This is explained by the exponential growth of the number of variable combination for such interactions.Acknowledgments
First of all, I want to thank my supervisor Eduard Paul Enoiu for his patience and support throughout this thesis. I am sure that without his suggestions and help, the process of writing this thesis would have been much more difficult than it actually was.
Secondly, I want to thank my family for their unconditional support and love. These two elements were crucial for me to overcome the difficulties.
Last but not least I want to dedicate this work to my beloved grandparents, whose principal dream during this period was to see me achieve this goal.
Table of Contents
Table of Contents Introduction ... 9 1.1 Problem Description ... 10 1.2 Contribution ... 10 1.3 Overview ... 12 Background ... 132.1 Programmable Logic Controllers and Function Block Diagrams ... 14
2.2 Related Work ... 17
2.2.1 Combinatorial testing ... 17
2.2.2 Combinatorial coverage ... 27
Case Study Design ... 31
3.1 Problem Formulation ... 31
3.2 Method ... 32
3.2.1 Measuring Test Efficiency and Effectiveness ... 33
3.2.2 Manual Testing ... 33
3.2.2 NIST tool for Measuring Model Coverage ... 34
Results and Analysis ... 39
4.1 Results Q1: What is the combinatorial coverage achieved by tests manually created by experienced engineers in industry? ... 39
4.2 Results Q2: Can the effectiveness of manually created tests be improved in terms of combinatorial coverage using combinatorial testing? ... 50
Discussion and Validity Threats ... 65
5.1 Discussion ... 65
5.2 Validity Threats ... 68
Conclusion and Future Work ... 71
6.1 Conclusion ... 71
6.2 Future Work ... 72
Bibliography ... 74
List of Figures
2.1 The truth table for a given predicate (a ∨ b) ∧ c………....13
2.2 100% 2-way combinatorial coverage……….14
2.3 Architecture of a PLC software………...15
2.4 Simple Function Block Diagram………....16
2.5 Hardware structure of a PLC………17
3.1 Example of a test array with four binary variables taken from……….34
3.2 The levels of coverage for all variable combinations based on an example…………...35
3.3 The graph with the results of 2-way combinatorial coverage for a test array example………....36
3.4 An example of an input file for the CCM tool………..37
3.5 Graphical representation of CCM tool developed by NIST………...38
4.1 Box plot of combinatorial coverage for all t-way interactions………....41
4.2 Scatter plot of number of variables and number of manual tests for each test suite...41
4.3 Bar plot of number of variables for each test suite………..42
4.4 Bar plot of number of tests for each test suite………..43
4.5 Scatter plot of number of variable/values for 2-way interactions and 2-way combinatorial coverage for each manual test………...43
4.6 Scatter plot of the number of variable/values for 3-way interactions and 3-way combinatorial coverage for each manual test………...45
4.7 Scatter plot of the number of variable/values for 4-way interactions and 4-way combinatorial coverage for each manual test………...45
4.8 Scatter plot of the number of variable/values for 5-way interactions and 5-way combinatorial coverage for each manual test………...46
4.9 Scatter plot of the number of variable/values for 6-way interactions and 6-way combinatorial coverage for each manual test………...47
4.10 Statistics of a test suite with mean values for nr. of variables, nr. of tests and nr. of Variable-values………53
4.11 Statistics of a test suite with mean values for nr. of tests and nr. of variable-values and an additional variable to its mean value………....55
4.12 Statistics of a test suite with mean values for nr. of variables and nr. of variable values and a missing test to its mean value………...57
4.13 Statistics of a test suite with mean values for nr. of variables and nr. of tests and an additional variable-value to its mean value……….59
List of Tables
Table 4.1: Descriptive statistics for combinatorial coverage of each t-way
interaction……….39 Table 4.2: Inferential statistics for combinatorial coverage of each t-way
interaction……….48 Table 4.3: Statistics regarding average number of missing tests to achieve full Combinatorial coverage on each t-way interaction………..61
Chapter 1
Introduction
Software programs nowadays are widely used in a large number of domains to facilitate the working process and working procedures. Some of these software programs are used in safety-critical domains, where the behavior of the software is crucial for the safety of human lives and the surrounding environment. Indeed, an unexpected behavior of the software, called also a software failure, in a safety-critical domain can cause severe injuries or even loss of human life and environmental disasters. Therefore, software testing is becoming a very important activity to assure the quality of the software [5].
The software testing process consists in the creation of set of tests, called test suites, which enters inputs to the software under test. The results of each test are compared to the expected behavior of the software for such inputs. If the results of a test produce the same behavior of the software under test as the expected one, then the test has passed, otherwise it has failed. A failed test can detect a software fault which can be a potential source of a software failure. It is desirable to detect the faults as early as possible in the testing process, in order to not increase the cost of fixing them in later phases of this process. In order to detect all possible faults of the software, all possible software scenarios should be covered with tests. This technique is called stress testing. One scenario can involve the combination of several variables as the input of the software. In complex software programs, there can be a huge number of variables and possible values for each variable. In such cases, the stress testing technique becomes impractical due to the huge number of combinations to cover with tests.
Experience in software testing has shown that not every possible combination of values can produce a software fault. Furthermore, experience shows that software faults are caused by the interactions of software variables rather than by single variables. Combinatorial testing is a proposed testing technique that focuses on the
interactions of variables and aims, through combinatorial algorithms, to reduce the number of tests needed in the stress testing technique and to preserve a high fault detection rate. Combinatorial coverage is the measurement whose results reflect what extent of all possible combinations of variable interactions, for a given strength of interactions, is covered with tests.
1.1 Problem Description
Bombardier Transportation AB is a company in Sweden which is focused on rail transport and development of trains. In this company, manual testing is a widely used technique to generate tests for their safety-critical systems, which consist in managing the train controls. The software programs of these systems are executed on Programmable Logic Controllers (PLC). The manual tests are generated from experienced engineers of the company. These engineers can create these tests based on different test design techniques, intuition and previous experiences. This approach is clearly dependent on the skill of the engineers, and potentially it may leave a large proportion of the possible tests not created [3]. One consequence is that many test scenarios exercising the software under test can remain uncovered. Since these are safety-critical systems, it is important to achieve a high combinatorial coverage through these tests in order to assure the quality of the tests. Several tools that measure the combinatorial coverage of the tests are proposed in the literature. In this thesis, for such purpose is used the Combinatorial Coverage Measurement (CCM) tool, developed from the National Institute Standards and Technology (NIST) researchers.
1.2 Contribution
The safety-critical nature of the systems of Bombardier Transportation AB company makes crucial the process of improving their manual tests’ effectiveness in order to detect, as early as possible, possible faults that can be potential source of software failures during the software lifecycle.
In this thesis is shown how to perform measurements of combinatorial coverage on manual tests designed from experienced engineers using the CCM tool. In case the results show that the tests’ effectiveness is not satisfying, the thesis strives to give an answer if it is possible to improve these tests’ effectiveness by using combinatorial testing.
We hope that the thesis could also be able to provide experimental evidence on how experienced engineers can apply combinatorial testing to improve the effectiveness of their manually created tests. The objective of this thesis is to answer the two following research questions:
RQ1: What is the combinatorial coverage achieved by tests manually created by experienced engineers in industry?
RQ2: Can the effectiveness of manually created tests be improved in terms of combinatorial coverage using combinatorial testing?
We obtain the answer of these questions by measuring the combinatorial coverage of 33 test suites designed manually for several PLC programs. Each test suite contains a number of manual tests and number of variables. The measurements are performed with CCM tool and the results are evaluated in terms of level of combinatorial achieved with the existing tests and in number of missing tests to achieve full combinatorial coverage, improving this way the effectiveness of the tests.
Some studies [22,36] perform comparisons between the manual testing technique and other testing techniques in terms of test coverage, code coverage, mutation analysis by using other measurement tools. To the best of our knowledge there are no other studies in literature that have measured the combinatorial coverage of manual tests designed by experienced engineers, for different strength interactions of the variables of the tests nor other available tools that generate the number of missing tests to achieve full combinatorial coverage for specific interactions.
1.3 Overview
In Chapter 2 is given a background of combinatorial testing and combinatorial coverage and related work in this area of research. In Chapter 3 is presented the method that is used to generate the results which are displayed in Chapter 4. The results are displayed in terms of achieved combinatorial coverage of the manual tests for different strength interactions of variables and in terms of missing tests to achieve full combinatorial coverage for the respective interactions. In Chapter 5 the results are discussed and threats to validity of this study are presented. Finally, in Chapter 6 are shown the conclusions of the study and possible key aspects for future work.
Chapter 2
Background
Test coverage is one of the most important topics in software assurance and many different approaches [5] have been devised for determining software test coverage, mainly focusing on the program source code. Test quality evaluation is a particularly difficult and imprecise process for “black box” testing, where there is no access to source code [1]. Combinatorial testing can be a very useful and efficient component on software assurance [2]. Recently, combinatorial coverage has been proposed to measure the state space of the program input in the absence of knowledge about a program’s inner structure. The main goal of combinatorial methods is to cover as well as possible t-way interactions, in order to be able to detect faults.
Combinatorial coverage is known also as multiple condition coverage [5]. In the following example shown in Figure 2.1, for a given predicate (a ∨ b) ∧ c, there are three independent clauses a, b and c. Each of the clauses can have two possible values: true or false. The truth table is shown in Figure 2.1.
Fig.2.1 The truth table for a given predicate (a ∨ b) ∧ c
In the previously shown example, the 3-way combinatorial coverage is 100% because for 3 clauses with 2 possible values each, the input state space consists of 23=8 points, which are all represented in Figure 2.1. A predicate p with n
independent clauses, where each clause can have 2 possible values, has an input space of 2n points [5]. This means that if the number of clauses increases, it
becomes harder to find tests to cover all possible number of combinations (i.e., achieve combinatorial coverage). Let us consider the case shown in Figure 2.2
Fig.2.2 100% 2-way combinatorial coverage
The four rows in Figure 2.2 are extracted from the case shown in Figure 2.1. If 2 random columns are selected from the case above, the input state space would have 22=4 points. It can be observed that all these points are covered from the 4 rows
above, e.g. if the columns a and b are selected, the possible value combinations of a and b clauses would be TT, TF, FT, FF, which means all possible combinations are covered. The same fits for ac and bc columns. Thus, in this example there is a 100% 2-way combinatorial coverage. This is achieved although the possible number of combinations is smaller (i.e., from 8 in Figure 2.1 to 4 in Figure 2.2). This is a simple example which shows that there are different ways of covering all possible combinations. Testing all combinations can be very time consuming and can incur high costs. In practice, we can use different measurements methods in order to assess the quality of the created tests. Combinatorial coverage is one of these measurements.
2.1 Programmable Logic Controllers and Function
Block Diagrams
In this thesis are performed tests and measurements from test data collected from Programmable Logic Controllers. Programmable Logic Controllers (PLCs) are industrial computers that are designed to operate in real-time and to manage the process automatization of systems that have a high degree of complexity [23]. PLCs consists of a Central Process Unit (CPU), a programmable memory, bus systems and Input/Output (I/O) interfaces. The design of a PLC is shown in Figure 2.3.
Fig.2.3 Architecture of a PLC software [23].
The I/O interfaces are connected to sensors and motors which allows the system to interact with the environment. There are digital and analog I/O signals. The digital signals consist of discrete signals, e.g. switch on or switch off, 1 and 0. Analog signals represent continuous values which continuously vary in time, e.g. audio signal [23].
The International Electrotechnical Commission (IEC) defines the languages in which should be written programs that will be executed from the CPU of the PLC. These languages should comply with IEC 61131-3 standard. The CPU monitors the input interfaces, executes the program and updates the values in the output interfaces [23].
An advantage of PLCs compared to custom designed software is the possibility to easily get customized and their low price. Also an important feature of PLC is their reusability [24]. This feature reduces the cost and increases the effectiveness of systems which use PLCs. However, PLCs do not fully comply with IEC 61131-3 standard, therefore each PLC software should contain a document specifying which part of the PLC complies with the standard and which not [23].
One of the languages used to design PLCs is Function Block Diagram (FBD). A simple function block diagram is shown in Figure 2.4.
Fig.2.4 Simple Function Block Diagram [23].
In this diagram it can be observed that some parameters enter as inputs from the left of the diagram and after being processed in some blocks, the final result comes in the right part of the diagram as an output. In Figure 2.4 the blocks consist of logic operations XOR, OR and AND. In other scenarios these blocks can be counters, timers or self-implemented blocks that are designed from the engineers of the manufacturer of the PLC. The PLC delivers the output for which it is designed through the actions that these blocks perform on the inputs [23]. Function block diagrams are translated in program code and later compiled in machine code [25]. This program, which is translated from the Function Block Diagram, is executed in loop in the PLC. Each cycle includes three parts:
● The PLC reads the input values from the input interfaces.
● The processor of the PLC executes the program uninterruptedly ● The processor updates the outputs in the Output Interfaces.
In Figure 2.5 is shown the structure of PLC from the hardware perspective.
Fig.2.5 Hardware structure of a PLC [24].
Through the Programming device, the designed program is transmitted to the
Program and data memory and is finally delivered to the Processor. Then the processor, after receiving data from the Input Interface, processes these data with
the list of instructions of the program, and delivers the result to the Output
Interface. Input interfaces are represented by different type of sensors, while the
output interfaces are represented by actuators which can be motor starters, valves, etc [24].
2.2 Related Work
Combinatorial testing and combinatorial coverage is an active area of research. This section consists of a summary of the work done in these two sub-areas. In the first part of the section we present the work done in combinatorial testing, meanwhile the second part is focused on the combinatorial coverage aspect.
2.2.1 Combinatorial testing
For a given number of input values to be tested, pairwise testing tests all pairs of these input values. This is the most used technique for combinatorial testing. However, a different approach is presented in the studies [6,7], where some of the input values combinations are forbidden. The possible combinations are generated through an external tool called ASM Test Generation Tool (ATGT). This
approach evaluates the combinatorial testing as a logical problem and the tool is used to solve it. In these studies are also described different approaches that different tools follow to generate the covering arrays which are used afterwards to build the test suites. The following algorithms are used in these studies:
A. Algebraic when the generation of the Covering Array (CA) is based in
mathematical calculations. This approach leads to the generation of CAs with minimal size. However, there is not a mathematical solution to the problem of generating the CAs which is generally applicable. It depends on the scenario.
B. Greedy when the CAs are incrementally built using heuristic search. This
approach is known for its applicability and it sets an upper limit to the size of the generated CAs, which cannot be overpassed.
C. Meta-Heuristic when innovative techniques, including genetic-algorithms or
biotechnological techniques, are used in iterations to find the optimal solution. However, only few applications nowadays are suitable for this approach.
Most of the current tools used for the generation of the CAs contain only the algorithms to generate the CAs. However, there are other features, like the ability to specify constraints in the input state space, which can make these tools useful in practice. This is a feature that the NIST CCM tool, which is used for the measurements in this thesis, has. However, the test suites, whose combinatorial coverage is measured in this thesis, do not have constraints in the inputs.
In another study [8] the authors show a survey of more than 90 articles, describing the evolution of combinatorial testing in the last 20 years. “In software testing, there is no guideline that dictates the best course of testing, and there are no “best practices” that can always guarantee success” [8]. Combinatorial testing seems to be very useful, but its use exhibits the following identified risks [8]:
1. Combinatorial testing is often considered as a shortcut of software testing because it does not take into consideration all variable combinations in the testing process.
2. The variables and their values should be selected carefully and accurately because a bad selection could result in a lower capability of detecting possible faults.
3. The identification of all possible interactions between variables is very important, because combinatorial testing will not consider missing interactions in the testing process.
4. The combinatorial testing should be performed properly, otherwise there will be difficulties in the verification of the results. This is why it is important to fully understand the system under test and the weak and strong points of combinatorial testing for the specific system under test.
A comparison between combinatorial testing and random testing is done in another study [9], where the effectiveness in terms of fault detection is evaluated using the number of faults and the diversity of faults discovered. This is achieved by using these two testing techniques on the Siemens suite, which consists of seven software projects and each of them has also some faulty versions. A total of 100 t-way test sets are generated for each program for a given strength of t. A random test set is generated for each way test set. In this article is measured the effectiveness of t-way test suites and random test suites in terms of code coverage and fault detection. The results of this paper show that in most of the cases, combinatorial testing performed as good as random testing or even better. The differences between the results obtained with each of the two techniques are not significant. In another study [10] the authors describe how the abstraction of a model-based testing technique can be combined with the concrete input values of combinatorial testing in order to generate effective tests from the model. A tool is used to evaluate the results of this approach on different systems. The model used in the paper is the FSM model. The generation of the tests is done through the M[agi]C tool, designed to generate tests for Android and web-based applications. The results of the paper show that the post-optimization process helps to reduce significantly the number of tests, while it does not have the same effect in terms of effectiveness for the fault detection and coverage achieved, maintaining them at the same level as in the original test suite before the post-optimization.
Combinatorial Interaction Testing is introduced in [11] as a very useful technique in which the system under test contains a large amount of configurable variables and features, that can interact with each other. In order to improve fault detection, constraints should be applied on these interactions and a test priority order should
be taken into consideration. In order to increase the effectiveness of the tests it is important to specify the order of the test execution. Higher t-way interactions can detect many faults that lower t-way interactions could not detect, but lower t-way interactions, especially the pairwise interactions, have the advantage that can be tested in an acceptable amount of time. Therefore, although 5-way and 6-way interactions can improve fault detection compared to pairwise testing, it is believed that they are impractical for their high cost due to time consuming. The results of this paper “contradict” the last statement. The paper results can be summarized as follows [11]:
1. The combinatorial interaction testing for higher-strength interactions becomes practical in terms of time of execution due to the application of constraints. Although the constraints limit the possible number of tests, they help to reduce the time of combinatorial interaction testing for higher-strength interactions.
2. The classification of the variables in two categories, such as variables that can take single values and variables that can take multiple values, improves the efficiency for the prioritization of the tests and the combinatorial coverage.
3. Higher t-way combinatorial interaction testing detects more faults than lower t-way interactions. Therefore, test suites with higher t-way interactions are both practical and advantageous.
4. Lower way combinatorial interaction testing covers part of the higher t-way interactions tests, having also the same performance in terms of timing of fault detection. So the lower t-way combinatorial testing can be used to detect the first faults, since it is less time consuming than higher t-way combinatorial testing. The results of this study are promising for the research community, which believed that high strength combinatorial interaction testing is impractical due to its high costs, and also to testers which have to deal with large systems with large input state space. Real life testing scenarios have constraints and need prioritization of test cases. These scenarios are suitable for high-strength combinatorial interaction testing.
Another paper [12] describes an example of a higher-strength combinatorial testing technique beyond pairwise testing. This approach can be efficient for relatively
simple modules. For more complex systems in real world projects, the costs and benefits of this approach are still being investigated. The study results in this paper show that the rate of detection faults is significantly increased with the increase of the interaction strength.
In another study [17] combinatorial interaction testing is applied, using the coverage inheritance concept. This approach improves the effectiveness of combinatorial interaction test suites in higher-strength interactions. In this paper is proposed a new algorithm based in variables, which can be used to build test suites for combinatorial testing. The variable-based approaches are used to build the test suite incrementally. The construction of the test suite is started with the first t variables and then a new column is added to the test suite for each additional variable. This algorithm allows to add only one column at a time, meanwhile the algorithm proposed in this paper introduces the concept of the coverage inheritance and of a recursive routine which is used to preserve the coverage achieved while adding a new column to the test suite. The column that is added for a new variable should cover through the inheritance a well-known set of t-way interactions. Afterwards, for each interaction left uncovered, the column is adjusted recursively to cover the missing interactions, but also to preserve the achieved combinatorial coverage before the adjustment.
The coverage inheritance reduces the overhead to compute and store the list of the interactions that should be covered. This is a very desirable advantaged because the overhead increases exponentially as the list of interactions grow. It is useful also to determine the stopping point of the test suite construction process with greedy algorithm. The proposed algorithm supports also constraints in the test suite, e.g. the forbidden interactions, which cannot be present in the test suite. This algorithm is applied on a prototype tool followed by an evaluation of the performance.
In another study [26] is presented a survey of artificial life algorithms which can be integrated with combinatorial testing. These algorithms include: Genetic Algorithm, Particle Swarm Optimization, Ant Colony Algorithm and Bee Colony Optimization. In this paper is mentioned that the combinatorial testing can be considered as a black-box testing technique that focuses on reducing the number of tests and detecting faults. Usually the combinatorial testing is applied to generate
test suites from the input domain of the system under test, but in cases where the output domain is very much smaller than the input domain, then it is recommended to stress test the output domain.
In another study [27] are analyzed the possible behaviors that might occur in two different types of test suites due to the change of their configurations. Testing the whole configuration space of large systems can require thousands of years, making the testing infeasible. In order to avoid this, heuristic algorithms and combinatorial testing can be used to reduce the number of test suites by selecting samples of the configuration space. In the paper is analyzed an open source browser called MyIE. The results show that changing the configurations did not show significant differences in the effectiveness of test suite in terms of fault detection and code coverage. However, the changes affected the results in test level, where the differences are visible. Therefore the study shows that the granularity of the measures is a determinant factor. The results show also that the combination of specific options is important when changes are made in the configurations.
In another study [28], the Orthogonal Array Based Testing Strategy (OATS) is used as a method of combinatorial testing to generate test cases through a web application tool developed by the researchers of this paper called OATSGen. This method is used in generating test cases for the features of a mobile application. The OATS is based in the assumption that a combination that covers all possible 2-way interactions is more effective than a random combination. Therefore OATS is helpful on building minimal test suites that cover all 2-way interactions, where all combinations are uniformly distributed.
The results show that the test cases generated with the tool performed better in all metrics. This method can be used during different phases of the testing process such as Unit Testing, Integration Testing, Feature Testing, System Testing, etc. wherever there are combinations. The results show that this method is focused more in the quality rather than in the quantity of the test cases.
In another study [29] the authors present a model of combinatorial testing and the concept of Minimal Failure-Causing Schema (MFS) along with its properties and the method used to find it. The combinatorial testing model presented in the paper
is based on the MFS strategy. According to the MFS strategy, the combinatorial testing model should be built with well-defined testing requirements. MFS is triggered when a software failure occurs due to a fault in the variables. After the failure occurs, the MFS can be helpful in the identification of the variable-values that caused the failure and in the isolation of the root causes of the failure. A key aspect is to use combinatorial testing to identify MFS and to measure software quality based on the combinatorial coverage of the tests.
Results show that during the execution of the test suite two aspects are relevant: (1) defining the order of the test suite execution allows detecting faults in an early stage of the testing process. (2) specifying which data of the test execution are relevant and should be collected for failure analysis, regression testing and quality assessment.
In another study [30] is presented a feedback-driven adaptive model of combinatorial testing which is used to test behaviors of the system under test that are not included in the test execution phase. These behaviors are not tested due to some failures of the system under test that cause the masking effect. The approach presented in this paper is focused on the detection of masking effects and on applying solutions to this problem. The concept of the feedback-driven adaptive model consists in working in iterations. If at a specific iteration are detected masking effects, some heuristic algorithms can be applied to find and isolate their root causes and then, new covering arrays are generated to test in the next iteration the missing combinations due to the masking effect. This approach is tested in two popular large software systems with promising results.
In another study [31] a tool called ACTS, used for generation of tests through combinatorial testing, is tested in a case study. The goal of the study is to evaluate the application of combinatorial testing approach in terms of effectiveness in a real system. The first challenge is to determine the input state space, by specifying the variables of the system under test and the values that each variable can take. After this phase, it is proceeded with the generation of tests with the ACTS tool, which are also used to test the tool itself. The ACTS tool supports command line and also graphical user interface. It involves many test generation algorithms such as IPOG,
IPOG-D, IPOG-F, IPOG-F2 and Paintball. The tool is used to build tests for t-way interactions, for t not greater than 6.
The results of the study show that the effectiveness of tests generated with combinatorial testing approach is high. In addition, the results show also that the definition of the input state space of the system under test is of crucial relevance and requires significant efforts.
In another study [32] is presented a new approach to test concurrent programs, called t-way reachability testing. This approach is based in an existing method called reachability testing. However, while in the reachability testing method stress testing is performed for all possible sequences of a concurrent program, in the t-way reachability testing a subset of these sequences is selected to be tested. This subset of sequences is selected by using combinatorial testing. In this paper the t-way reachability testing is performed in some case studies. The goal is to evaluate its effectiveness.
The results of this paper show that the t-way reachability testing can help to significantly reduce the number of sequences to be tested while still preserving a high effectiveness of fault detection. In this paper, the t-way reachability testing is performed in programs which have less than 5 processes in parallel. As the number of processes grows, higher strength t-way reachability testing is needed.
In another study [33] combinatorial testing is applied in the Vienna Development Method (VDM). VDM consists in a group of modeling languages which support several types of system specifications. In order to apply combinatorial testing to VDM, the method is extended through the incorporation of some additional trace definitions. A tool called Overture is used to automate testing process by using VDM trace definitions. In the paper are also shown different algorithms that can be used to reduce the size of large set of tests generated with Overture tool.
In another study [36] are compared manual tests designed from experienced industrial engineers with 2-way combinatorial testing. The comparison is done in terms of fault detection effectiveness, code coverage and number of generated tests. The manual tests selected as object of analysis are designed by industrial
engineers at Bombardier Transportation Sweden AB. SEAFOX tool, which has implemented the IPOG algorithm, is used to perform 2-way combinatorial testing. The results show also that manual testing is more effective than 2-way combinatorial testing in terms of code coverage and mutation scores and more efficient in terms of number of tests.
In another study [37] combinatorial testing is introduced as a methodology that can help in detecting faults without stress testing the system under test. It is explained that even if the input state space of the system under test is large, only a few variables can be source of faults that can cause failures in the system. At the beginning, combinatorial testing consisted in pairwise testing through orthogonal arrays and later through covering arrays. Free tools support construction of tests for combinatorial testing with a high strength of t-way interactions. The NIST CCM tool used in this thesis is one of these tools. The combinatorial testing is used in a broad range of domains and situations such as in concurrent programs, security applications, web applications, analyzation of combinatorial coverage, detection of deadlocks in networks etc.
In another study [38] are presented two algorithms which are used to generate tests based on the concept of t-way combinatorial testing. Through the two algorithms presented in this paper, GA-N and IPO-N, is shown that is possible to cover all possible combinations of parameters, even for high strength of t, through a small number of tests. The first algorithm called GA-N, is classified as a greedy algorithm and follows the principle of generating the tests one by one. The concept of this algorithm is to firstly create a set with all possible valid combinations of values of t variables and then to start generating tests, one by one, to cover as many combinations as possible of the initial set. The second algorithm called IPO-N falls also into the category of greedy algorithms. The test generation through this algorithm is structured in parametric order. Firstly, tests are generated to cover all possible valid combinations of values for the first t variables. After full coverage is achieved for the first t variables, an additional parameter is added and tests are generated to cover all possible valid combinations of values for n+1 variables. The process is repeated until all variables are exhausted and all possible valid combinations are covered.
The results show that the number of generated tests is larger when using GA-N algorithm and it is also more time consuming. The differences become more evident when t=3. These results show that IPO-N is a more practical algorithm for t-way combinatorial testing for higher strengths of t. Therefore, the effectiveness of IPO-N algorithm, in terms of number of generated tests, is high, making this algorithm practical for t-way combinatorial testing [38].
In another study [39] is presented a survey of algorithms and tools that can be used to perform combinatorial testing. Around 75 algorithms and tools are identified from this research work and are classified in several categories, some of them consisting in type of techniques that are used to generate the covering arrays, generation strategy that each of the algorithms or tools use to build the tests, the possibility to test high strength combinatorial interactions, support for constraints in order to exclude invalid combinations, etc. In the paper is shown also the evolution of combinatorial testing tools and algorithms, in terms of quantity of tools and algorithms from 1991 until 2014.
In another paper [40] is performed a study on the impact that techniques which prioritize higher strength interactions have in fault detection improvement, in terms of detecting the faults at an earlier phase of the testing process. Detecting faults earlier in the testing process, gives the possibility to reduce the cost of repairing them. In this paper, 3-way interactions are prioritized over 2-way interactions and empirical evaluations are made on multiple versions of three open source software. For the evaluation are considered two types of weighting methods, code coverage and TSL based weighting method. In the first method, variables that cover large amounts of code are associated with high weights. The second method is used when code coverage is not available and consists in associating higher values to features that may cover more code. The results show that, when code coverage is available, in all versions of the three open source subjects, the prioritization of 3-way interactions is more effective than prioritization of 2-3-way interactions. For TSL based weighting method, the differences between 3-way and 2-way prioritization techniques are not so evident.
2.2.2 Combinatorial coverage
Combinatorial coverage [1] was introduced as a testing technique to assure the quality of the created test sets. Several studies show that software failures occur due to the interaction of a certain number of variables. Usually this number does not exceed six. Through covering arrays is possible to cover all possible combinations of t variables, where t does not exceed six. Most of the faults are detected in 4-way and higher strength interactions. However, in thousands of reports about fault detection, no faults are detected for interactions higher than six. Combinatorial coverage, as a testing technique that assures quality of the tests, has some advantages [1]:
1. It is independent from other techniques and can be integrated with them. 2. The scores of combinatorial coverage measure directly the portion of the input state space that is covered with the tests.
3. Combinatorial coverage measurements are based on the values of the input state space, thus this technique do not involve execution of the system under test as a requirement to perform these measurements.
Some researchers [2] have described different measures of combinatorial coverage, which can help in the quality evaluation of a test set. The first approach is called all-values or each-choice. In this testing strategy each value of a variable should be covered by the tests at least once. The second approach is called base-choice. In this approach each value should be covered at least once, while the other values in the specific test are constant. The third approach is called modified condition decision coverage. This strategy is used in safety critical software and consists in testing Boolean expressions through independent pairs of tests. The fourth approach is t+1-way coverage, which consists in extending a t-way test suite to t+1 by adding an additional variable to the test suite. This approach is effective when the number of values for each variable is small.
Another study [3] presents useful combinatorial coverage methods used for estimating the coverage and quality of a test set in terms of fault detection for t-way interactions. Fault coverage is a method that reveals how much effective is a test suite in detecting faults. This method gives the testers information if other tests
should be added to the test suite to cover other possible combinations of the input state space, which can be source of other potential faults, remained undetected from the existing tests. When source code is available another approach called branch coverage condition can be used to ensure that the test suite covers 100% of branch coverage. This method is useful when the cost of testing through covering arrays is high.
Another approach for naive combinatorial coverage, called controllable combinatorial coverage, is used [14] to support the grammar-based testing of software. In this case, the arguments are tested independently from each other, since they do not depend or interact with each other. So, instead of pairwise testing, a one way testing technique is used [14].
In another study [15] the combinatorial coverage is applied together with a new criterion to generate test sets. Instead of focusing on the interaction of different variables, in this case the focus is on the interaction of different scenarios. A novel technique is used to generate the tests, based on the concept of combinatorial coverage.
The technique proposed in this paper measures the quality of the tests based on the criterion of scenario-based coverage. This criterion consists in specifying how many concurrent scenarios of all possible t-way scenarios are covered from the generated test suite. By following the combinatorial testing principle, the generated test suite aims to achieve full combinatorial coverage with as minimum number of tests as possible. The scenarios are modeled through the Modal Sequence Diagrams (MSDs), which give the possibility to the testers to exclude forbidden scenarios interactions from the test design process and allow only real possible combinations of scenarios.
The sequence-based concept is used in [16] to reduce the number of test suites needed for testing and maintain the same effectiveness in terms of fault detection. This concept is based on a new criterion for combinatorial coverage. For a pair of events a and b, the order of occurrence for these events is taken into consideration to reduce the number of test suites. This approach is tested in three well-known applications Word, Paint and Spreadsheet. 2-way combinatorial testing is used in
all these cases with very good results in terms of fault detection rate (close to 100%).
The results show that 1-way method reduces at a high degree the test suite size (over 65%) with fault detection rates close to 100% in 2 applications and over 60% in the third. Meanwhile the 2-way combinatorial coverage methods achieve high rates of fault detection (almost 100% rates in all applications), while still reducing the size of the test suite significantly, but in a lower degree than the 1-way method. In another study [18] the combinatorial coverage concept is used to test mobile applications. The concept is used in order to check if all device characteristics can be covered by these tests. Some mobile applications behave as expected in some mobile devices or tablets, but encounter failures in some other devices. In order to avoid these situations, testing is needed in different mobile devices or tablets. These failures depend on the type of the devices, characteristics like RAM memory, device manufacturer, screen resolution or other characteristics. So in order to detect possible faults, devices with different characteristics should be tested. Higher is the number of devices under test, higher is the possibility of detecting more faults. However, higher number of devices increases also the cost of the testing process.
Results are compared with random testing and in most of the tests are more effective in terms of fault detection effectiveness. However, in this paper the results are based in experiments, so more detailed studies are needed to generalize these results.
In another study [34] are performed measurements for combinatorial coverage and Modified Condition/ Decision Coverage (MC/DC) coverage for random tests. The goal of the study is to evaluate the effectiveness of random testing in terms of combinatorial coverage and MC/DC coverage. Random testing is usually performed in large systems, where it is infeasible to generate covering arrays to cover all possible t-way combinations of the test parameters. The objects of the tests are 100 logical generated expressions. The combinatorial coverage is measured for t-way combinations, where t is from 2 to 6. The results show that the combinatorial coverage and MC/DC coverage grow rapidly as the number of
random tests increase. However, for more accurate results this approach should be tested in real life software.
In another study [35] are performed measurements for combinatorial coverage in Transport Layer Security (TLS) cipher suites, which are “a set of cryptographic algorithms to use for implementing security” [35], recommended from different subjects such as Mozilla, ENISA, BSI and NSA Suite B. The results show that none of the tests achieved full combinatorial coverage. This means that some combinations are missing from the designed tests. The CCM tool gives the possibility to generate these missing combinations to achieve the desired level of combinatorial coverage.
Chapter 3
Case Study Design
The case study consists in performing measurements on 33 manual tests, designed by experienced engineers, analyzing the collected results in terms of combinatorial coverage and investigating if the effectiveness of the tests can be improved by using combinatorial testing.
Each manual test consists is used as the input file on the NIST tool. After performing measurements for 2-way, 3-way, 4-way, 5-way and 6-way interactions, we collect the generated results and use them to generate the statistics. These statistics are displayed in box plots, bar plots and scatter plots, by using RStudio tool.
3.1 Problem Formulation
There is a need for understanding the quality of the tests manually created by test engineers. Test engineers perform testing needed for software assurance. It is important to understand the quality of these tests which are sometimes manually created by experienced engineers. These engineers can create these tests based on different test design techniques, intuition and previous experiences. This approach is clearly dependent on the skill of the engineers, and potentially it may leave a large proportion of the possible tests not created [3]. One consequence is that many test scenarios exercising the software under test can remain uncovered. We address this problem in this thesis by investigating the combinatorial coverage of manually created tests.
In this thesis we address two research questions to which we give answer through the results obtained from the performed measurements.
Research questions:
RQ1: What is the combinatorial coverage achieved by tests manually created by experienced engineers in industry?
RQ2: Can the effectiveness of manually created tests be improved in terms of combinatorial coverage using combinatorial testing?
3.2 Method
In this thesis we investigate the combinatorial coverage of manually created tests by engineers working in industry and the implications of using combinatorial testing in practice. The Combinatorial Coverage Measurement (CCM) NIST tool is used to measure the test coverage achieved. Measuring the input space coverage is helpful in understanding the state space coverage of manually created tests and what are the cases in which it may be possible to generate additional tests to increase the coverage of a test suite.
This thesis starts with the problem of measuring the combinatorial coverage of manually created tests and ends with performing an evaluation. We begin with the formulation of the research questions that are tackled in this thesis, based on an investigation of existing related scientific literature and software tools available. The research questions are answered by the following steps:
● Review the scientific literature for related work.
● Refine thesis research questions based on the previous step.
● Propose the case study design [4] and perform the measurements needed for data analysis.
● The results will be analyzed and discussed in terms of applicability: test efficiency and effectiveness.
3.2.1 Measuring Test Efficiency and Effectiveness
In software testing it is important to distinguish two aspects: test efficiency and test effectiveness. The testing process involves many activities which require efforts. These efforts have their associated costs which need to be taken into consideration during software development. Logically, a high number of tests requires more efforts and consequently influences the cost of testing. We assume that the test efficiency is higher when fewer efforts and consequently fewer tests are needed during the testing process. So, instead of using a certain number of tests to cover a certain number of goals, a fewer number of tests used to cover the same goals can improve the cost of testing. This way the cost is reduced and the test efficiency is increased. However, the number of tests depends also on the complexity of the software. Complex software requires a higher number of tests. So the test efficiency can be assumed to be closely related to the number of tests.
Test adequacy and effectiveness can be measured by using different coverage criteria. These criteria define what part of the software is covered from the designed tests. Test effectiveness is higher when the level of coverage is higher. We assume that the test effectiveness is related to coverage criteria. In this thesis the combinatorial coverage is used as a proxy for test effectiveness.
3.2.2 Manual Testing
When it comes to creating manual tests, researchers [5] have identified two ways of creating tests in practice: criteria-based test design and human-based test design. The criteria-based design consists in designing tests in order to satisfy some engineering requirements such as coverage criteria. On the other hand, the human-based test design is used for creating tests mostly human-based on the tester’s knowledge about the software under test and the specific domain the software is used.
In criteria-based test design [5], the tester has very good knowledge of how to perform software testing, programming and mathematics, since this approach can be very technical. This process requires the creation of abstract models and using them to design these tests.
In human-based test design, the tester knows more about the area in which the software will be used and how this software worked in the past. When these engineers create tests, they consider the possible future users of the software and are testing what is not expected to happen in an ideal situation (i.e., negative testing). In addition, they also consider boundary value analysis and invalid input values needed to test the software. Except of designing tests for the basic functionality of the software, these test engineers also try to test the software with some possible unusual actions.
In this thesis we will focus on manual tests created by engineers working in industry that have years of experience in both coverage-based and human (experience)-based test design.
3.2.2 NIST tool for Measuring Model Coverage
The tool used in this thesis to measure the combinatorial coverage of manual tests is called Combinatorial Coverage Measurement (CCM) tool and it is developed from National Institute Standards and Technology (NIST) researchers. This tool is the only available tool for measuring combinatorial coverage and generating the missing combinations to achieve full combinatorial coverage for t-way interactions, where t is equal or greater than 2 and equal or smaller than 6. In order to explain the concepts behind the tool and what kind of results will be obtained from it, let us consider the following example:
Fig.3.1 Example of a test array with four binary variables [13].
In Figure 3.1 we show an example of a test array with four binary variables. Each column represents the values that the respective variable has and each row represents a test set. If a 2-way combinatorial coverage of this test array has to be
measured, then all possible variable combinations of the test array should be considered. The variable combinations are ab, ac, ad, bc, bd and cd, so 6 combinations in total. Each of these variable combinations has 4 variable-value configurations (00, 01, 10, 11), so in total there are 6*4=24 variable-configurations. In the above example there are only 19 variable-variable-configurations. The five missing ones are ab=11, ac=11, ad=10, bc=01 and bc=10. So the total 2-way coverage for this array is 19/24=79%. For each of the 6 variable combinations is checked if all variable-value configurations (00, 01, 10, 11) are present and if not what is the level of the coverage [13]. In Figure 3.2 we show the results of this analysis.
Fig.3.2 The levels of coverage for all variable combinations based on an example [13].
In Figure 3.2 we show that a 2-way level of coverage of at least 50% (.50) is achieved for all variable combinations. 83% of combinations have a 2-way level of coverage of at least 75% and 33% of combinations are fully 2-way covered (100%) [19]. The CCM tool displays the above results in a graph format shown in Figure 3.3.
Fig. 3.3 The graph with the results of 2-way combinatorial coverage for a test array example [13].
On the vertical axis of the graph shown in Figure 3.3 we display the coverage values and on the horizontal axis we display the combination values. As can be seen from this graph, until the “Coverage” reaches level 0.5 on the vertical axis, the “Combinations” value on the horizontal axis is 1, which means that all combinations have a 50% level of coverage. This is represented with the vertical red line in the most right part of the graph. When the “Coverage” value is greater than 0.5, there is the horizontal red line which goes from value 1 to value 0.83 on the horizontal axis. This means that only 83% of the combinations have a coverage level greater than 50%. Then, the vertical red line in the middle is visible until the “Coverage” value is greater than 0.75. At this point, the horizontal red line goes from value 0.83 to value 0.33 on the horizontal axis. This means that only 33% of the combinations have a level of coverage greater than 75%. The left vertical line reaches “Coverage” value 1, which means that only 33% of the combinations are fully covered [13]. In this example each of the variables has the same number of values (0 or 1), but the tool measures the coverage also when variables can have different number of values as shown in Figure 3.4.
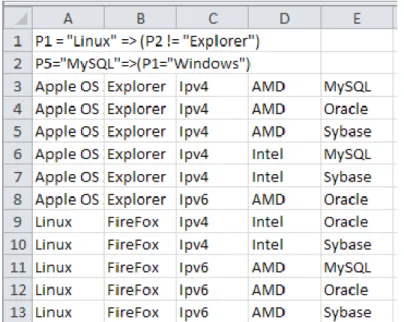
Fig.3.4 An example of an input file for the CCM tool [13].
Figure 3.4 shows an input file in .csv format, which is the required format of the tool for inputting a test file. The first two rows of the file are constraints, which the tool recognizes from its specific syntax. As can be seen, the tool supports constraints in order to exclude invalid combinations, although the data used for the measurements in this thesis do not have constraints and this feature of the tool is not used. The tool refers to the variables as parameters. Every column represents a Parameter for the tool and every row represents a Test [19].
Fig.3.5 Graphical representation of CCM tool developed by NIST [13].
As can be observed from Figure 3.5 in the tool there is the possibility to load an input file and the number of tests and the number of parameters in the top-left side of the Figure 3.5 is automatically updated according to the data of the input file. Then, the level of desired coverage is specified in the appropriate box and the checkbox “Gen missing combinations” is selected to generate the missing combinations to achieve the specified level of combinatorial coverage. Finally, the desired t-way interaction is selected and in the lower part of the Figure 3.5 are generated the results as in Figure 3.3. The results, as shown in the Appendix section are generated in “Results” tab of the CCM tool.
Chapter 4
Results and Analysis
In this chapter we present the results of the performed measurements and an analysis is performed based on these results. The goal of these results and analysis is to answer the two research questions of this thesis.
4.1 Results Q1: What is the combinatorial coverage
achieved by tests manually created by experienced
engineers in industry?
In this section we describe the results of the measurements, which give an answer to the first research question in section 3.1 Problem Formulation. The collected results are displayed in bar plots, scatter plots and box plots. The descriptive statistics (i.e. median, mean, minimum, maximum and standard deviation) for the combinatorial coverage of t-way interactions are displayed in Table 4.1:
Table 4.1: Descriptive statistics for combinatorial coverage of each t-way interaction
t-way Median Mean Min. Max. SD
2 0.833 0.7867 0.326 1 0.1684828
3 0.559 0.5705 0.095 1 0.2260735
4 0.3211 0.4027 0.027 1 0.2563868
5 0.187 0.2028 0.008 0.508 0.1351544
As can be noticed from the statistics showed in Table 4.1, almost all coverage scores decrease while the t-way interactions increase. So, on average, the coverage scores decrease from a combinatorial coverage of 78.6% in 2-way interactions to 57% in 3-way interactions, 40.2% in 4-way interactions, 20.2% in 5-way interactions and to a combinatorial coverage of 13% in 6-way interactions. Consequently, also the median and minimum coverage scores reflect this behavior. For the Median statistic the coverage scores decrease from 83.3% in 2-way interactions to 55.9% in 3-way interactions, 32.1% in 4-way interactions, 18.7% in 5-way interactions and to 10.8% in 6-way interactions. The Minimum coverage scores decrease from 32.6% achieved in 2-way interactions to 9.5% in 3-way interactions, 2.7% in 4-way interactions and only 0.8% achieved in 5-way interactions and 0.2% in 6-way interactions. The Maximum coverage scores decrease too as the t-way interactions increase, but this change is reflected starting from 5-way interactions. This happens, because in some of the manual tests, all possible 2-way, 3-way and 4-way interactions are covered with the existing tests, so the achieved combinatorial coverage is 100% for these interactions. The Maximum coverage scores for 5-way interactions is 50.8% and for 6-way interactions is 40.1%. The standard deviation values do not follow the rule of decreasing while the t-way interactions increase. It can be seen that the highest standard deviation occurs in 4-way interactions and the lowest occurs in 6-way interactions. This fact can be deduced also by considering the minimum, mean and maximum values. In the 4-way interactions, the differences between the mean value and the maximum or between the maximum and the minimum are the highest among all other t-way interactions. This means that in 4-way interactions there is the highest range of values distribution and consequently the deviation from the mean value is higher.
In Figure 4.1 is represented the combinatorial coverage for each t-way interactions in the form of a box plot.
Fig.4.1 Box plot which shows the combinatorial coverage for all t-way interactions.
The box plot in Figure 4.1 is the graphical representation of the descriptive statistics in Table 4.1. As can be seen, when the t-way interactions increase, the combinatorial coverage scores decrease. There are up to three outliers for each t-way interactions, which means that the number of values which exceed the normal data observations of the whole set of values is small. In Figure 4.2 are shown the number of tests and number of variables for each manual test.
Fig.4.2 Scatter plot of number of variables and number of manual tests for each test suite.
The scatter plot in Figure 4.2 represents the distribution of the number of manual tests and number of variables on each test suite. Each circle in the scatter plot