Influencers in Multiplayer Online Shooters
Evidence of Social Contagion in Playtime and Social Play
Alessandro Canossa Ubisoft Massive Entertainment
aleandait@gmail.com
Ahmad Azadvar Ubisoft Massive Entertainment
ahmad.azadvar@massive.se Casper Harteveld Northeastern University c.harteveld@northeastern.edu Anders Drachen University of York anders.drachen@york.ac.uk Sebastian Deterding University of York sebastian.deterding@york.ac.uk ABSTRACT
In a wide range of social networks, people’s behavior is in-fluenced by social contagion: we do what our network does. Networks often feature particularly influential individuals, commonly called “influencers’.’ Existing work suggests that in-game social networks in online games are similar to real-life social networks in many respects. However, we do not know whether there are in-game equivalents to influencers. We therefore applied standard social network features used to identify influencers to the online multiplayer shooter Tom Clancy’s The Division. Results show that network feature-defined influencers had indeed an outsized impact on play-time and social play of players joining their in-game network. CCS CONCEPTS
• Human-centered computing → Empirical studies in HCI; Empirical studies in collaborative and social com-puting;
KEYWORDS
social network analysis, influence, games-as-services, live games, online communities
ACM Reference Format:
Alessandro Canossa, Ahmad Azadvar, Casper Harteveld, Anders Drachen, and Sebastian Deterding. 2019. Influencers in Multiplayer Online Shooters: Evidence of Social Contagion in Playtime and Social Play. In CHI Conference on Human Factors in Computing Systems Proceedings (CHI 2019), May 4–9, 2019, Glasgow, Scotland
Permission to make digital or hard copies of all or part of this work for personal or classroom use is granted without fee provided that copies are not made or distributed for profit or commercial advantage and that copies bear this notice and the full citation on the first page. Copyrights for components of this work owned by others than the author(s) must be honored. Abstracting with credit is permitted. To copy otherwise, or republish, to post on servers or to redistribute to lists, requires prior specific permission and/or a fee. Request permissions from permissions@acm.org. CHI 2019, May 4–9, 2019, Glasgow, Scotland Uk
© 2019 Copyright held by the owner/author(s). Publication rights licensed to ACM.
ACM ISBN 978-1-4503-5970-2/19/05...$15.00 https://doi.org/10.1145/3290605.3300489
Uk.ACM, New York, NY, USA, 12 pages. https://doi.org/10.1145/ 3290605.3300489
1 INTRODUCTION
With the current paradigm shift of the game industry towards games as a service [9, 36, 61], player retention has become one of the most important design goals and metrics. Enter-tainment value is, in fact, measured in hours of playtime. To accommodate for these shifting values, commoditization strategies have begun revolving around subscription-based models, free to play games with premium content, free up-dates, premium DLC, and season passes. In an interview, Anne Blondel-Jouin, Vice President of Live Ops at Ubisoft, explained that: “...games as a service, or live games, refer to games that offer an evolving long-term, entertaining experience for our players. They often have a focus on online competitive multiplayer experiences such as Tom Clancy’s The Division but they can also include other types of game experiences like The Crew. ‘Live’ refers to all the activities and interactions created for the game community including pre- and post-launch as well as regular updates, new content, and events both in-game and out-of-game, etc. throughout the game’s lifespan”[63].
As shown by the longevity of games such as World of Warcraftor League of Legends, social connections foster pro-longed retention. One of the most important tools that the industry uses to investigate social connections, especially in social and online games, is Social Network Analysis (SNA). Increasingly, social network analysis methods are being used in games [e.g., 3, 19, 23, 42, 43]. Similar to the literature on online communities [34], it suggests that there are key mem-bers who contribute to keeping the community alive.
In this paper, we apply methods from SNA to the game Tom Clancy’s The Division(TCTD) to identify potential in-fluencers, here defined as players that engage with the mul-tiplayer component of the game in a way that makes them highly centralized (as defined by SNA measures). Subse-quently, we compare relevant features of influencers with two other populations, power users and random players, to investigate if there are other differences besides the way in
which the three populations utilize multiplayer components. To gauge whether playing with influencers has an impact, we investigate changes in playtime and time spent playing in groups for the social circles of the influencers, power users, and random players. This work contributes to understand-ing the social dynamics and providunderstand-ing evidence for social contagion in online social game networks and provides a deeper understanding of the role and impact that influencers in these networks may have.
This paper is organized as follows: We first ground and mo-tivate this work within the existing literature by discussing influence in social networks, what has been done with SNA in games, what is known about social contagion in this con-text, and what we generally know about influencers and how to identify them. Then, we describe how we conducted our study using a sample of PC players from TCTD and SNA. The paper ends by presenting and discussing the results.
2 BACKGROUND
In the following sections, we will describe the work that is done on SNA and social contagion in the context of games. Then, we will turn to what we know about influencers in general before we discuss what our research involves. Influence in Social Networks
Social Network Analysis (SNA) is a family of methods for formally describing and analyzing relations between people as graphs with nodes (people) and edges (relations), with broad applications in offline and online social networks [40]. A major topic of SNA research is social influence, as ex-pressed for instance in behavioral and social contagion the-ory [14, 38, 60]: behaviors (like physical activity or prosocial behavior) and their consequences (like obesity or happiness) cluster and spread within networks [e.g., 6, 14]. Method-ologically, social influence is often hard to disentangle from homophily, namely where similarity is the primary cause for connections [14, 39]. Still, there is now good evidence for con-tagion processes in social networks via social-psychological mechanisms such as modeling or norm-setting [16, 17]. Put differently: Not only do similar behaviors attract connections; being connected causes more similar behavior. As online so-cial networks have become major means of communication, social influence has become subject to intense interest in communication and marketing as well as computer science and human-computer interaction (HCI) communities, espe-cially computer-supported collaborative work and learning, Internet research, or informatics [15, 47, 52]. Practitioners have been chiefly concerned with finding ways to maximize the spread of desired information and behaviors through networks, and to reliably measure the impact of particular actions and actors [37].
Social Network Analysis in Games
The volume of work in SNA is substantial, and due to limi-tations of space we here focus on previous work in games, directly related to the current project. Previous research on social behavior in games suggests that social interaction influence the user experience and forms an important moti-vational driver for play [19, 62], giving the games industry a direct interest in social network analysis [2]. SNA has been employed as a method for investigating social interaction between players primarily since the introduction of social network games in the mid-late 2000s [30]. Social networks in games have been investigated using qualitative methods and ethnographic approaches [18], as well as using quan-titative SNA [25, 62]. The available SNA work is mainly focused on massively multiplayer online games (MMOGs), using in-game social features such as friend lists to construct networks. Ducheneaut et al. [19] and Shen [48] examined social interactions in these types of games. Surveys have also been used as a method for collecting information about the social connections of players, e.g. Shen and Chen [49]. Szell and Thurner [53], studied the structure of friend-, enemy-, and communication networks, noting that friend and en-emy networks were different topologically. Player-generated structures such as guilds have also been investigated, e.g. by Ducheneaut et al. [20] and Chen et al. [13] who used SNA metrics such as density and centrality to map and charac-terize the properties of player guilds in World of Warcraft. More limited attention is given to other game genres. One exception is Iosup et al. [24] that looked at social networks in DOTA 2 and StarCraft II, using match-making as the base-line for building edges between players. Rattinger et al. [44] used similar connections between players in Destiny to build networks. The authors noted that the most engaged players were characterized by having large social networks. Follow-ing up, Schiller et al. [46] analyzed a social matchmakFollow-ing service for Destiny players operating outside the game itself.
Summarizing, SNA as applied to games has been focused on the associations that form between players during and around the playing activity [19, 25, 44]. There is more limited work on social structures formed around games [46], not only for external services, but also distribution platforms such as Steam and Uplay. The work presented here forms a concrete extension of previous work applying SNA in games contexts, not only by integrating information about social connections from the Ubisoft distribution platform Uplay, but also in its continuation of the work by e.g. Rattinger et al. [44] on using SNA to identify players with specific properties across in-game behavior and network behavior. Social Contagion in Games
With respect to social contagion, there has been some evi-dence in online games, such as generosity (gifting in-game
money) [26, 65], purchasing of in-game goods [22], and cheing such as bot usage [64], includcheing initial exploratory at-tempts at identifying “spreaders” or influencers with an out-sized impact on cheating behavior [28]. However, research suggests that online in-game interaction network structures and dynamics are context-sensitive, meaning different kinds of interactions and relations (friending, trading, messaging, etc.) show different structures and dynamics [50]. Thus, the existence of social contagion for gift-giving does not immedi-ately generalize to e.g. team play, as different kinds of inter-actions have different strategic and other utilities and thus bring in different considerations and social-psychological mechanisms [50].
Influencers
There is no agreement on what is an influential person [45]. However, two types of influencers can be distinguished in previous work: (1) an individual who impacts the spread of information or behavior, people who influence people [58]; and (2) an individual who exhibits some combinations of desirable attributes such as trustworthiness and expertise or network attributes (connectivity or centrality) [27]. The first group of influencers are often referred to as opinion leaders [21], prestigious innovators [12], key-players [8] and spreaders [31]. The second group of influencers are often referred to as celebrities [51], evangelists [4] or experts [27]. Here we focus on measuring and quantifying the influence of an influencer of the first type, for two reasons. First, because they may touch a large scale of audience with a very small marketing cost [33, 35, 54]. Second, because their tendency to spread desirable behavior may be key to keep healthy communities alive for a longer time [12, 31].
Centrality measures have been proven to be relevant indi-cators in the analysis and comprehension of influencers in a social network [5, 32]. The most utilized measures of central-ity are: in- and out- degree, betweenness, eigenvector and closeness; they are all measures of an actor’s prominence in a network [57]. Valente et al. [55] investigated correlations between these most common measures of centrality. The re-searchers found that there are strong but varied correlations among the centrality measures presented here. The average of the correlations was 0.53 with a standard deviation of 0.14, indicating these measures are distinct, yet conceptually related. Since the centrality measures examined are not mu-tually excluding members but have slight different selection criteria, in order to identify the players with most influence we will utilize all the centrality measures and select only players that are ranked at the top for each measure. Research Question and Contribution
To summarize, there is good evidence for social contagion and the existence of influencers in social networks more
generally. Prior work in games has shown the existence of in-game social network structures similar to other domains. However, there is as of yet little data on social contagion or influencers in in-game social networks, which is the fo-cus of the present study. Specifically, the question remains whether influencers in online games have an outsized in-fluence not just in terms of the quantitative reach of their ego network, but also in terms of their qualitative impact on behavior. Since standard influencer definitions are based on social network features, reach-based claims are somewhat tautological: individuals with a large network by definition will touch a large network. Hence, instead of asking, “Do in-fluencers influence more people?”, we asked: “Do inin-fluencers influence people’s behavior more strongly?” Given the game industry’s interest in playtime as a major relevant design goal and prior work on influencers’ specific social behaviors, we focused on these two aspects to measure the influence that influencers may have on other players.
While operationalizing playtime is straightforward, social behaviors are less so. Because the clearest form of exhibiting social behaviors is playing together, we decided to opera-tionalize this aspect as social play, specifically the percentage to which one plays a multiplayer game collaboratively with others versus alone. Put as a research question: Do influencers in online games affect connected players’ playtime and social play more strongly than average?Given prior findings in the SNA literature, we hypothesized that:
(1) Social contagion effect: If a player joins the in-game network of an influencer, it will increase the player’s playtime (H1a) and social play (H1b).
(2) Impact of Influencers: If a player joins the in-game network of an influencer, it will increase the player’s playtime (H2a) and social play (H2b) more than joining the in-game network of another player.
The first hypotheses test if a social contagion effect occurs as a result of playing with an influencer; the second hypothe-ses seek to determine whether an influencer has more influ-ence than other socially active players or, in other words, to rule out that playtime and/or social play can explain for the effect on other players. By testing these hypotheses, we are making a twofold contribution to the literature: (1) We are es-tablishing whether basic tenets of social contagion in offline social networks transfer to online, in-game networks, ex-tending the evidence base from larger-sized, longer-lifetime guilds to short-term, small-sized pick-up groups. (2) We are deepening the general understanding of influencers in online social networks by establishing to what extent their influ-ence supersedes other network members not just in network reach, but also per-individual behavioral impact.
3 METHOD Material
To avoid potential confounds by homophily, we looked for in-stances where we could quasi-experimentally observe changes in player’s playtime and social behaviors before and after joining another player’s social network, and compare in-fluencers to the average player population. We found such an instance in the group mechanic of TCTD. TCTD is an online-only open world RPG shooter, set in a near future New York City in the aftermath of a smallpox pandemic. The player, an agent of Strategic Homeland Division, must help the group rebuild its operations in Manhattan, investigate the nature of the outbreak, and combat criminal activity in its wake. Released March 2016, TCTD accumulated more than 20 million players to date, becoming the fastest selling new Ubisoft IP of all times. As of April 2017 (time of initial data collection for this paper), there were more than 2 million active monthly players.
TCTD is structured with elements of role-playing games combined with collaborative Player versus Environment (PvE) and Player versus Player (PvP) online multiplayer ac-tivities. It is split in two zones: PvE, where players cannot kill each other (called “coop”), and PvP, where they can. We use the terms “competitive” and “cooperative” to indicate coop vs. PvP. It is possible to play and replay all the story missions and side missions with up to four real players in coop (PvE). Alternatively, it is possible to enter a PvP area called the Dark Zone and challenge other players. All activities, both in PvP and PvE, can be completed solo or in groups. Groups are composed of the group creator and up to three other players. Groups can be created through quickmatch with random players or with players already connected as friends to the profile through Xbox Live, PlayStation Network (PSN), or Uplay accounts. Players invite and accept friend invites by using Uplay IDs. Upon acceptance, players show up in each other’s menus as someone they can add to a group play session. Uplay is a multiplayer and communications service for PC, used exclusively by first-party Ubisoft games. Groups can be created or joined at safe houses and social hubs scat-tered around the game area or right before beginning an activity. A playtime segmentation report showed that active players are spending more than 35% of their time in groups, while players that quit the game spent less than 30% of their time in groups. Based on that and the existing literature, we hypothesized that social dynamics have an impact on player retention. SNA was adopted as the tool to identify and isolate influential players.
Dataset
We had access to data collected by both the Uplay platform and the TCTD game. To reduce the computational time for
this analysis, instead of working with the whole dataset from more than 14 million players (at the time of polling), we polled an initial random sample of 200,000 PC players from TCTD, and then included all other players that the initial sample interacted with in the game either by being invited or by inviting to a group. This led to a sample of 246,041 players. This will be referred to as the initial sample. This initial sample was polled on April 24th, 2017. We chose PC players only because our access to account data was limited to the Uplay service. Including PS4 and Xbox players would have required special permission from Sony and Microsoft. In addition, we made sure to include individuals that players in the original sample interacted with since we were inter-ested in exploring communities generated by group forming behavior and not including these last players would have imposed an incomplete network. The total population at the time of polling was 14,716,507 players. Therefore, the initial sample is 1.7 percent of the entire population at that time.
The dataset consists of two tables. The first table has the IDs of the group creators, the time of group creation, the IDs of players invited to each group and their status (friend on Uplay or quickmatched). The second table has, for every player (group creators and not), various statistics, such as their total and daily playtime, number of friends, etc. Identifying Influencers
We used conventional SNA techniques to identify influencers in our data set, a practice that has been done before in the con-text of both social networks at large [7, 31] and multiplayer games specifically [29]. Given that there is no agreement on which individual measure to utilize when identifying influencers, we used six different measures of centrality: closeness, betweenness, eigenvector, in-degree, out-degree and pagerank. All the sets of players identified by each cen-trality measure are intersected with each other to identify the players that are considered central for each of the six measures. In this work, we define influencers as players that satisfy all these six conditions.
We then plotted the resulting influencers onto a network graph where the nodes represent the players and the color of a node indicates the community (module) the node belongs to. The resulting supergraph is depicted in Figure 1. The size of the nodes is proportional to the importance of a player, hence influencers display a much bigger size than normal players. Details of our method are described below.
Identifying Most Central Influencers.We first computed cen-trality measures, which aim to quantify the “influence” of a particular node within a network. Our aim was to identify within each community which player may be influential. To accomplish this, we considered the following measures:
Figure 1: The 49 identified influencers mapped on the super-graph using conventional SNA techniques.
(1) Closeness centrality: how easily accessible a node is to all other players, represented as the length of the shortest path. The speed by which a player accesses all other players ranges between 0 and 1. We selected all nodes with values > 0, resulting in 182 players. (2) Betweenness centrality: it represents the number of
shortest paths to other players, or how likely a player is the most direct route between two other players. The range fell between 0 and 168. We selected all nodes with values > 0; resulting in 78 players.
(3) Eigenvector centrality: while degree centrality counts all connected nodes equally, eigenvector centrality treats connected nodes differently based on their “im-portance,” or how well a player is connected to others. The range is between 0 and 1. We selected all nodes with values > 0.05; resulting in 198 players.
(4) In-Degree (prestige): number of connections to a node from others. These are players invited most often to groups. Range is between 0 and 5 and we selected all nodes with values => 2, resulting in 371 players. (5) Out-Degree: number of connections from a node to
other nodes. These are group creators that frequently invite other players. Values range between 0 and 630 and we selected all nodes with values > 0, resulting in 165 players. In- and out-degree together tell us how many players a certain player can reach directly. (6) Pagerank: what fraction of players can be reached via
directed paths. It uses links as a measure of importance. Each node is assigned a score based on its number of incoming links (its “in-degree”). These links are also weighted depending on the relative score of its originating node. The result is that nodes with many incoming links are influential, and nodes to which they
are connected share some of that influence. The scores range between 0.000063 and 0.000059. We selected all nodes with values > 0.00006, resulting in 178 players. Choosing Influencers.The intersection between the 182 play-ers with highest closeness centrality, the 78 playplay-ers with the highest betweenness centrality, the 198 players with the highest eigenvector centrality, the 371 players with the high-est in-degree centrality, the 165 players with the highhigh-est out-degree centrality, and the 174 players with the highest pagerank score returned 49 players. These 49 players will be referred to as influencers from now on. It is important to note how intersecting across the six measures of centrality gives us a very conservative selection of players since in order to be considered influencers they must satisfy all six criteria. Furthermore, as Figure 1 shows, these 49 players map to a very large extent onto the sub-communities that form the heart of the network.
Sampling Comparison Players
After we identified the influential players, we sampled a group of comparison players to get a better understanding of who these influencers are. Because we hypothesized that playtime and/or social play alone cannot explain the effect on other players, for this comparison group we selected the most engaged players in the whole population—generally known as “power users.” It is important to note that power users is an already existing category of players; within Ubisoft they are known as “star players” [1]. Ubisoft routinely invites “power players” to special events and sees them as an important resource for community building. With this in mind, it is legitimate to wonder whether “power players” could count as another influencer type (the “celebrities, evangelists, or experts” mentioned earlier). There may be some overlap of these categories. However, as our data offers no good, easy indicator of popularity and status within the player community, we cannot test this assumption. In the context of TCTD, power users are defined as players with:
(1) At least 70 hours playtime. The whole player pop-ulation has an average playtime of 67 hours and 20 minutes.
(2) At least 10 friends on Uplay. On average players have 8.60 friends.
(3) Gearscore in the top 5%. Gearscore is an indicator for how well-equipped players are. Every weapon or piece of gear found after reaching level 30 (the level cap) has a Gearscore value. The higher an item’s Gearscore, the stronger the item is, making it a more valuable field asset. The overall Gear Score of players defines their progression after the “end-game” (i.e., completing all the story missions). We selected only the top 5 percent.
(4) At least played twice in groups in the week be-fore we polled the sample.We added this criterion to ensure that the power users made extensive use of the multiplayer functionalities of the game.
Applying these criteria to our initial sample led to 2,102 power users (less than 1% of the sample). It is interesting to compare infuencers to power users because we made no effort to remove influencers from the initial sample, yet no influencer was found amongst the power users. A third comparison was carried out with the total population.
Additionally, we intended to compare longitudinally the impact that influencers, powers users, and random players from the general population may have on others. For that purpose, we needed to extend our samples. First we selected all players that engaged with the 49 influencers (n = 16,742), all players that engaged with 49 power users randomly se-lected from the 2,102 initial power users sample (n = 1,346), and all players that engaged with 49 random players from the initial sample (n = 560). For the latter sampling, we excluded players with less than 1 week of total playtime and excluded all power and influential users.
Lastly, we examined if there was behavior transfer from influencers to the players they interacted with by running again the influencer identification method from the section “Identifying Influencers.” For this we needed to extend the three samples. We selected all players that interacted with the 49 influencers and that were still active a year later (n = 3,901) and added all players that interacted with them (n = 99,672); we also selected all players that interacted with the 49 power users and that were still active a year later (n = 390) and added all players that interacted with them (n = 8,725); and finally we selected all players that interacted with the 49 random players and that were still active a year later (n = 28) and added all players that interacted with them (n = 302). Constructs and Measures
As discussed before, to evaluate our hypotheses we focused on two constructs: playtime and social play. Playtime acts as a proxy for retention; social play will reveal a tendency to value the social dimension of play more, which, as we hypothesized based on the TCTD data and the existing literature, is a good indicator for how long a player will be engaged with a game— and is therefore another proxy measure of retention. Both constructs are measured as follows:
(1) Playtime (DV1). Average daily playtime calculated only for days of activity.
(2) Social Play (DV2). Ratio of solo and group play. Both measures were chosen in the context of TCTD. For ex-ample, we chose to use playtime and not days played because it fits better with the game’s monetization model: players need to play “enough” every day to see value in and buy
upgrades or subscriptions, and the longer they play in this active fashion, the more they pay over time. Days played would not offer this level of granular information.
4 RESULTS
Descriptive statistics
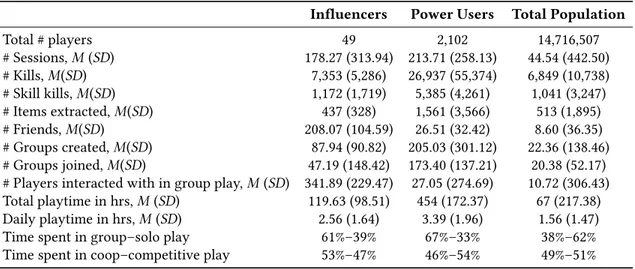
Table 1 shows an overview of the three groups: influencers, powers users, and the total population. The comparison is based on the lifetime of players. On average, it turns out that the powers users are indeed the powers users we would expect with more sessions played, more daily playtime, but especially far more playtime, kills, skill kills (i.e., killing ene-mies with particular abilities), and items extracted compared to the influencers and the total population. For example, power users (454 hrs) played almost four times more than the influencers (119 hrs) and seven times more than the general population (67 hrs). The influencers, on the other hand, have on average far more friends (208) compared to the power users (26.5) and general population (8.60), but especially in-teract with others (342) more in group play than power users (27) and the general population (11). Interestingly, both in-fluencers and power users spent about two-thirds of their time in group play, whereas this is the reverse for the general population. Another interesting observation is that for per-formative measures (e.g., kills, skill kills, and items extracted) the influencers perform similar to the general population.
As for group play, power users spent only marginally more time in group vs. solo play and competitive vs. cooperative play, but especially have created (205) and joined (173) many more groups compared to influencers and the average play-ers. However, these numbers are somewhat deceiving. When we consider their total playtime, it turns out that on average power users create 0.45 and join 0.38 groups per hour; the average player creates 0.38 and joins 0.30 groups per hour; and influencers create 0.74 and join 0.39 groups per hour. Therefore, it shows that power users are only marginally more engaged per hour than the average player and that influencers take far more initiative in creating groups.
In terms of group play, it is also interesting to consider with whom both influencers and powers have played with. On average, power users play with 27 other players in their lifetime. This is interesting because the number of players that power users interact with in groups (27) is very close to the number of friends (26.5), indicating that power users tend to play almost exclusively with their friends. At the same time, each influencer plays on average with 342 other players, a larger number compared to the already large num-ber of their friends (208), indicating that influencers play in groups with considerably more players than just their friends. Therefore, while power users spend on average about equal
Table 1: Comparison of the three populations: Influencers, power users, and total population. Influencers Power Users Total Population
Total # players 49 2,102 14,716,507 # Sessions, M (SD) 178.27 (313.94) 213.71 (258.13) 44.54 (442.50) # Kills, M(SD) 7,353 (5,286) 26,937 (55,374) 6,849 (10,738) # Skill kills, M(SD) 1,172 (1,719) 5,385 (4,261) 1,041 (3,247) # Items extracted, M(SD) 437 (328) 1,561 (3,566) 513 (1,895) # Friends, M(SD) 208.07 (104.59) 26.51 (32.42) 8.60 (36.35) # Groups created, M(SD) 87.94 (90.82) 205.03 (301.12) 22.36 (138.46) # Groups joined, M(SD) 47.19 (148.42) 173.40 (137.21) 20.38 (52.17) # Players interacted with in group play, M (SD) 341.89 (229.47) 27.05 (274.69) 10.72 (306.43) Total playtime in hrs, M (SD) 119.63 (98.51) 454 (172.37) 67 (217.38) Daily playtime in hrs, M (SD) 2.56 (1.64) 3.39 (1.96) 1.56 (1.47)
Time spent in group–solo play 61%–39% 67%–33% 38%–62%
Time spent in coop–competitive play 53%–47% 46%–54% 49%–51% amount of time in group play, they are more likely to play
with friends rather than strangers. Testing Hypotheses
To assess our hypotheses, we took the following three steps: (1) We isolated all players that played with influencers (16,742), the selected power users (1,346), and the se-lected random players (560) at least twice in the week before polling the data.
(2) We split data regarding their communities in two: data regarding play behavior corresponding to the two weeks before joining the community (operationalized as being added as friends on Uplay) and data regard-ing play behavior for the two weeks after joinregard-ing the community.
(3) We compared daily playtime and social play ratio two weeks before and two weeks after joining the com-munities of the influencers, power users, and random players, respectively.
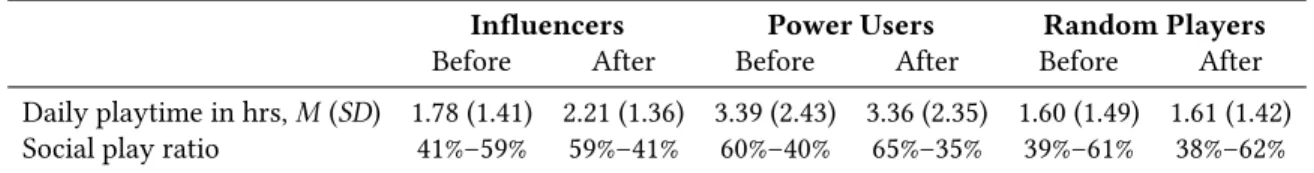
Results are shown in Table 2. There is a clear change and impact on the behavior of players that join the community of the influencers: the daily playtime increases considerably, from a number very close to the general population aver-age to a number very close to the influencers themselves; the amount of time spent in groups increases from the total population average to almost the same amount of the influ-encers. For playing with power users, in contrast, both the daily playtime and social play do not change drastically. The numbers are also similar to the powers users themselves, suggesting that not only do power users play together with their (limited) group of friends (see Table 1), they are likely
to play together with other power users. Engaging with ran-dom players does not change behavior and, as expected here, the statistics are similar compared to the total population.
Paired-samples t-tests were conducted to compare daily playtime (DV1) and social play (DV2) in two weeks before joining a community (condition1) and two weeks after (con-dition2). As for the playtime (DV1), there was a significant difference for the daily playtime of players interacting with influencers before (M = 1.78, SD= 1.41) and after (M = 2.21, SD= 1.36) they joined the influencers’ community; t(16,741) = 28.83, p = .001, r = .22. No significant effect on daily play-time was witnessed for players interacting with power users two weeks before (M = 3.39, SD = 2.43) and after (M = 3.36, SD= 2.35) joining their community; t(1345) =-0.26, p = .796, r= .007. For the random sample of players, there was also no significant effect on daily playtime, two weeks before (M = 1.6, SD = 1.49) and after (M = 1.61, SD = 1.42) joining their community; t(559) = 0.14, p = .885, r = .005. These results support hypotheses H1a and H2a: joining a group with an influencer did, in fact, increase the daily playtime of players (H1a), at least in the first two weeks after joining, while the same could not be stated of power users or a random sample of players during the same period (H2a).
As for social play, joining an influencers’s community significantly changed the ratio from two weeks before (M = 0.41, SD = 0.27) to after (M = 0.59, SD = 0.16); t(16,741) = 74.32, p= .001, r = .50. This ratio change was also significant for players joining a power user’s community compared to their situation two weeks before (M =0.6, SD = 0.23) and after (M = 0.65, SD = 0.27) joining them; t(1,345) = 4.79, p = .001, r = .13. For a random sample of players, two weeks before (M = 0.39, SD= 0.29) and after (M = 0.38, SD = 0.27) joining groups, it did not significantly change their social play ratio; t(560) = -0.54,
Table 2: Changes in the influencers’, power users’, and random players’ communities two weeks before and two weeks after engaging with influencers, power users, and random players.
Influencers Power Users Random Players
Before After Before After Before After
Daily playtime in hrs, M (SD) 1.78 (1.41) 2.21 (1.36) 3.39 (2.43) 3.36 (2.35) 1.60 (1.49) 1.61 (1.42) Social play ratio 41%–59% 59%–41% 60%–40% 65%–35% 39%–61% 38%–62% p= .588, r = .002. These results support hypotheses H1b and
H2b: the ratio of playing in groups significantly increased for players joining an influencer’s community (H1b), at least in the first two weeks after joining. While a significant increase in group play happens with joining power users as well, their impact is less. The effect size for influencers is large (.50) resulting in an average increase on of 18% in group play, whereas the effect size for power users is small (.13) resulting in an average increase of only 5% of group play (H2b). Retention and Influencer Conversion
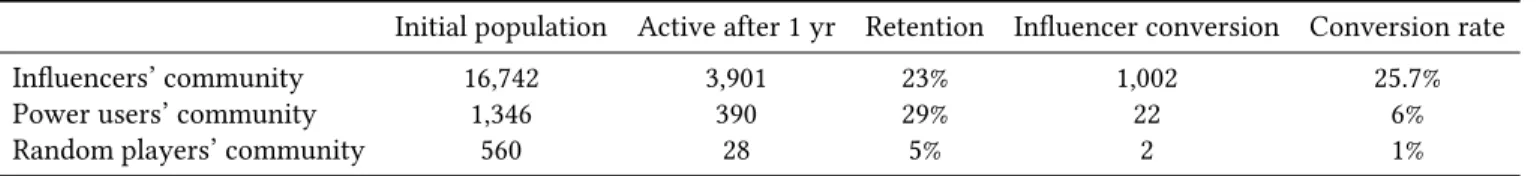
For testing our hypotheses, we limited our observations to two weeks before and after. A question remains what kind of influence influencers may have on other players beyond this period. For this analysis, we first considered if players are still actively playing TCTD. In our previous analyses we used playtime and social play as measures because these can indirectly tell us something about retention: more engaged players and players engaged in the multiplayer aspects of a game tend to stick around longer. To calculate retention here, we looked at which of the players who joined the communi-ties of the influencers, power users, and random players were still active after one year. Table 3 shows the retention results. After 1 year, 23% of the influencers’ community is still active, whereas this is 29% of the power users’ community and only 5% of the random players’ community.
The second consideration is more ambitious. We consid-ered which of the players from these communities may have become an influencer themselves. As we have demonstrated, influencers have an impact on other players and so if these players are converted into influencers they, on their turn, can influence others—and thereby keep the community alive, even if certain influencers decide to leave the game. For this analysis, we first applied the same method for identifying the original 49 influencers except a year later (see Methods section). Then, we considered which of the newly identified influencers mapped onto the players from the initial popula-tion that the original influencers, power users, and random players engaged with.
Table 3 shows the conversion results, which are remark-able. From the community of the random players only 2 players were identified as an influencer a year later, which
is a conversion rate of 1% based on the still active players in that community. The influence of power users is greater: from their community 22 players are identified as an influ-encer resulting in a rate of 6%. However, from the community of influencers we identified a staggering number of 1,002 influencers, which corresponds to a rate of 26%.
5 DISCUSSION
Using conventional Social Network Analysis (SNA) tech-niques we identified key members that are very engaged with the game Tom Clancy’s The Division (TCTD) but also with other players. The question that we investigated is whether these so-called influencers really influence other player’s behavior, as measured in their playtime (H1a) and social play (H1b), and if they do this more than other play-ers (H2a and H2b). Our results provide supporting evidence that influencers do indeed impact other players and more so than others. We discuss here our findings on social conta-gion, retention, and player differences before explaining the limitations and implications of this study.
Influencers are Socially Contagious
Our results highlight that the identified influencers seem to have a very tangible impact on the people they play with: these other players begin playing longer and spend more time in groups. We observed a significant increase with a small to medium effect size (r = .22) on playtime (H1a) and a large effect size (r = .50) on social play (H1b). Compared to interacting with an influencer two weeks before, players’ daily playtime increased on average with 24% and their social play ratio completely reversed in favor of being more social (from 41%–59% to 59%–41%) two weeks after (Table 2). We contrasted the impact of influencers with those of power users and average users and found that interacting with these users does not yield any significant differences in playtime (H2a) and only a significant but with a smaller effect size (r = .13) on social play (H2b) for power users. Therefore, a strong social contagion effect is unique to the influencers.
Homophily is always a possible confound in social conta-gion work [14]. For this reason, we ran a quasi-experimental analysis comparing playtime and social play ratio pre/post joining the team of an influencer vs. power player vs. normal
Table 3: Players interacting with influencers, power users, and random players that continue to be active and have become influencers themselves after 1 year. Note: conversion rate is based on active population after 1 year.
Initial population Active after 1 yr Retention Influencer conversion Conversion rate
Influencers’ community 16,742 3,901 23% 1,002 25.7%
Power users’ community 1,346 390 29% 22 6%
Random players’ community 560 28 5% 2 1%
player (Table 2). Homophily (i.e., influencers attract already-social and already-active players) would predict higher over-all playtime and social play ratio among influencer team members, but not the significant changes that we observed. This makes us confident in claiming causality that influencers are socially contagious.
Influencers are Important for Retention
Retention is a key measure for success in the game industry. Our results suggest that not only are influencers socially contagious, they are also important for retention. We mea-sured if players continue to be active players one year after interacting with influencers, power users, and random play-ers (Table 3) and found that playplay-ers who interacted with influencers (23%) and power users (29%) are more likely to be active compared to a random player (5%). While the reten-tion is higher for power users, it should be kept in mind that influencers are able to retain ten times the number of players and that power users tend to engage only with similar users, so their influence is more of a reinforcing feedback loop than having an impact on the community at large.
What is most striking, however, is that players who have interacted with influencers may become influencers them-selves after a year (26% chance). Such influence is not as noticeable with power users (6%) or random players (1%). This data suggests that the social contagion effect of influ-encers may go as far as converting a significant portion of the players they interact with into influencers. Because we did not (quasi-)experimentally test this, or observed whether these new influencers exhibit the same kind of impact, we cannot claim causality here neither can we fully illustrate what impact this has on the community. However, these results provide further evidence of the important role that influencers play in online game communities, especially with the issue of retention in mind. In fact, as the sustained life-time of a game depends in large measure on a healthy, lively community of players engaged with the multiplayer aspects of the game, these players seem to form the invisible social backbone of a game community.
Influencers are Different Players
Our results show that influencers are different from other players (Table 1). Influencers create groups much more than
the average player. They play many more sessions (34 times more), have many more friends (21 times more), and spent relatively more time in group (23% more) and coop play (4% more) than the average player. More importantly, they seem to be the ones who initiate group play and invite others to join (4 times more). Power users, on the other hand, spent many more hours playing (4 times more), but while they engage considerably in group activities, even at a similar ratio as the influencers, they tend to start groups relatively less and seem to play mostly with their much more limited number of friends (8 times less) who are likely to be power users too and less so with strangers.
Important to observe as well is that the selected power users are indeed power users: compared to the average player, they have far more kills (4 times more), skill kills (5 times more), and items extracted (3 times more), and play more competitively (3%). Interestingly, the statistics for influencers on these performative metrics are with the exception of com-petitive play (7% less than power users) fairly similar to the average player. Therefore, what defines influencers in con-trast to power users is that they have a wide-reaching and solid network of friends and an active engagement with the multiplayer aspects of a game rather than an elite perfor-mance in the game. Influencers are the social butterflies.
Although these metrics highlight the differences between influencers vs. power users vs. average players, it is impor-tant to note that these metrics are not sufficient to identify influencers. When applying one or a combination of metrics, it was impossible to achieve the same result. Therefore, SNA seems to be required to identify influencers. The approach we have taken here is to define influencers on the basis of combining six centrality measures and then inspecting the results visually for verification (see “Identifying Most Central Influencers”). Future research is needed to further refine this approach and examine how it generalizes to other contexts.
Furthermore, neither the SNA or the metrics tell us really who these influencers are and how it is possible that they can convert others into influencers. Because explanations such as that influencers are inherently social, a suggestion sup-ported by evidence that there are similarities between virtual and real world personalities and behavior [10, 11, 56, 67], or are a different type of player, more into social play [41, 66,
e.g.,], cannot fully explain the results we observe here. It may be that those converted are socially inclined people and that interacting with another socially inclined person but already socially active player (i.e., an influencer) activates how they can and want to play. Regardless, our quantitative, hypothesis-testing approach is inherently limited in gener-ating detailed explanatory portraits of players and the dy-namics we observed. Future qualitative and mixed-methods work, where influencers and the players they interact with are interviewed or closely followed over a period of time, can provide further evidence on understanding who these play-ers are and why they have such influence on othplay-ers beyond being socially active as described with the metrics here. Limitations and Generalization
Our presented work has several limitations. First, the work focused on a single game. Although there are differences between TCTD and other online games, the type of game, its mechanics, and especially group play management is sim-ilar to other online multiplayer games. The most important difference in terms of group play compared to other online games is that it is limited to up to four players at a time, meaning that player ties may be closer than in other games and that there are more loosely connected communities than in other games. More importantly, influencers who initiate group play may be more influential as they are the ones who make connections across the network, whereas in games where guilds and factions play a role there are other (social and cultural) mechanisms of how players join groups.
Second, we sampled only one degree of ties after the ini-tial sample of 200,000 PC players (1.7% of the population) by including all the players the initial polled sample interacted with. This was a necessary step because we aimed to inves-tigate their social networks based on who they play with. However, there is a question how representative the sample is in terms of the whole population. Depending on the study design and situation, different techniques for sample size estimation exists. Assuming normally distributed variables in the population, Z-scores can be used to define the confi-dence interval and sample size. In the current case, with a 1% margin of error and a 99% confidence level (Z score = 2.576), the required sample size for the whole population would be about 9,600 players using random sampling. The sample used here is roughly 20 times larger. Nevertheless, aside from replicating the work in other game contexts, future work could operate with the entire network and/or samples that have up to three degrees of ties similar to what others have done while utilizing SNA on game communities [43, 44].
Third, while we made deliberate decisions—based on liter-ature, closely examining our data, and definitions used by Ubisoft—on how to identify influencers, define power users,
and examine the impact of social contagion choosing a dif-ferent set of criteria may have led to difdif-ferent results. As future work will consider this phenomenon more closely, more robust standards and definitions will be established and the results presented here can be (dis)affirmed.
Fourth, in order to rule out the possibility that a particular metric can explain for the impact we observed, it would be necessary to perform a propensity sample where we compare the influencers to a sample with similar characteristics. Implications
The current work has important implications for HCI re-searchers and industry. For HCI rere-searchers, we have es-tablished here how social contagion or influence occurs in online, in-game networks, specifically in the context of short-term, small-sized pick-up groups. While we need to be cog-nizant of this particular context, this work advances the field at large. Where previous SNA work on influencers in games and social media focused on network features only [e.g., 59], our work highlights how influencers act differently from others and the extent of their impact on others and the com-munity over time. Additionally, as it remains an ongoing discussion on how to identify influencers in social networks using SNA metrics [45], our work suggests a combination is necessary and that measures of activity and popularity are not good metrics. This latter is relevant for the commu-nity management for every game or social media, which generally tend to be most interested in active users, as well “celebrities, evangelists, or experts” such as power users. Our data suggests that for TCTD at least, the “most central” users may be the most important for engaging, and retaining other users. Therefore, community managers should tap into SNA to identify such influential users, then leverage them for feedback or to reach a large part of the community. 6 CONCLUSION
In this paper, we studied if influencers in online games affect connected players’ playtime and social play more strongly than average. We studied this in the context of Tom Clancy’s The Division, a popular multiplayer online shooter. Our find-ings show that influencers do indeed impact other players and more so than power users or the average player, thus providing evidence for a social contagion effect and the im-portant role influencers have in these online social networks. ACKNOWLEDGMENTS
This research received support from Ubisoft, the Games Lab, and the Live Ops team at Massive Entertainment. Part of this work was conducted in the Digital Creativity Labs, jointly funded by EPSRC/AHRC/ InnovateUK under grant no EP/M023265/1.
REFERENCES
[1] [n. d.]. Star Player Official Page. https://www.ubisoft.com/en-gb/ community/star-players
[2] Adam Alsén, Julian Runge, Anders Drachen, and Daniel Klapper. 2016. Play With Me? Understanding and Measuring the Social Aspect of Casual Gaming. In Proc. AIIDE Player Analytics Workshop. 115–121. [3] Chee Siang Ang and Panayiotis Zaphiris. 2010. Social roles of players in
MMORPG guilds: A social network analytic perspective. Inf. Commun. Soc.13, 4 (2010), 592–614.
[4] C Bigonha, M M Moro, T N Cardoso, V A Almeida, and M A Goncalves. 2010. Detecting evangelists and detractors on Twitter. In Proceedings of the 18th Brazilian Symposium on Multimedia and the Web. 107–114. [5] Phillip Bonacich. 1987. Power and centrality: A family of measures.
Amer. J. Sociology92, 5 (1987), 1170–1182.
[6] Robert M Bond, Christopher J Fariss, Jason J Jones, Adam DI Kramer, Cameron Marlow, Jaime E Settle, and James H Fowler. 2012. A 61-million-person experiment in social influence and political mobiliza-tion. Nature 489, 7415 (2012), 295.
[7] Norman Booth and Julie Ann Matic. 2011. Mapping and leveraging influencers in social media to shape corporate brand perceptions. Cor-porate Communications: An International Journal16, 3 (2011), 184–191. [8] Stephen P Borgatti, Kathleen M Carley, and David Krackhardt. 2006.
On the robustness of centrality measures under conditions of imperfect data. Social networks 28, 2 (2006), 124–136.
[9] Mark Bozon. 2009. DICE 2009: Gabe Newell Keynote Tran-script. http://www.ign.com/articles/2009/02/19/dice-2009-gabe-newell-keynote-transcript
[10] Alessandro Canossa, Jeremy B Badler, Magy Seif El-Nasr, Stefanie Tignor, and Randy C Colvin. 2015. In Your Face (t) Impact of Personality and Context on Gameplay Behavior. In Foundations of Digital Games. [11] Alessandro Canossa, Josep B Martinez, and Julian Togelius. 2013. Give
me a reason to dig Minecraft and psychology of motivation. Conference on Computational Intelligence and Games2013 (2013), 1–8.
[12] Meeyoung Cha, Hamed Haddadi, Fabricio Benevenuto, P Krishna Gum-madi, et al. 2010. Measuring user influence in twitter: The million follower fallacy. In Fourth International AAAI Conference on Weblogs and Social Media. AAAI Press, 10–17.
[13] Chien-Hsun Chen, Chuen-Tsai Sun, and Jilung Hsieh. 2008. Player Guild Dynamics and Evolution in Massively Multiplayer Online Games. CyberPsychology & Behavior11, 3 (2008), 293–301. https://doi.org/10. 1089/cpb.2007.0066
[14] Nicholas A Christakis and James H Fowler. 2013. Social contagion theory: examining dynamic social networks and human behavior. Sta-tistics in medicine32, 4 (2013), 556–577.
[15] Carlos D. Correa and Kwan-Liu Ma. 2011. Visualizing Social Networks. In Social Network Data Analytics, Charu C. Aggarwal (Ed.). Springer US, 307–326. https://doi.org/10.1007/978-1-4419-8462-3_11 [16] Tegan Cruwys, Kirsten E Bevelander, and Roel CJ Hermans. 2015.
Social modeling of eating: A review of when and why social influence affects food intake and choice. Appetite 86 (2015), 3–18.
[17] Clayton A Davis, Julia R Heiman, and Filippo Menczer. 2015. A role for network science in social norms intervention. Procedia Computer Science51 (2015), 2217–2226.
[18] Nicolas Ducheneaut and Robert J. Moore. 2004. The Social Side of Gam-ing: A Study of Interaction Patterns in a Massively Multiplayer Online Game. In Proc. of the 2004 ACM Conference on Computer Supported Coop-erative Work. ACM, 360–369. https://doi.org/10.1145/1031607.1031667 [19] Nicolas Ducheneaut, Nicholas Yee, Eric Nickell, and Robert J. Moore. 2006. Alone Together? Exploring the Social Dynamics of Massively Multiplayer Online Games. In Proc. of the SIGCHI Conference on Human Factors in Computing Systems. ACM, 407–416. https://doi.org/10.1145/
1124772.1124834
[20] Nicolas Ducheneaut, Nicholas Yee, Eric Nickell, and Robert J. Moore. 2007. The Life and Death of Online Gaming Communities: A Look at Guilds in World of Warcraft. In Proc. of the SIGCHI Conference on Human Factors in Computing Systems (CHI ’07). ACM, 839–848. https://doi.org/10.1145/1240624.1240750
[21] Daniel Gayo-Avello. 2013. Nepotistic relationships in twitter and their impact on rank prestige algorithms. Information Processing & Management49, 6 (2013), 1250–1280.
[22] Ruibin Geng, Xi Chen, Bin Zhang, Shun Cai, and Cheng Zhang. 2015. Social Contagion and Diffusion: Modeling the Direct and Indirect Peer Influences on Repeat-Purchase in Online Freemium Games. In PACIS. 224.
[23] Shu-Hsun Ho and Chiung-Hui Huang. 2009. Exploring success factors of video game communities in hierarchical linear modeling: The per-spectives of members and leaders. Comput. Human Behav. 25, 3 (2009), 761–769.
[24] Alexandru Iosup, Ruud van de Bovenkamp, Siqi Shen, Adele L. Jia, and Fernando Kuipers. 2014. Analyzing Implicit Social Networks in Multiplayer Online Games. IEEE Internet Computing 18, 3 (2014), 36–44. https://doi.org/10.1109/MIC.2014.19
[25] Adele Lu Jia, Siqi Shen, Ruud Van De Bovenkamp, Alexandru Iosup, Fernando Kuipers, and Dick H. J. Epema. 2015. Socializing by Gaming: Revealing Social Relationships in Multiplayer Online Games. ACM Transactions on Knowledge Discovery from Data10, 2 (2015), 11:1–11:29. https://doi.org/10.1145/2736698
[26] Ah Reum Kang, Hana Kim, Jiyoung Woo, Juyong Park, and Huy Kang Kim. 2014. Altruism in games: Helping others help themselves. In Network and Systems Support for Games (NetGames), 2014 13th Annual Workshop on. IEEE, 1–6.
[27] Edward Keller and Jonathan Berry. 2003. The influentials: One American in ten tells the other nine how to vote, where to eat, and what to buy. Simon and Schuster.
[28] Youngjoon Ki, Jiyoung Woo, and Huy Kang Kim. 2014. Identifying spreaders of malicious behaviors in online games. In Proceedings of the 23rd International Conference on World Wide Web. ACM, 315–316. [29] Erica Suyeon Kim and Steve Sangki Han. 2009. An analytical way
to find influencers on social networks and validate their effects in disseminating social games. In Social Network Analysis and Mining, 2009. International Conference on Advances in. IEEE, 41–46.
[30] B. Kirman, S. Lawson, and C. Linehan. 2009. Gaming On and Off the Social Graph: The Social Structure of Facebook Games. In 2009 International Conference on Computational Science and Engineering, Vol. 4. 627–632. https://doi.org/10.1109/CSE.2009.266
[31] Christine Kiss and Martin Bichler. 2008. Identification of influencers: Measuring influence in customer networks. Decision Support Systems 46, 1 (2008), 233–253.
[32] D Knoke and RS Burt. 1983. Applied network analysis. Applied Network Analysis, Newbury Park, CA: Sage(1983).
[33] Robert V Kozinets, Kristine de Valck, Andrea C Wojnicki, and Sarah J.S Wilner. 2010. Networked Narratives: Understanding Word-of-Mouth Marketing in Online Communities. Journal of Marketing 74, 2 (2010), 71–89. https://doi.org/10.1509/jmkg.74.2.71
[34] Robert E Kraut, Paul Resnick, Sara Kiesler, Moira Burke, Yan Chen, Niki Kittur, Joseph Konstan, Yuqing Ren, and John Riedl. 2012. Building Successful Online Communities: Evidence-Based Social Design. MIT Press.
[35] Andrea Landherr, Bettina Friedl, and Julia Heidemann. 2010. A critical review of centrality measures in social networks. Business & Informa-tion Systems Engineering2, 6 (2010), 371–385.
[36] Rick Lane. 2012. To Protect or Serve? http://www.ign.com/articles/ 2012/03/02/to-protect-or-serve
[37] Cheng-Te Li, Shou-De Lin, and Man-Kwan Shan. 2012. Influence propagation and maximization for heterogeneous social networks. In Proceedings of the 21st International Conference on World Wide Web. ACM, 559–560.
[38] David A Locher. 2002. Collective behavior. Prentice Hall Upper Saddle River, NJ.
[39] Miller McPherson, Lynn Smith-Lovin, and James M Cook. 2001. Birds of a feather: Homophily in social networks. Annual review of sociology 27, 1 (2001), 415–444.
[40] Wouter de Nooy. 2009. Social Network Analysis. In Historical Devel-opments and Theoretical Approaches in Sociology (Volume I), Charles Crothers (Ed.). Eolss Publishers, Oxford, UK, 377–401.
[41] Rita Orji, Regan L Mandryk, Julita Vassileva, and Kathrin M Gerling. 2013. Tailoring persuasive health games to gamer type. In Proc. of the SIGCHI Conference on Human Factors in Computing Systems. ACM, 2467–2476.
[42] Hyunsoo Park and Kyung-Joong Kim. 2014. Social Network Analysis of High-Level Players in Multiplayer Online Battle Arena Game. In Social Informatics (LNCS). Springer, Cham, 223–226.
[43] Johanna Pirker, André Rattinger, Anders Drachen, and Rafet Sifa. 2018. Analyzing player networks in Destiny. Entertainment Computing 25 (2018), 71–83.
[44] A. Rattinger, G. Wallner, A. Drachen, J. Pirker, and R. Sifa. 2016. In-tegrating and Inspecting Combined Behavioral Profiling and Social Network Models in Destiny. In Entertainment Computing. Springer, 77–89.
[45] Fabián Riquelme and Pablo González-Cantergiani. 2016. Measuring user influence on Twitter: A survey. Information Processing & Manage-ment52, 5 (2016), 949–975.
[46] M. H. Schiller, G. Wallner, C. Schinnerl, A. Monte Calvo, J. Pirker, R. Sifa, and A. Drachen. 2018. Inside the Group: Investigating Social Structures in Player Groups and Their Influence on Activity. IEEE Transactions on Games(2018). https://doi.org/0.1109/TG.2018.2858024 [47] John Scott. 2012. Social network analysis. SAGE. https://doi.org/10.
1177/0038038588022001007
[48] Cuihua Shen. 2014. Network patterns and social architecture in Massively Multiplayer Online Games: Mapping the social world of EverQuest II. New Media & Society 16, 4 (2014), 672–691. https: //doi.org/10.1177/1461444813489507
[49] Cuihua Shen and Wenhong Chen. 2015. Gamers’ confidants: Massively Multiplayer Online Game participation and core networks in China. Social Networks40, Supplement C (2015), 207–214. https://doi.org/10. 1016/j.socnet.2014.11.001
[50] Seokshin Son, Ah Reum Kang, Hyun-chul Kim, Taekyoung Kwon, Juyong Park, and Huy Kang Kim. 2012. Analysis of context dependence in social interaction networks of a massively multiplayer online role-playing game. PloS one 7, 4 (2012), e33918.
[51] MS Srinivasan, Srinath Srinivasa, and Sunil Thulasidasan. 2013. Explor-ing celebrity dynamics on Twitter. In Proc. of the 5th IBM Collaborative
Academia Research Exchange Workshop. ACM, 13.
[52] Jaideep Srivastava. 2008. Data mining for social network analysis. In IEEE International Conference on Intelligence and Security Informatics. IEEE. https://doi.org/10.1109/ISI.2008.4565015
[53] Michael Szell and Stefan Thurner. 2010. Measuring social dynamics in a massive multiplayer online game. Social Networks 32, 4 (2010), 313–329. https://doi.org/10.1016/j.socnet.2010.06.001
[54] Thomas W Valente. 1996. Network models of the diffusion of innova-tions. Computational & Mathematical Organization Theory 2, 2 (1996), 163–164.
[55] Thomas W Valente, Kathryn Coronges, Cynthia Lakon, and Elizabeth Costenbader. 2008. How correlated are network centrality measures? Connections (Toronto, Ont.)28, 1 (2008), 16.
[56] Giel Van Lankveld, Sonny Schreurs, Pieter Spronck, and Jaap Van Den Herik. 2010. Extraversion in games. In International Conference on Computers and Games. Springer, 263–275.
[57] Stanley Wasserman and Katherine Faust. 1994. Social network analysis: Methods and applications. Vol. 8. Cambridge university press. [58] Gabriel Weimann. 1991. The influentials: Back to the concept of
opin-ion leaders? Public Opinopin-ion Quarterly 55, 2 (1991), 267–279. [59] Jianshu Weng, Ee-Peng Lim, Jing Jiang, and Qi He. 2010. Twitterrank:
finding topic-sensitive influential twitterers. In Proceedings of ACM international conference on Web search and data mining. ACM, 261–270. [60] Ladd Wheeler. 1966. Toward a theory of behavioral contagion.
Psy-chological Review73, 2 (1966), 179.
[61] Mike Williams. 2014. Rise of the Lifestyle Game: Gaming as Your Second Job. https://www.usgamer.net/articles/rise-of-the-lifestyle-game-gaming-as-your-second-job
[62] D. Yvette Wohn, Yu-hao Lee, Jieun Sung, and Torger Bjornrud. 2010. Building Common Ground and Reciprocity Through Social Network Games. In CHI ’10 Extended Abstracts on Human Factors in Computing Systems. ACM, 4423–4428. https://doi.org/10.1145/1753846.1754164 [63] Steven Wong. 2017. How Ubisoft Keeps ’The Division’
And ’Rainbow Six Siege’ Ahead Of The Competition. http://www.alistdaily.com/strategy/ubisoft-keeps-division-rainbow-six-siege-ahead-competition/. Accessed: 2017-9-19.
[64] Jiyoung Woo, Ah Reum Kang, and Huy Kang Kim. 2013. The contagion of malicious behaviors in online games. In ACM SIGCOMM Computer Communication Review, Vol. 43. ACM, 543–544.
[65] Jiyoung Woo, Byung Il Kwak, Jiyoun Lim, and Huy Kang Kim. 2014. Generosity as social contagion in virtual community. In International Conference on Social Informatics. Springer, 191–199.
[66] Nick Yee. 2006. Motivations for play in online games. CyberPsychology & behavior9, 6 (2006), 772–775.
[67] Nick Yee, Nicolas Ducheneaut, Les Nelson, and Peter Likarish. 2011. Introverted elves & conscientious gnomes: The expression of person-ality in World of Warcraft. In Proc. of the SIGCHI Conference on Human Factors in Computing Systems. ACM, 753–762.