A
Descriptive
Report of
Flooding in
the
Southern
States
Colorado Water
Resources
Research Institute
November 1990
Fort Collins,
Colorado
Cover Photo: Clairborne Lock and Dam on the Alabama River taken on March 24, 1990, at 56.3 feet, 14.3 feet above flood stage. The river crested the next day at 56.6 feet, a record flood. The water is about 5 feet above the bank-level walkways and the lock structure in the background is completely submerqec. (Courtesy Mobile District. U.S. Army Corps of Engineers. Robert Erhardt, Jr.)
Colorado State University is an equal opportunity/affirmative action employer and complies with all Federal and Colorado state laws, regulations, and executive orders regarding affirmative action requirements. The Office of Equal Opportunity is located in Room 314, Student Services Building. In order to assist Colorado State University in meeting its affirmative action responsibilities, ethnic minorities, women, and other protected class members are encouraged to apply and to so identify themselves.
The contents of this publication are the responsibility of the author(s) alone, and do not reflect the views if the Institute or Colorado State University.
Table of Contents
Introduction
1
Methods of Analysis
1
Area of Rainfall and Runoff
1
River Forecast Centers
2
Looking to the East
4
Water Project Operations
on the Arkansas River
6
Texas to the Gulf
8
Response, Assistance
and Aftermath
10
Research Continues
13
Conclusions
13
Recommendations
14
Acknowledgements
14
About the Author
14
Table 1. Selected Lake Levels
Trinity River Basin, Texas
8
Table 2
.
Preliminary FEMA
Disaster Assistance Data
11
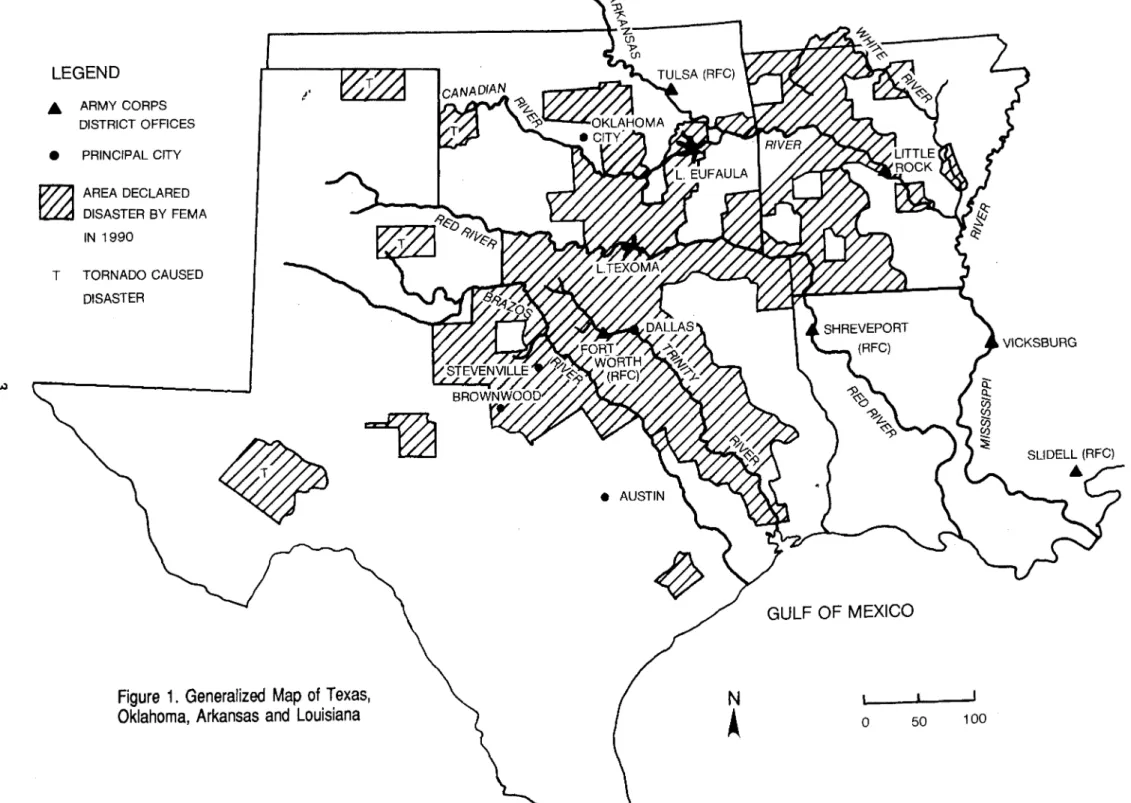
Figure 1. Generalized Map
of Texas, Oklahoma, Arkansas
Introduction
The year of 1990 will be remembered by many in the southern United States as a record year for extreme rainfall and disastrous flooding events. People in Alabama and Georgia recall the floods of 1929 and 1961 as almost as significant. Residents in Oklahoma, Arkansas and Texas will speak of 1927, 1945 and 1989 as being memorable. The year 1990 is significant because rarely, if ever, have devastating rainfall and runoff events occupied so many people in so many states across our country for so long a time period. This report is a summary of information of these events, bringing together the causes, responses, first-hand impressions and commentary of the widespread flooding of 1990. It will introduce relationships observed between hydrologic and social influences apparent in these memorable and significant events. Data sources are made available in the library of the Colorado Water Resources Research Institute for in-depth review and further study.
Methods
of
Analysis
Research material was gathered in several ways. Exploration of newspapers and other media provided a wealth of information upon which to do further recovery of records. From this beginning, in-depth personal contacts were made at the scenes; this was accomplished by telephone and personal interviews of persons knowledgeable of the various aspects of the phenomena.
Climatologists, weather analysts, hydrologists, engineers, project operators, disaster
assistance administrators and flood victims spoke about their role in the floods of 1990. Data were gathered on rainfall and its extent. Operating procedures for strategic water resource projects were discussed with the operating engineers. River forecasts and forecasting methods were discussed. Disaster response and assistance programs and their implementation were documented. It must be clear that hundreds of agencies and
thousands of individual citizens were part of these natural occurrences. The collected resources are but a sample of the existing record. Synthesis of this material was then prepared to gain an overall perspective. Certain details were suppressed for brevity
but they are available from the collected resources. Conclusions are drawn from these facts. From these conclusions,
recommendations are developed.
Area of Rainfall
and Runoff
The floods of 1990 were caused by extreme and unusual weather conditions. It is clear that an area of repeated, heavy rainfall extended from about Fort Worth in central Texas, eastward to the Flint River valley in central Georgia. The northern extent ranged roughly from southern Missouri and Tennessee to the Gulf Coast and the Florida panhandle, covering an area of approximately 400,000 square miles or about 15 percent of the continental United States. Oklahoma had its third highest January/February precipitation since 1892. March was the second highest month of record, averaging 5.93 inches across the state. This contrasted dramatically with the extended severe drought further west.
In the east, northern and central Georgia experienced severe winds, tornadoes, rainfall and flash flooding in February that was heavy enough to warrant several counties being declared disaster areas by the Georgia Emergency Management Agency (GEMA) and the Federal Emergency Management Agency (FEMA). The rainfall in the north Georgia-southern Tennessee region was produced by a series of storm cells moving in a line on
February 15 and 16. This is otten described as the "train echo effect" by meteorologists
because a series of radar echoes (indications of storms on the radar) movedoverthe same track one after another, similar to railroad cars in a train. In the west during the week of March 4, a large storm system produced heavy snows in the Rocky Mountains, severe icing in Iowa and heavy rains in nearly saturated conditions in Oklahoma and Arkansas which produced local flooding.
The following week, a powerful frontal system edged eastward, using unseasonably warm moist air from the Gulf to produce high winds, hail and tornadoes from the southern plains to the Mississippi valley. By week's end, this system produced torrential rains in southern Alabama and moved to Georgia, dropping up to 16 inches of water in less than 48 hours. By the end of March, the entire south central and southeastern United States, with the exception
of southern Florida, had received on average of about 2.5 to 3 times the normal precipitation since the first of the calendar year. But there was more to come. In April, a series of storm systems swept the eastern half of the U.S., dropping more moisture to the region and producing record low temperatures in the central U.S. By the last week in April, a cold front had become stationary over central Oklahoma and northern Texas. This storm dropped 16 inches of rain on Brownwood in central Texas, causing immediate heavy flooding. As the storm proceeded slowly to the northeast toward Arkansas, the basins of the Brazos, the Trinity, the Neches, the Sabine, the Red, the Canadian and the Arkansas rivers were overcome.
With reservoirs on the main stems of these rivers already full and the watersheds saturated, runoff filled all of these channels above flood stage. OnMay 2 and 3, up to 10 inches of rain fell in eastern Oklahoma and northern Arkansas. Fears of observers and reservoir operators had been realized. The lateral runoff inflows combined with full discharges from most flood control and non-flood control reservoirs created near record flood crests in the basins of the entire south central United States. Subsequently, severe events occurred in other areas such as eastern Ohio and Iowa. These areas received heavy media coverage, but are not included in this report.
River Forecast Centers
From the outset, the River Forecast Centers (RFCs) of the National Weather Service (NWS) in Atlanta, Georgia; Tulsa, Oklahoma; Shreveport and Slidell,
Louisiana; and Fort Worth, Texas had been monitoring the developing situation. Raw data in the form of rain gauge readings from the weather forecast offices and river gauge data from the U.S. Geological Survey gauge system were continuously fed to the centers. Trained meteorologists and hydrologists assembled the data, detected errors and formatted input files, while applying their detailed knowledge of their assigned watersheds and river systems.
These data, together with reservoir
discharge rates, were entered into computer software. The resulting hydrographs of predicted runoff were routed to stream gauge points to predict new river stages as the flows moved downstream. "Stage" is defined as a calibrated reading of water surface level at the gauge location, given in gauge feet or in elevation above mean sea level (msl).
The computer models comprise a system called the National Weather Service River Forecast System, constructed in modular parts based upon moisture balance principles. It is the result of 40 years of development by NWS and is very complex. With good input data and experienced hydrologic judgment, good results are obtained, according to personnel at Tulsa RFC.
Coordination is essential to the RFC mission because hydrologists must be advised of reservoir discharge contributions and other factors influencing the river flow and stage. One such controlling agency is the U.S. Army Corps of Engineers (the Corps) which has specially trained units within its District offices scattered throughout the region (see Figure 1). Power companies and special water districts also have reservoir facilities within the basins.
For this reason, the forecasting process is highly complex and requires skill,
experience and excellent communications. These professionals continue to develop and improve these communication systems. Problems are handled as they arise. Most difficulties stem from questionable input data. Sometimes, river stage information is missing, in dispute or in error. A dispute can arise when the observer gives a reading but states that the stage is more or less than a previous occasion. This may cause a conflict with the record and has to be resolved before the data are used. Forecasts are released in several ways. For public information, forecast data are released as needed on a daily or more frequent basis through the NWS system. These predictions are then picked up by the television and radio media for broadcast. Civil defense agencies obtain
(.t,)
LEGEND
• ARMY CORPS DISTRICT OFFICES • PRINCIPAL CITY ~ AREA DECLAREDrLLJ
DISASTER BY FEMA IN 1990 T TORNADO CAUSED DISASTER~
Figure 1. Generalized Map of Texas,
Oklahoma, Arkansas and Louisiana
N
~
GULF OF MEXICO
, j
o
50 100and use forecast data at this stage.
Forecast data are also transmitted between centers on an internal network for the purpose of time-location continuity in each river system.
The centers are similar in general organization but may vary significantly in the way data are used. This is because different computer model configurations are being used depending upon the
characteristics of the specific basin and river systems. Forecast data are aiso forwarded to the Corps for use in the planning of release strategy in the
operations of their many facilities throughout the region.
It must be pointed out that the U.S. Geological Survey (USGS), Water Resources Division, plays a key role in monitoring the nation's rivers. USGS maintains, monitors, records and archives river gauge and stream flow data across the United States. Thus, it provides part of the needed data base for the forecasting process. Each RFC has close contact with the USGS hydrologist responsible for the river gauges in its river systems.
Through the assembly and review of.raw data and the application of basin knowledge and professional judgment, the RFCs provide a critical link in the decision-making process between the unfolding natural phenomena and other professionals. Actions based upon these forecast data often can spell the success or failure of the allocation of limited resources and the saving of lives and property.
Looking to the East
In February, the severe weather began to make itself felt in the southeast. In Georgia and Tennessee, flooding was Wide-spread from the north to the south along the Chattooga, Chattahoochee and Flint rivers and their tributaries. On the morning of February 16, water reached 10 feet deep in the center of the twin cities of Copperhill and McCaysville, Tennessee. Watersheds were saturated and rivers were high due to the February storms, which left at least nine people dead and 5,000 people evacuated from their homes.
As record heat baked the east and storms stalked the Great Plains, extraordinary rains pounded the southeast in March. These caused flooding in southern Alabama, Georgia and the Florida
panhandle. The NWS River Forecast Center in Atlanta, together with the Mobile District of the Corps, monitored the situation in Alabama and Georgia. As rivers swelled in Alabama with the resulting runoff,
evacuations began in areas near
Montgomery and Selma on the Alabama River. Numerous homes in the floodplain were inundated and caskets from flooded cemeteries popped out of the ground and floated.
But smaller communities to the south were the hardest hit. The storm dropped up to 16 inches of rain on the saturated Alabama watersheds in a period of two days. On the evening of March 16, six people drown in Covington County when their car went off a damaged bridge into the high water. Elba, Alabama, a town of 4,400 residents, watched the White Water Creek and the Pea River rise quickly outside their levee until the aging embankment broke early on the morning of March 17.
It was a reenactment of the devastating flood of March 17, 1929, 61 years to the day when the entire town was submerged. This year's disaster put 10 to 15 feet of water into the business district in a matter of several hours, surpassing the levels of the 1929 flood. After the crest passed outside the levee, pressure opened another hole to let the trapped water out, and sucked a two-story office building out with it. An estimated 2,000 people evacuated the town and, amazingly, there were no injuries.
As in most flooding incidents, security was established to prevent people from entering their flooded homes and businesses until the waters receded and order was restored. The curfew was maintained for three days. Telephone, water, and power services were severed. Leaking natural gas services were numerous and presented a danger of fire or explosion. According to a study by nearby Troy State University, 127
businesses in Elba were affected by the flood. To date, the residents and
of Geneva, 45 miles downstream, was more fortunate. Knowing the·fate of Elba but deciding to fight, the residents were assisted by National Guardsmen as they patrolled and repaired the levee surrounding their town while the waters passed. Damage was light inside the levee, but severe outside.
In the Tombigbee River watershed of upper Alabama and Mississippi, impacts of carry-over rainfall from an associated storm system produced heavy runoff. Navigation structures were flooded as crests passed from the watershed areas in Tennessee to the Gulf. The Corps' Mobile District documented these impacts. Erosion and siltation occurred in the Tennessee-Tombigbee Waterway system, the lower Black Warrior River, Alabama River and the Mobile River Ship Channel. The Mobile District had started dredging projects in these systems totalling several million dollars by mid-May, although water levels were still high in the channels.
On March 17 in Atlanta, Georgia, the
Chattahoochee River crested at 7 feet above flood stage due to the intense storm moving in from Alabama. Power was cut off to a hospital, requiring the evacuation of about 100 patients. Apartments in the flood plain were flooded to about four feet. The main sewage plant overflowed, presumably due to inflows into the collection system, sending raw sewage into the river for about a day. Outlying suburban subdivisions were isolated for one to two days because of flooded roads and loss of utilities.
Downstream, the NWS/RFC-Atlanta predicted that the most extensive flooding on the Chattahoochee occurred between Columbus and Lake Seminole in the southwest corner of Georgia. On March 18, forecasts called for a crest of up to 9 feet above flood stage, the worst since 1964. Similar warnings were also issued for the Flint River system . .Numerous earthen dams were damaged or destroyed in Georgia, causing local flooding, loss of bridges and road damage. The following is an excerpt from the April 4, 1990, Monthly Report of River and Flood Conditions by the Weather Service Forecast Center (WSFC) Atlanta concerning a flooding event:
"Kinchafoonee Creek was a fascinating case study in Georgia Floods. After almost 9 inches of rain in the extreme north part of the
5
.Kinchafoonee basin and only 2 inches elsewhere. it seem that only minor to . . . moderate flooding was likely. However, in the late morning of the 17th, the report of two dams breaking in Webster County reached WSO Columbus, which promptly issued a Flash Flood Warning. An incredibly sharp crest began to show at the NWS gaging station on Kinchafoonee Creek at Preston, culminating in a record flood [stage] of 12.2 feet late on the 17th . . .. This surpassed the old record of 11.4 feet set in January 1943. The NWS immediately amended the forecast for the Leesburg area on Kinchafoonee Creek and called for a crest of 20 to 21 feet there on the 20th, near the record crest of 20.5 feet. This forecast received wide circulation through the local civil defense and especially television, due to the potential for flooding of a trailer park and homes in the Leesburg and north Albany areas. The water disappeared in the swamps between
Preston and Leesburg on the 18th and 19th . . . . This caused anxious moments at the Southeast River Forecast Center and the WSFC Atlanta when skeptics in Leesburg began to voice their disapproval. But late on the 19th, the sharp crest began to show on the gage near Leesburg, cresting at 20.45 feet at 2 AM on the 20th. The flooding of the Centu ry Road and Lower Kinchafoonee Road areas was as bad as had been predicted. and fortunately most residents heeded the early warnings and had already moved out."
In all,.as a result of these storms, 26 Alabama counties and 38 Georgia counties were
declared disaster areas under FEMA rules. In Alabama, 6.000 people were forced from their homes in addition to 2,000 in the Florida panhandle. Damages were estimated by the Emergency Management Agencies (excluding Elba) at $38 million to public roads and bridges and $10 million to homes and businesses. Other estimates have put the total damages in Alabama at over $100 million. In Alabama, 13 deaths were attributed to the floods. In Georgia, the Georgia Emergency Management Agency (GEMA) estimated the damages at $28 million.
Apparently, very few of the victims carried insurance under the National Flood Insurance Program. In Elba, it took several weeks to process the individual claims for assistance. In mid-June. the assistance packages of Small Business Administration (SBA) loans to
Water Project Operations on the
Arkansas River
In Tulsa. the operations personnel of the Corps' Tulsa District were continuously
monitorin~ the river navigation systems and
40 lakes In the upper Arkansas River and
Red River watersheds. Operating policies had been established and reviewed for this complex system based on the
characteristics of each project and downstream channel constraints.
In April, the Corps had closed some of its recreation areas bordering lakes Texoma and Eufaula, the two largest reservoirs in the district. Complaints of high water in the barge navigation channels of the Arkansas River had persuaded the Corps to modify flood control releases from the Eufaula. A series of press releases by the Corps had begun to supplement river forecasts of the RFCs for public information purposes. Low land flooding had already been a problem for farmers and ranchers along the lower Red River in Arkansas. Consequently. no flood water was being released to the Red River from Lake Texoma. The rain of late April struck.
On April 28, Lake Texoma crested at the second highest level in the lake's history, and releases to the lower Red River became mandatory. Within 24 hours. lake Eufaula also crested, setting a record level in its flood control pool. A tense situation had developed and downstream populations on the Arkansas and Red rivers were notified of the risks.
The storm systemof May 2 and 3 was the final straw for the storage system in Oklahoma. Peak inflows to Lake Eufaula were estimated by the Corps to be about 430.000 cubic feet per second (cts), Between May 2 and May 6, Hugo, Sardis, Waurika, Wister, McGee Creek, Arbuckle and Tenkiller lakes, in addition to Texoma and Eufaula. were all full to their respective flood pools, even with the planned release schedule. Discharges from Lake Eufaula alone went from 41,000 cfs to 230,000 cts. There was scant warning. NWS
hydrologists struggled around the clock to handle the incoming rainfall and lake discharge information. Nine forecasts were released for the period of May 2 and 3 in
which the RFC tracked the surge down the Arkansas and Red rivers. According to Tulsa RFC figures, the Arkansas River at Van Buren (just downstream of the Oklahoma state line) went from 5 feet above flood stage and 210,000 cts to 13 feet above flood stage and 430 000 cfs within 24 hours. At Little Rock: the river peaked at an estimated 460,000
cts.
At some points of the lower Arkansas River levels reached the highest in 47 years. On the Red River, releases from Lake Texoma went from no excess discharge to a peak of 144,800 cfs in about four days. Peak levels reached the highest in 40 years in Alexandria, Louisiana, according to newspaper reports.Meanwhile. in the Corps' Little Rock district downstream on the Arkansas River a different operating scenario was in ' progress. Northern Arkansas and southern Missouri were receiving similar rainfall. Six
mUI~ipur~ose reservoirs are in place in the
White River system serving the region because the narrow valleys of the hill country are ideal for recreation lakes and hydropower facilities. In these pools about 5.5 million acre-feet (maf) of flood
st~rage
is available.By the end of April, 25 percent of this storage was in use. The chain of Beaver Lake, Table Rock Lake and Bull Shoals Lake are operated as a series of buckets to optimize lake levels for recreation and hydro purposes, holding excess water in Beaver until Table Rock can be cleared of its own runoff.
~h~ prlrnary constraint on the system is the limitation on channel capacity of the White River due to the urban development and agricultural land uses downstream of the dams. Storage is usually ample and allows for smaller releases in June through
September. This policy makes more floodplain land available for summer cultivation.
Levee systems constructed along these channels by the Corps and others also prescribe the high end flow in the channels. Releases are normally increased in winter to clear the flood pools, according to the established operating rules. However, a primary variable in the system is the rainfall
adjacent to the channels producing lateral inflows to the channels to supplement the releases already in the river. Due to these constraints, Beaver Lake was tully surcharged by 1.2 feet above its flood pool on May 4th. Releases from Beaver plus inflow from its own watershed quickly increased the level in Table Rock. This increased the Table Rock discharge from 6,000 to 19,000 cfs over a 72 hour period. Bull Shoals received this water for storage; in June, it was at 89 percent ot flood pool capacity and 34 teet above
conservation pool. Discharge rates were held to 6,900 cts due to sensitive channels
downstream of the system.
Because of constrained releases mandated by the operating policy, flood pool storage reached 82 percent of system capacity by mid-June, equalling a system record
established in 1973. Flood damages occurred in April, May and June due to sheet runoff
and cut-er-bank flow in the downstream river system. Hydrologists for the Corps and the NWS-RFCs, working together, continued the discharging at allowable rates and monitored the system carefully. Under these conditions, the Corps estimated that, at allowable discharge rates and without significant additional rainfall, flood pools will not reach readiness levels until mid-September. Through this process, the Corps had stated that all of these projects had substantially reduced the flood damages, saving
billions of dollars in losses. It was estimated
that in the Red River watershed, the projects controlled 2.5 million acre feet of runoff and cut the downstream flood levels by as much as 6 to 12 feet. On ABC's Nightline television news program, Brigadier General Robert Lee, the commander of the Corps' Southwest Division in Dallas, said that the flood control system had worked properly, fulfilling its intended purpose (ABC NewsNideo Tape).
Photo 1. The Lake Texoma spillway on the Red River is being overtopped on May 4, 1990, as
spectators come to watch the lake at near-record level. (Courtesy of Tulsa District, U.S.ArmyCorps of Engineers, Ed Engelke.)
Texas to the Gulf
The flooding episodes of east Texas. perhaps more than any of the spring flooding events covered by this report. include all of the classic flood disaster
issues. Texans know about floods. Most
of the areas touched by the 1990 floods were also affected by flooding in 1989
when 88 of the 254 Texas counties were
declared disaster areas by FEMA. Some experts say that in certain other respects. the 1989 episode surpasses that of 1990.
North central Texas is made up of the watersheds of the Red, the Trinity and the
Brazos rivers. The Dallas-Fort Worth urban
area (called "the metro-plex" orDFW) plays a key role in the upper basin of the Trinity
River watershed. Houston, Texas' largest
city, is 250 miles to the south in its own watershed near the Gulf Coast and plays a different role in the flood picture. The Fort Worth District and the Galveston District of the Corps have jurisdiction over the affected area. The responsible River Forecast Center of the.National Weather Service is NWS/RFC-Fort Worth, located in the same building as the Corps' Fort Worth District office.
The initiating factor in the Texas floods of 1990 was intense rainfall on wet
watersheds in April and May. The months
of January through March were the tenth wettest on record for Texas. April 15 marked the turning point for central Texas when the saturated ground and intensified rainfall events produced flooding of disastrous significance. The affected counties formed a line from Brownwood to the northeast, parallel to the well-worn storm track toward the Trinity and the metro-plex (see Figure 1).
The following week, another storm dropped 16 to 18 inches of rain on the region, flooding the town of Brownwood and killing at least three people. This rainfall
continued into the Brazos and Trinity basins. At this point, the situation was similar to the developments in eastern Oklahoma with swollen rivers and all reservoirs topping the flood pools.
The week that followed broke all previous
records. The Fort Worth gauge of the
NWS officially recorded 5.7 inches of rain, 3.4 of it falling on May 2nd. What developed is known by hydrologists as a "routed flood."
Of the six lakes operated by the Corps' Fort Worth District in the upper basin of the Trinity. all but one set record levels as
shown in Table 1.
Table 1. Selected Lake Levels, Trinity River Basin, Texas (Source: Fort Worth District, U.S. Army Corps of Engineers)
Name of Lake Benbrook Joe Pool R. Roberts Lewisville Grapevine Lavon Top of Pool 724.0 536.0 640.5 532.0 560.0 503.5 Record Elev. 717.5 533.1 644.4 536.7 563.5 504.9 Record Date 5-3-90 5-20-90 5-3-90 5-4-90 11-1-81 5-3-90 Previous Record 6-15-89 6-20-89 7-16-89 11-1-81 6-14-89
Photo 2. The Trinity River is out of its banks along the Dallas Roodway at a near record level on May 3, 1990. (Courtesy Fort Worth District, U.S. Army Corps of Engineers, Ron Ruffennach).
Other lake operators, such as the Tarrant County Water Control District with four major water supply reservoirs in the same area, experienced similar developments. Almost all of the reservoirs mentioned are called
uncontrolled reservoirs in that they have un-gated spillways. The Dallas gauge on the Trinity, monitored by the USGS, posted its second highest reading of all time on May 4, exceeded only by the record of 1908, as upstream spillways discharged at record rates (see Photo 2).
It should be clear that had the attenuating effect of the reservoirs not been present, a watershed similar to conditions in 1908 may have produced an all time record discharge level. As it was, discharge in the rnetro-plex area was 17 feet above flood stage.
At the Fort Worth District, the Corps staff maintained an around-the-clock duty schedule from April 26 through May 5. The District receives rainfall data from 126 remote gauge locations via satellite. The data are
downloaded to the computer center in Fort Worth and transmitted to the District control center every hour. Engineers receive additional data from radar storm imaging, the NWS and their own operations personnel at the reservoir sites.
9
Data were assembled by computer models to a Decision Support System (DSS) data base, presenting information in graphic and tabular form. This information is used to set project discharge rates and "route" the flows to a target gauge location downstream. The whole
process is conducted within a set of operating rules for the projects which are structured to meet the project operating objectives. NWS/RFC forecasts can then predict the results.
The Trinity River had crested in the rnetro-plex by May 4. It would take about two weeks for the surge to traverse the 200 river miles to Lake Livingston through the rural Texas countryside. In some places, reports said the river was 10 miles wide. While rain continued to fall in parts of the upper basin, lateral inflows were slight. The floodplain residents in the lower basin under clear skies could only watch and wait. Thus the hydrologic concept of the routed flood is depicted.
At this juncture, it is interesting to note the activities of the newspapers in reporting the unfolding flood events. Press coverage appears to have increased dramatically during this period, alternately following the flood crests on the Arkansas/Red River systems and the impending fate of the lower Trinity.
The nature of Lake Livingston as a water supply and recreation facility with no flood control storage was fully developed by the press. Meetings were held between the Trinity River Authority (TRA - the lake operators), the downstream counties, disaster officials and the public on the impending releases and the operating policy for thelake. Every conceivable point of view from "pre-release" operations to "property buyout" was reported. The Corps' upper management was reported as being unsympathetic to the flood victims in the floodplain.
Congressmen alluded to more financial assistance from the Federal Governmentfor farmers in the floodplain. These pertained to crop and livestock losses in all of the affected southern states. Potential flood victims in the numerous floodplain
subdivisions downstream of the Livingston Dam were interviewed about their
preparations. Itwas reported that businesses in Liberty County were concerned that the media portrayed the entire county under water, discouraging future development capital. There were even articles about the volume of articles produced.
The President of the United States, George Bush, visited Lake Livingston on May 19 and made non-committal statements about disaster relief and other related issues. As a word of caution, researchers should be careful about using data from this media coverage. Several errors were noted. Unofficial reports indicate that Lake Livingston crested on about May 20 at a discharge rate of about 82,500 cfs and maintained this rate forseveraldays. Some unofficial sources reported a larger peak discharge. According to a NWS~RFC report, levels at Goodrich, just below the dam, did not exceed the record set in 1945. However, the report stated that significant changes to the channel of the Trinity from downstream of Romayor to below the town of Liberty created record levels at Liberty. County maps of this area obtained from the Liberty County Disaster Coordination office show that numerous riverside subdivisions, totaling over 2,000 homes,-have been built in the floodplain.
Flows would remain very high for several weeks, leaving many areas flooded for long periods. As the surge proceeded to
Galveston Bay, state experts predicted that 1,120 oyster fisherman would loose their entire crop due to the intrusion of fresh water into the oyster beds.
Response, Assistance and
Aftermath
Response and assistance to these events has various forms at the local, county, state and federal levels. These are addressed, but it should be made clear that many of the families and businesses who were flooded were assisted by helpful neighbors and organized volunteers.
As with any disaster, there is a mosaic of human courage and tragedy. Some responded with resignation and
determination while others were dismayed and immobilized. There is also the response of the natural environment such as plant, animal and geophysical systems. These aspects alone could take years of study. This report addresses only the broadest outline of immediate human response to this widespread phenomena by the responsible agencies. This is
accomplished by preliminary statistical information and the summarizing of commentary from persons at the scenes.
To understand the complexities of the response picture, the terms "response" and "assistance" must be defined, at least in the bureaucratic sense. "Response" refers to those initial actions which account for public safety and containment. Therefore, local and state units such as the local police and fire departments, county sheriff, state police, civil defense, on-duty or on-call medical and utility personnel are considered response units. National Guard units, at the direction of the state governor, may respond or assist depending on their mission and deployment. It is clear that the floods of 1990 impacted hundreds of thousands of people, whether victims or persons responding. There are stories by the hundreds among those people that experienced these events.
"Assistance" usually comes in the form of financial aid, supplies and services by
volunteer and paid personnel. State disaster
and emergency management offices are usually in the vanguard of sustained assistance efforts and are the management level between the county organizations and
the federal programs. Federal programs of
assistance are administered mainly by FEMA within designated regions throughout the U.S. Other agencies are sources of assistance, such as the Soil Conservation Service of the USDA. Table 2 brings together preliminary
data from a variety of sources. Many of the
figures
may
be superseded. The data inTable 2 are only a clue to the scope of disaster. State and FEMA officials often worked together on the preliminary assessment at the disaster scene and compiled reports. These reports supported the state governor's request for the
declaration. Once declaration was requested
by the governor and approved by President Bush, the coverage of the original declaration
was often expanded. For example, as
damage continued and was assessed, counties were added to the list of those eligible for federal assistance programs.
These programs, in general, are divided into grants for families and grants for public works,
mostly roads and bridges. Businesses are not
eligible for grants; SBA loans are usually available, however. States must participate in all grants initiated under the declaration. This participation is currently at 75/25 percent federal to state monies. States must meet a deadline for making their portion available for
disbursement to approved applications for assistance. In states with reserve funds, counties containing damaged property but not
declared by FEMA can be covered by that
state.
The state personnel encountered in this research were found to be extremely open and well intentioned. State emergency management agencies and their counterparts on the county and local level appear to have a wide range of
expertise and resources. Some have
responded quickly with experienced personnel while others have had to catch up to the activities at the local level. Problems can occur
in the process. In the Georgia-Tennessee
events, local response facilities were hit in the early stages of the flooding because they were in vulnerable locations.
Table 2. Preliminary FEMA Disaster Assistance Data
(Various sources; through June 15, 1990)
State FEMA /# Original Number of Declared
Declar. Amendment Counties
Georgia 857 Feb 23 5 38 Tennessee 858 Feb 27 NA 3 Alabama 861 Mar 23{?) NA 26 Florida 862 NA NA 11 Texas 863 May 2 13 62 Arkansas 865 May 15 NA 36 Oklahoma 866 May 18 4 25
Notes: 1. Other states have also been declared.
2. Louisiana was declared in 1989 but not in 1990. 3. Mississippi was not declared.
4. NA = data not available.
In summary, as local communities add up their costs of response and flood victims rebuild, consideration is being given to many issues. However, concrete changes that should be brought about by the experience of death and destruction have yet to materialize.
Research Continues
During the investigation for this report, it was learned that an inquiry was being conducted by the General Accounting Office (GAO) of the Federal Government into the effort of the participating agencies. Additionally, a special
mUlti-~gency team had been assembled by
the Director of the National Weather Service to assess these events and write a report. The July 1990 issue of the U.S. Water News reported that some scientists, inclUding James Hansen of NASA's Goddard Institute, think these flooding events may be evidence of global warming and the greenhouse effect. While many scientists dispute this notion, others support the possibility.
Conclusions
The task of reaching conclusions from the foregoing facts must necessarily include an
. a~empt to synthesize the total scope of the
disastrous floods of 1990. This must be done even though only a fraction of the relevant facts have been gathered by this preliminary research effort. Therefore, preliminary conclusions follow.
1. All weather information recovered to date shows that, although record rainfall was not observed everywhere in the study area, storms of very unusual severity, extent and frequency did occur.
2. The riversystems receiving the runoff are very complex, mainly because of·the natural terrain and the extent of development of water resource projects within their basins.
3. Operation of the NWS River Forecast Centers are essential to the monitoring of the b~~avio~ of the river systems. They provide a Critical link between the rainfall events and response of the rivers involved in those events. The establishment and continued
improvement of communications is an essential part of accomplishing this mission.
4. The Corps' planning, construction and operations were sign.ificant factors in most of the river systems observed. Personnel seemed to have the expertise, experience and resources to carry out their mission. There seemed to be conflict in the operational objectives of some projects, however. An example of this was in maintaining needed discharge rates from flood control reservoirs in Oklahoma while also maintaining optimum navigation conditions in the rivers. Another example is the difficult trade-off between safety of the reservoir flood storage pools and the agricultural activities encouraged in the downstream flood plains of northern Arkansas. It is possible that
~onstruction of certain multipurpose projects has
Introduced operating conditions so complex as to exceed the capability to obtain satisfactory solutions.
5. The Corps personnel levels and available tephnology seem to need more directed
application to the task of forecasting changes in the operations of projects. It is not clear if these resources are being fully utilized to obtain opfimurn responses to the changing conditions. 6. The observanons of FEMA operations suggest experience and efficiency. Many of the FEMA field people are "reservists" who are retired or former employees called in for temporary service. This holds down.operannq costs. Contact with the victims and timely reporting seem to be priorities. State and federal personnel seemed to work well together. 7. Reports indicate that some states have much better local emergency organizations than others. State disaster assistance personnel seemed to have a wide range of experience. So~e states are more dependent upon federal
asststance, thereby having to limit assistance
funding to the applications which qualify for federal matching funds. They do not have large reserves for the more severe disasters. 8. Based on preliminary information, most flood victims are disinclined to recognize the risk of occupylnq the floodplain. .The flood-prone properties covered by the Spring of 1990 flooding events will probably be rebuilt and improved. There is lack of strong public awareness of flood risk.
Recommendations
The following recommendations are made based on the preceding conclusions. 1. Improvements are needed in
communications among agencies whose activities affect the changes in the flow of river systems. This includes local agencies which monitor construction in the floodplain. 2.The Corps needs to improve the use of the technology resources currently available to its districts.
3. Support of the National Weather Service River Forecast Centers in the form of more advanced technology and increased funding should be considered.
4. Federalpolicy should be developed which ties the existing federal agencies, including the Corps, together in a broad based integration focused on land use planning for flood-prone areas.
It
appears that FEMA has a wealth of experience and data that may be useful to this process. This effort should be integrated with other national policies such as those dealing with development of water resources, protection of wetlands and the National FloodInsurance Program.
5. Public awareness of flood risk should be increased and emergency information should be more available to responding individuals and agencies. One FEMA IHMT report called for placement of markers in flood-prone areas showing the record flood levels.
6. Opportunities for research into the social, economic, environmental and geophysical impacts of the floods of 1990 should be pursued. Results of this research should be coordinated and made available to educators for its case study and instructional value.
Acknowledgements
Funds for this research effort were provided by the Colorado Water Resources Research Institute, Dr. N. S. Grigg, Director. The hydrologists of the Tulsa and Slidell
NWS-RFCs provided insight into the behavior of the impacted river basins. Operating engineers and public information officers of the Corps' District Offices at Tulsa, Little Rock, Mobile and Fort Worth were
extremely helpful in completing the record. Field and office personnel of both the Federal Emergency Management Agency and the state agencies were very helpful in providing a day-to-day perspective of flooding and disaster assistance.
About the Author
John R. Clark, P.E., is a consulting civil engineer and a doctoral student in Water Resources Management and Planning, Department of Civil Engineering, Colorado State University, Fort Collins. The
information in this research record was obtained from a 12 day visit to the study area. The trip included 20 interviews.