JOURNAL OF
ENVIRONMENTAL HYDROLOGY
The Open Access Electronic Journal of the International Association for Environmental Hydrology
On the World Wide Web at http://www.hydroweb.com
VOLUME 23
2015
EFFECT OF AGRICULTURAL ACTIVITIES ON
GROUNDWATER VULNERABILITY:
CASE STUDY OF HALABJA SAIDSADIQ BASIN, IRAQ
Twana O. Abdullah1Salahalddin S. Ali2
Nadhir A. Al-Ansari3
1Department of Geology, University of Sulaimani, Kurdistan
Region, NE. Iraq
2President, University of Sulaimani, Kurdistan Region, NE.
Iraq
3Department of Civil, Environmental and Natural Resources
and Engineering, Lulea University of Technology, Sweden
Groundwater is one of the main sources of water in Halabja-Saidsadiq Basin of northeast Iraq. It covers an area of 1278 square kilometers with population of about 190,727.In this study, the standard DRASTIC method has been applied to generate a map of groundwater pollution vulnerability of the basin. In addition, two different scenes of landsat Thematic Mapper (TM) were used with the aid of ERDAS IMAGINE software and the GIS technique to prepare digital image classification of the study basin. Supervised classification for level I of USGS was conducted with band combination RGB/742 to prepare The Land Use and Land Cover (LULC) map. The LULC map illustrates that only five classes of land use can be identified these are: barren, agricultural, vegetation, urban and wet land or water body. The LULC map converted to LULC index map. This index map has an additional parameter added to the standard DRASTIC model to map the modified DRASTIC vulnerability in the study basin. Nitrate concentration analysis was selected and added as a pollution indicator to validate this modification. In this study, the nitrate concentration between two different seasons (dry and wet) was analyzed from (30) water wells. The standard vulnerability map of the studied basin classified the basin into four vulnerability index zones: very low (34%), low (13%), moderate (48%) and high (5%). While the combined modification classified the area into five classes: very low (1.17%), low (36.82%), moderate (17.57%), high (43.42%) and very high (1.02%). The results s that the modified DRASTIC model was dramatically superior to the standard model; therefore, the most appropriate method to apply is the combination of standard DRASTIC model with LULC index map. This conclusion is based on the results of nitrate content, as its concentration in the dry season is much lower than in the wet season.
INTRODUCTION
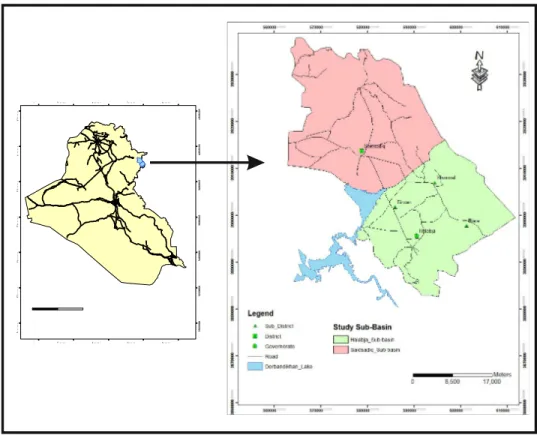
Many regions in the world are explicitly dependent on groundwater as one of the main water resource, specifically in arid and semi-arid regions. In Halabja and Saidsadiq area which is located northeastern part of Iraq (Figure 1), groundwater plays an important role in providing water for drinking, industrial and agricultural activities. Preior 2003, this area was destructed by army attacks by chemical weapons. In addition, some parts of the area are characterized by the lack of water projects. After 2003, the area is experiencing considerable economic development and enhanced security. Furthermore, the administrative structure of Halabja has been changed from District to Governorate in March 2014; this will definitely enhance the beginning of greater economic development and advancement. In view of these changes, there is an increase in the number of people heading to live in this basin and its surrounding regions. This is imposing a growing demand for water. It should be mentioned however, that the area has large number of surface water projects which are also heavily dependent on ground water for drinking, irrigation and industry.
According to the data obtained from the Directorate of Groundwater in Sulaimani City, several thousand deep wells exits in the studied area. As a consequence, the study of the groundwater resources and its potential pollution in the area become a necessity. Moreover, it is worth noting that no previous studies have been conducted on this vital area in terms of contamination.
The most suitable, effective and widely used models to assess groundwater vulnerability to a wide range of potential contaminants is DRASTIC which has been developed by Environmental Protection Agency (EPA) of the United States to organize the pollution potential of aquifers (Aller et al. 1987, Evans et al., 1990; Fritch, et al., 2000; Knox et al., 1993; Piscopo, 2001; Rundquist et al., 1991; Secunda et al., 1998).
In any specified area, vulnerability to contamination identifies a dimensionless index function of hydrogeological factors, anthropogenic influences and sources of contamination (Plymale and Angle, 2002). The DRASTIC index comprises seven parameters with different rating and weighting value and is calculated based on the following equation (Aller, et al.,1987):
V =
∑
i=1
7
(Wi × Ri) (1)
where V = index value, Wi = weighting coefficient for parameter I, and Ri = related rating value.
DRASTIC method as designed by Aller et al. (1987) consist of seven physical parameters .The most important map able factor that control groundwater pollution comprise to be the depth to water (D), Net recharge (R), Aquifer media (A), Soil media (S), Topography (T), Impact of vadose zone media (I), and Hydraulic conductivity (C).These parameters are weighted from one to five based on their relative significance in contributing to the contamination potential .All rating and weighting value are explained in table (1) based on Aller et al. ( 1987). The achieving index is a qualified measure of vulnerability to contamination; areas with a higher index value are more vulnerable than those with a lower index.
The effect of human and natural process as an fundamental environmental erratic can be identified from land use/ land cover map (Meyer and Turner, 1992). Land use / land cover normally marked by a short term of (LULC). Land cover (LC) defines the cover of the earth surface that naturally occur such as barin land, forest, grassland, vegetation, snow and water. Land use (LU) illustrates the modification of land cover due to human processes or man-made modification (Cihlar et al., 2001). Remote sensing technique and field survey can be used to supervise LULC. As mentioned by (Mas, 1999) and cited in
Table 1. Data for the DRASTIC index (Aller et al., 1987).
Depth to water Net Recharge Aquifer Media Soil Media
Range (m) Rating Range
(mm/year) Rating Range Rating Range Rating
0-4.5 10 <50 1 Massive shale 2 Thin or Absent,
Gravel 10 1.5-4.5 9 50-100 3 Metamorphic/ Igneous 3 Sand 9 4.5-7.5 8 100-175 6 Weathered metamorphic/ Igneous 4 Peat 8
7.5-10 7 175-250 8 Glacial Till 5 Shrinking
and/or aggregated clay 7 10-12.5 6 >250 9 Bedded sandstone, limestone, shale 6 Sandy loam 6 12.5-15 5 Massive sandstone, massive limestone 6 Loam 5 15-19 4 Sand and
gravel 8 Silty loam 4
19-23 3 Basalt 9 Clay loam 3
23-30 2 Karst limestone 10 Muck 2
>30 1 Non shrinking
and
non-aggregated clay
1
DRASTIC weight: 5 DRASTIC weight: 4 DRASTIC weight: 3 DRASTIC weight: 2
Topography Impact of Vadose Zone Hydraulic Conductivity
Range % Rating Range Rating Range (m/day) Rating
0-2 10 Confining layer 1 <4 1 2-6 9 Silty/clay 3 4-12 2 6-12 5 Shale 3 12-30 4 12-18 3 Limestone 6 30-40 6 >18 1 Sandstone, Bedded Limestone 6 40-80 8 Sandstone, shale,
sand and gravel 6 >80 10
Metamorphic/ Igneous
4 Sand and gravel 8
Basalt 9
Karst limestone 10
(Jwan et al., 2013), remotely sensed satellite images is the most widespread source of data for mapping LULC, because of its availability and repetitive data acquisition, improved quality of multi-spatial and multi-temporal remote sensing data at different (spatial, spectral, and digital) format suitable for computer processing and new analytical techniques .
The objective of this study is to prepare the land use / land cover map of study basin and employ it as an additional parameter to the DRASTIC model to exemplify the realistic potential of groundwater vulnerability to pollution.
STUDY AREA
Geographically, Halabja Saidsadiq Basin is located in the northeastern part of Iraq between the latitude 35” 00 00" and 35" 36’ 00" N and the longitude 45” 36’ 00" and 46” 12’ 00" E (Figure 1). Ali (2007) divided this basin into two sub-basins by including Halabja- Khurmal and Said Sadiq sub-basins. The whole area of both sub-basins is about 1278 square kilometers with population of about 190,727 in early 2015 according to the data achieved from Statistical Directorate in Sulaimaniyah. It is characterized by a distinct continental interior climate with hot summers and cold winters of the Mediterranean type with the average annual precipitation ranging from 500 to 700 mm. About 57% of the studied area is an arable area due to its suitability for agriculture. Consequently, the use of fertilizers and pesticides are common practices, so it affects the groundwater quality (Huang et al., 2012, Al-Rawabdeh et al., 2013, 2014). In addition, all of the municipal wastewater from the cities of Halabja and Saidsadiq and all other sub-district sites within this basin infiltrate into the groundwater every year.
Geology of the study basin
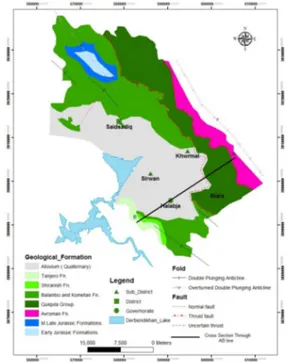
Geologically, the studied area is located within Western Zagros Fold-Thrust Belt. Structurally, located within the High Folded zone, Imbricated, and Thrust Zones (Buday, 1980, Buday and Jassim, 1987, and Jassim and Goff, 2006). The age of the exposed rocks in the area is from Jurassic to recent (Figures 2 and 3). The oldest exposed rocks in the basin are of Sarki and Sehkanian (Bellen et al., 1959) of Jurassic age. These are followed by lower and middle Jurassic rocks including Barsarin (limestone and dolomitic limestone), Naokelekan (bituminous limestone) and Sargalu Formations, (Ali, 2007). The Qulqula Group consists of two formations, the Qulqula Radiolarian Formation and the Qulqula Conglomerate Formation. In addition, the exposures of the Upper Cretaceous Kometan (Turonian) and Lower Cretaceous Balambo (Valanginian-Cenomanian) Formations are widespread in the area where they are exposed in both sub-basins. Shiranish Formation (Campanian) and Tanjero Formation (Campanian-Maastrichtian) are also exposed in the basin but with restricted outcrops.
Quaternary (Alluvial) deposits are the most important unit in the area in terms of hydrogeological characteristic and water supply. These sediments are deposited as debris flow on the gently sloping plains or as channel deposits or as channel margin deposits and over bank deposits (Ali, 2007). Previous studies (e.g. Ali, 2007, Baziany, 2006, Baziany and Karim, 2007) stated that the thickness of these deposits are recorded up to 150 m thick while field observations in this study has recorded thicknesses of these deposits up to nearly 300 m.
Figure 2. Geological map of study basin.
Hydrogeology and hydrology of the study basin
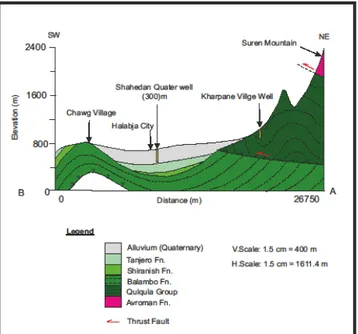
Permeability and porosity are the main principal factors in determining the potential of the area to be considered as a water bearing aquifer. The area is characterized by at least four different hydrogeological aquifers due to presence of different geological units. The characteristic features of the aquifers are tabulated in Table 2. From the collected data in the field and those listed in the archives of the Groundwater Directorate at Sulaimaniyah, show that the mountain series which surround the basin in the northeast and southeast, are characterized by high depth of groundwater. Toward the center and
the southeastern part of the study area, the groundwater level has a relatively lower depth. The movement of groundwater is usually from high elevated areas at the north and northeast and south and southeast towards southwest or generally toward the reservoir of Derbandikhan Dam (Figure 4).
Figure 3. Cross section through line A-B (FAO, 2001and Ali, 2007) Table 2. Type of aquifers in the study basin.
Aquifer type Geological formation Thickness (m) References Intergranular Aquifer Quaternary deposits more than 300 Authors
Fissured Aquifer Balambo
Kometan 250
Ali,2007
Fissured-Karstic
Aquifer Avroman Jurassic formation 200From 80 to 200 Jassim and Goff,2006
Non-Aquifer (Aquitard) QulqulaShiranish Tanjero
more than 500 225
2000
Jassim and Goff,2006
Furthermore, several rivers exist in the area, such as Sirwan, Zalm, Chaqan, Biara, Reshen and Zmkan. All these rivers impound their water in Derbandikhan reservoir. There are several springs within the basin (see Figure 4). These springs can be classified into three classes according to their water discharge. The first group having discharge that is less than 10 L/S (such as Anab, Basak, Bawakochak and 30 other springs springs). The second group having discharge of 10 to100 L/S (such as Sheramar, Qwmash , Khwrmal and Kani Saraw) and finally those having water discharge more than 100 L/S (such as Garaw, Ganjan, Reshen, Sarawy Swbhan Agha and 3 other springs) (Figure 4).
Figure 4. Hydrogeological map of study basin.
METHODOLOGY
Materials and source of dataThe data used for groundwater vulnerability mapping and their source are presented in Table 3. Features were used to create the shape files with (Arc Map 10) software, including the geological, hydrogeological, soil map and hydro chemical data for the study area. The topographic map of the area was digitized and converted from slope map into shape files. Depth to water levels was measured from several wells in the field using electrical sounder in addition to previous records of drilled and tested wells. The thickness of saturated zone was determined from drilled wells directly supervised by researchers for this study during field work. In addition, relevant data were added which were obtained from the Groundwater Directorate in Sulaimani and other private companies. Pumping test results of the wells within the area were used to calculate the hydraulic conductivity. “AQTESOLV” software was used in these calculations. LULC had been prepared using satellite image remote sensing technique with the aid of (ERDAS IMAGING software) and GIS. Nitrate concentration analysis used to validate the proposed modification.
Standard DRASTIC Model
DRASTIC model applied in a GIS environment was used to evaluate the vulnerability of the study area. This model is recommended by the United State Committee of Environmental Protection Agency (Aller et al., 1987). Seven parameters are used in the model (see Table 2) to represent the concept of
Table 3: Source of data for DRASTIC model. Sources
Data type
Archives of Groundwater Directorate in Sulaimani with data from field.
Depth to water table
Halabja Meteorological Station and Water Balance Method. Net recharge
Archives of Groundwater Directorate in Sulaimani and Geological Map.
Aquifer media
Soil Map by FAO 2001 and Berding 2003. Soil media
DEM with 30 m pixel size. Topographic map
Archives of Groundwater Directorate in Sulaimani. Impact of vadose zone
Archives of Groundwater Directorate in Sulaimani with data from field.
Hydraulic conductivity
the hydrogeological setting that includes the major geologic and hydrologic factors affecting and controlling the groundwater movement into, through and out of an area (Aller et al., 1987). Each parameter has a specific rate and weight value in order to evaluate the intrinsic vulnerability index. In addition, Aller et al. (1987) defined the seven parameters by the short form "DRASTIC" which is used to mapping groundwater Vulnerability (Tables 1 and 2). Each parameter has a rating on a scale of 1 to 10, based on functional curves. This rating is then scaled by a weighting factor from 1 to 5; according to their relative susceptibility to pollutants. The standard DRASTIC index (DI(w-r)) calculated is based
on the linear combination of all parameters as demonstrated by the following equation:
DI =DWDr+ RWRr+ AWAr+ SWSr+ TWTr+ IWIr+ CWCr (2)
where DI is the DRASTIC Index, (D, R, A, S, T, I and C) are the seven parameters, w is the weight parameter and r is the rate of the parameter. All the recommended rates and weights are shown in Table 1.
D is the depth to groundwater which is described as the distance of unsaturated zone that pollutant desires to travel through to reach the water table. For this paper, groundwater level were measured and documented in about 1200 wells. Water table measurements were taken in May and early June because these months are considered as the potential worst-case scenario due to the low depth of groundwater. The Inverse Distance Weighted (IDW) were used to interpolate the data to construct the depth to water table layer as a raster format and then reclassified based on the ranges and rating recommended by Aller et al. (1987). In Halabja-Saidsadiq basin the depth to groundwater vary from zero to more than 100 m. Therefore, ten classes were used for the studied basin. These are 0-1.5, 1.5-4.5, 4.5-7.5, 7.5-10, 10-12.5,12.5-15, 15-23, 23-30 and more than 30m.
R is the net recharge which defines the amount of water that penetrates into ground and move through the unsaturated zone to reach the water table. The net recharge was estimated from the meteorological data for the period starting from 2001-2002 to 2013-2014 based on the following equation which was recommended by Mehta et al. (2006):
NR = P – ET – R0 (3)
evapotranspiration in mm/year, and R0 is the total runoff in mm.
P was calculated from the average total yearly precipitation which is about (691.16) mm/year. ET was calculated based on Crop Water Balance method by FAO Penman Monteith method using (CROPWat8.0) software, (Allen et al., 2006).
R0 was calculated based on Soil Conservation Service method (SCS) to estimate the total runoff for
the basin.
The basin was divided into several curve number (CN) that was recommended by (Ali, 2007) and then using the following equation:
Q = (P-0.2S)2/(P+0.8S) for P>0.2S (4)
S = (25400/CN)-254 (5)
where Q = accumulated runoff excess in (mm), and P = accumulated average monthly rainfall (mm). So the annual runoff of this basin is about 169 mm and the annual net recharge for whole basin is
equal to 172.54 mm.
The net recharge map of the basin constructed was based on the net recharge percent distribution over the basin the map was converted from polygon to raster format in GIS environment.
Aquifer media (A) and the impact of vadose zone were constructed based on the geological map of the basin and from the drilling well logs. Four sections of the aquifer media were classified in the studied basin. The rated value for each media based on Aller et al. (1987) was illustrated as (9, 6, 5 and 3). While three segment of vadose zone were comprised with organized rating value of 4, 5 and 8. S is the soil media (texture and type) which defines the ability of a pollutant to move vertically into the vadose zone (Lee, 2003). Three different soil media were found in the area based on soil map proposed by (FAO, 2001 and Berding, 2003) including, Silty loam, Shrinking and/or aggregated clay and thin or absent with rating of 4, 7 and 10 respectively.
T map refers to the topographic map that describes the slope of the surface area. The pollutants are remaining for a long period over an area with low percent of slope value and vice versa (Hernandez et al., 2004). This map was constructed from the digital elevation model (DEM) with pixel size of (30 m) and the slope aspect was then calculated from it in Arc GIS 10. The topography of the area was classified into five classes ranging as 0-2%, 2-6%, 6-12%, 12-18% and >18%. Hydraulic conductivity (C) describes the ability of the aquifer material to transmit water through it and contaminant migration is control by the permeability of the media (Hamamin, 2011). The hydraulic conductivity map was constructed by employing the pumping test result of about 10 wells. The pumping test data were analyzed using (AQTESOL 4.0) software to determine the transmissivity of the aquifer and then equation (6) was used to calculate the hydraulic conductivity:
C=T/b (6)
where C is the hydraulic conductivity in (m/day), T is the transmissivity in (m2/day), and b is the
aquifer saturated thickness in (m).
The area with high hydraulic conductivity revealed higher chance of distributing pollutants. Two classes of conductivity rating were achieved, 1 and 4. After generating all the required layers, each pixel was classified and rated, then, multiplied by their respective weighting factor and the DRASTIC index was determined. The final index obtained was divided into several groups as proposed by (Aller et al., 1987). Small value designated low vulnerability potential while large value represents areas that have high vulnerability potential.
Land use/ land cover (LULC) map
Two different scene of landsat Thematic Mapper (TM) had been used to prepare LULC map because the study basin is located in between them. Images consist of seven spectral bands with cell size (30x30 m) for Bands 1 to 5 and 7.While, spatial resolution for Band 6 (thermal infrared) is 120 meters, however this band re-sampled to 30-meter pixels. Nearly, scene size is 170 km north-south by 183 km east-west and the date back to (03-05-2010). Figure 5 illustrates the TM landsat image for the study basin.
Figure 5. TM landsat map (2010) of study basin
The most important steps in LULC preparation is classification processes because it gives you the degree of accuracy. There are several proposed methods for LULC classification in the world, but the USGS system that developed by Anderson et al., 1976 is applied in this study. The factors that support us to select this method is depends on remote sensing data which are available and it is suitable for application in the study basin as well. The USGS system of classification consists of four levels, from I to IV; the difference between them depends on the resolution of remote sensing data used for classification, (Bety, 2013)
ERDAS IMAGINE software was used to prepare digital image classification of the study basin. Supervised classification for level I of USGS done with band combination RGB / 742 for image covered basin. The study area is extract from the results map of classification according to the catchment area of HSB using ArcGIS software. The analyses are supported by field works. Many
points taken with GPS and several photos were taken as well to check the accuracy and validity of the final map of classification.
Modified standard DRASTIC model using LULC Index Map
As mentioned previously, to modify the likely risk of groundwater vulnerability an additional parameter can be inserted into the analysis to show the realistic of vulnerability assessment. In this study, LULC map was used because it muscularly affects the quality of groundwater where agriculture as the main land use type is the main factor in changing of soil nature and hydraulic conductivity (Merchant, 1994).
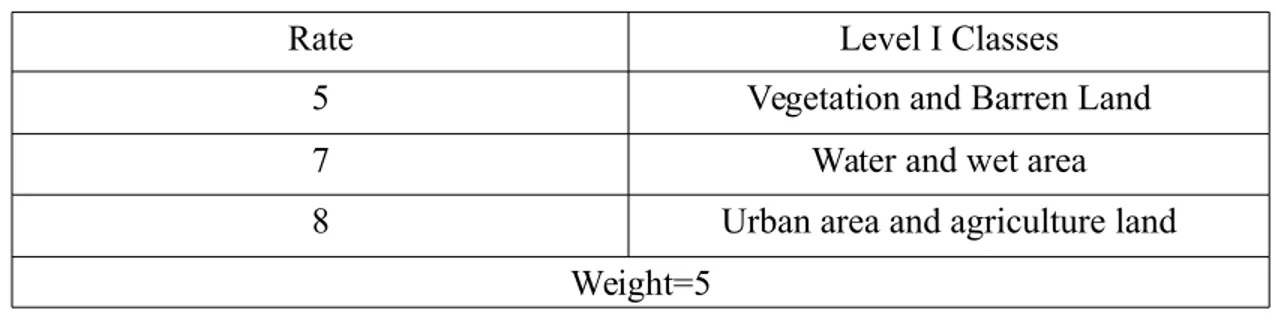
Therefore, LULC map was rated and weighted as additional parameter and added to standard DRASTIC model. The LULC rating map was rated based on the values given in Table 3. Furthermore, it was converted to a raster grid and multiplied by the weight of the parameters (Lw = 5) to construct LULC index map (Abdullah et al., 2014). Then, to modify the original DRASTIC index map, it was combined with LULC index map based on equation (7) (Secunda et al., 1998).The results demonstrate the effect of specific land use type on the vulnerability system.
MD(i) = DI + (LULC Index) (7)
where MD(i) is the modified DRASTIC model, DI is the standard DRASTIC index, and the LULC index (ratings·weights).
Table 3: Rate and weight for LULC classes (Secunda et al., 1998). Level I Classes Rate
Vegetation and Barren Land 5
Water and wet area 7
Urban area and agriculture land 8
Weight=5
RESULT AND DISCUSSION
Assessment of standard vulnerability mappingFigure 6 shows the original DRASTIC vulnerability model of HSB with four zones of vulnerability index. These are: very low, low, moderate and high vulnerability index. The map obviously illustrates the dominance of moderate and very low vulnerability zones which covers an area of 614 and 435 Km2
or (48% and 34%) of the whole studied area respectively. The moderate vulnerability zone occupies two different areas in terms of geological and hydrogeological conditions. The first is the area of mountains surrounding the studied basin which comprises the fissured and karstic aquifer. While the second area comprises the Quaternary deposits surrounding the area of Derbandikhan reservoir in the southwest of the basin, this might be related to the high water table level and high percent of coarse grain material such as gravel, sand and rock fragment. Furthermore, the zone with low vulnerability comes in the third sequence and occupy 166 km2 or 13% of the overall surface area of the basin. The
zone with high vulnerability index cover only 64 km2 or 5% of the total area and is located in the center
of basin. This area is characterized by high water table level and presence of several springs with fractured limestone.
Assessment of LULC map
method of classification ( Bety,2013), using remote sensing and GIS techniques from satellite landsat images (ETM+, 2010).The map demonstrates that only five classes can be recognized as explained on Table 4 with percent and the area of land covering of each.
Figure 6. Standard DRASTIC Map for study basin. Table 4: LULC classes type in the study basin.
Level I Classes Area _ Km2 Area_ % Urban 16.79 1.31 Agriculture 449.77 35.19 Barren Land 766.36 59.97 Vegetation 39.75 3.11
Water and wet land 5.33
0.42
The map illustrates that barren land covered most of studied basin land with an area of (766.36) km2
or (59.97%) of total studied area. In addition, agriculture land cover with an area of (449.77) km2 or
(vegetation, urban area and water and wet land) covering an area of 39.75, 16.79 and 5.33 Km2 or
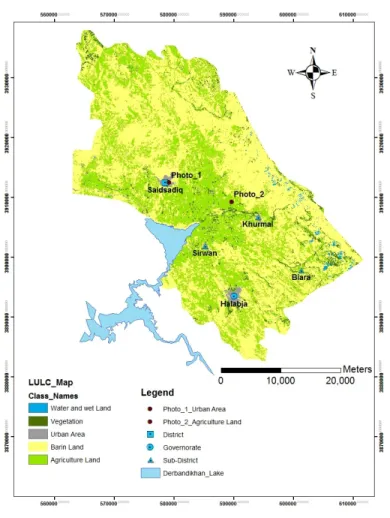
(3.11% , 1.31% and 0.42%) of the whole studied area respectively. To check the accuracy of the final LULC map several points in the field were taken with GPS in each class and matched on the map. In addition, several photos of each point were taken as well, all results verify the accuracy of this classification and the result of field survey coincide the theoretical classification using remote sensing. Photos 1 and 2 illustrate urban area and agriculture land as an example for checking accuracy with coordinate value of (579195,3912525 and 589644,3909281) respectively and both point placed on LULC map (Figure 7 ).
Photo 1. Urban area at Saidsadiq District Photo 2. Agriculture land close to Banishar Village
Assessment of LULC rating and index maps
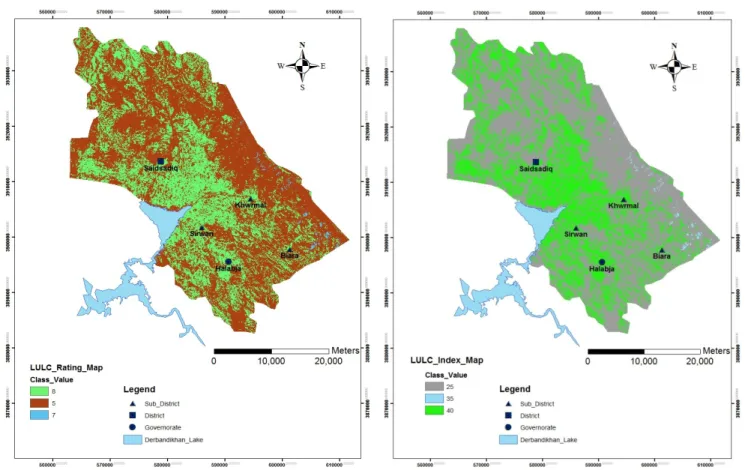
The map of ratings of LULC in (Figure 8) illustrate rating value ranging from 5–8 (Table 5). Urban areas and agricultural land were assigned a probability rating of 8, because chemical contaminant concentrations such as nitrogen in groundwater from human activities in urban and agriculture areas were higher than in all other land use areas (Secunda et al., 1998). Vegetation and barren land areas were combined and assigned a probability rating of 5, as they contain low nitrogen of nearly similar concentrations. Water body and wet land area were rated allocated of 7 (Secunda et al., 1998) as water acts as a good transporter for contaminant.
Additionally, it can be noted from Figure 8, rating value of class (5) occupies most of studied basin with 63.1% of the entire studied area. This class located in most of surrounding mountains and areas of high percent of pasture. Rationally, in terms of land use, these areas have the lowest effect environmentally on vulnerability aspects. Moreover, urban area and agricultural land were rated of probability of 8 and occupies 36.5% of the intact studied area. This is refer to human activities in these area compared to other land use class. Water body and wet land occupies only 0.4% of the whole area with rating value of (7).
Furthermore, the LULC rating map as a raster grid was multiplied using map algebra in GIS environment by the weight of the parameters (Lw = 5) to construct LULC index map as shown in Figure 9. The index value classified into three classes (25, 35 and 40) , which occupies (63.1%, 0.4% and 36.5%) of the total area of studied basin respectively.
Figure 7. LULC map for the study basin.
Table 5: Rating value for each LULC classes type, after (Secunda et al., 1998) Level I Classes Rating value
Area%
Vegetation and Barren Land 5
63.1
Water and wet area 7
0.4
Urban area and agriculture land 8
36.5
Weight=5
Assessment of modified DRASTIC vulnerability model
Figure (10) shows the modified DRASTIC index map based on LULC index map with ranging of (88-221). The range of index values was divided into five classes including very low to very high vulnerability classes (Table 6 ).
The modified vulnerability map shows that about 43.42% of the study basin has high vulnerability to contamination with index values ranging between 150 to 200. Low vulnerability measured as a second effective class in the studied area with (36.82%). While, very low, moderate and very high areas comprise 1.17%, %17.57 and %1.02 respectively. In terms of land use class, agriculture and barren lands occupies most of studied basin with total area of (1216.3) Km2 or 95.16% of the whole studied
Figure 8. LULC rating map for the study basin. Figure 9. LULC index map for the study basin.
Table 6: Modified DRASTIC index value of each class at study basin. Vulnerability class Drastic Index Area(Km2) Area (%) Very low 88-100 14.95 1.17 Low >100-125 470.7 36.82 Moderate >125-150 224.51 17.57 High >150-200 554.85 43.42 Very high >200-221 12.99 1.02
standard one, as the agriculture land plays a significant role to convert the moderate vulnerability zone in the central and north western parts to high vulnerability zone. In addition, both barren with agriculture lands are the main factors to rise up very low vulnerability zone to low vulnerability in the north east and south east of the study basin.
Validation of proposed modified DRASTIC model
In order to validate the proposed modified DRASTIC Vulnerability model using LULC map, nitrate concentration analysis has been selected. Nitrate as a pollution indicator can be helpful to recognize the evolution and changes of groundwater quality. In the particular study case, the nitrate differences between two following seasons (dry and wet) were analyzed from (30) water wells. The samples were collected and analyzed on end of September 2014 for dry season and end of May 2015 for wet season. The selected wells for nitrate concentration measurement located in all vulnerability zones and land use classes. The final nitrate classes from the chemical analysis of groundwater samples for both seasons are used to know the impact of human activities on groundwater quality (Figures 11 and 12).
In relation to nitrate values for dry season (absence of rainfall for a long period), low nitrate levels were identified with concentration value ranging between zero to just above 10 mg/l. While for wet season which is characterized by a period of high rainfall, the nitrate concentration extremely rose up in all wells as recorded from the result. Figures 11 and 12 verify this fluctuation in nitrate concentration between both seasons, specifically in the central portion of the studied basin with high agriculture activity (Table 7). This condition refers to several main factors such as rising up the water table in the wet season and vise versa for dry season and secondly, the impact of human activity is significant in wet season specifically using chemical contaminants (nitrate) for agriculture purpose. Finally rainfall plays an important role to transport nitrate based on specific condition of vulnerability properties of ground strata and land use type. Consequently, these considerable variations in nitrate concentration from dry to wet seasons verify the susceptibility of this modification. Therefore, the combination of standard DRASTIC and LULC index maps is the most appropriate method to apply in this basin.
CONCLUSION
Both standard and modified DRASTIC index model applied in GIS environment to assess the potential vulnerability of groundwater contamination in the Halabja Saidsadiq basin. Even though the DRASTIC method regularly affords acceptable results in the assessment of intrinsic vulnerability of groundwater to pollution but it might be difficult to consider the result as an accurate risk assessment ofthe groundwater. Two different scene of landsat Thematic Mapper (TM) had been used to prepare LULC map. Images consist of seven spectral bands with cell size (30x30 m) for Bands 1 to 5 and 7. ERDASIMAGINE software was used to prepare digital image classification of the study basin.
Figure 11. Modified DRASTIC model with nitrate Figure 12. Modified DRASTIC model with nitrate concentration (dry season). concentration (wet season).
Table 7. Nitrate concentration in both dry and wet seasons at each Vulnerability class.
Vulnerability category Land use Class
Nitrate Concentration (mg/l)
Dry season Wet Season
V.Low Mostly barren land
N.A N.A
Low Mostly barren with low barren
land < 7
Mostly < 20
Medium Mostly agricultural land
>10 >30
High Mostly agriculture with low
barren land >10
>30
V.High Mostly agricultural land
>10 >30
Supervised classification for level I of USGS done with band combination RGB / 742 for image covered basin. The LULC map demonstrates that only five classes can be recognized including barren land, agricultural land, vegetation, urban area and wet land or water body. Each class has specific rate and weight value based on its impact environmentally as explained in table (5). Seven parameter maps were developed in a GIS environment to generate standard models and one parameter (LULC) is added to modify it. The DRASTIC vulnerability index values ranged between 63 and 191, 88 and 221 for standard and modified respectively.
The vulnerability zones are given in Table 8. It can be noted that, standard DRASTIC model clarify only four vulnerability classes comprises (very low to high) while the modified one comprises five classes from very low to very high vulnerability zones. The highly vulnerable areas constitute 43.42% of the basin and mostly are located in the central and north western of Halabja Saidsadiq basin with land use type of agriculture and barren land. This percent was only 5% before modification. The effect of agriculture activity clearly seen on the modified DRASTIC model compared to standard one, as the agriculture land plays a significant role to convert the moderate vulnerability zone in the central and north west parts to high vulnerability zone. In addition both barren with agriculture lands are the main factors to rise up very low vulnerability zone to low vulnerability in the north east and south east of the Halabja Saidsadiq basin.
Nitrate concentration of groundwater was evaluated for validation of the modified DRASTIC results where 30 groundwater samples have been analyzed for nitrate in two different seasons. The result of nitrate concentration in dry season (just above 10 mg/l) considerably lower than in wet season ( more than 30 mg/l). This result confirms that nitrate as a chemical pollutant how rapidly rises up from October 2014 to June 2015. This variation is referring to the impact of human activity such as agriculture and hydrogeological with vulnerability properties of ground strata. Therefore, the combination of standard DRASTIC and LULC index maps is the most appropriate method to be applied in this basin based on the nitrate transmission.
Table 8. Result of DRASTIC index ratio for standard and modified maps. Vulnerability class Standard rate % Modified rate % Very low 34 1.17 Low 13 36.82 Medium 48 17.57 High 5 43.42 Very high ---1.02
ACKNOWLEDGMENTS
The authors would like to thank Professors R. Alkhaddar of Liverpool JM University and M. Alshawi of Salford University and Kadhum Almuqdadi of the Arab Academy in Denmark for their fruitful suggestions and discussions.
REFERENCES
Anderson, James R., et al. (1976). A Land Use And Land Cover Classification System For Use with Remote Sensor Data: Geological Survey Professional Paper 964. Edited by NJDEP, OIRM, BGIA, 1998, 2000, 2001, 2002, 2005.
Aller L., Bennett T., Lehr J. H., Petty RH, and Hackett G. (1987). DRASTIC: a standardized system for evaluating groundwater pollution potential using hydrogeologic setting. USEPA report 600/2-87/035, Robert S. Kerr Environmental Research Laboratory, Ada, Oklahoma74820, 252 p.
Allen R. G., Pereira L. S., Raes D, and Smith M.(2006): Crop evapotranspiration , Guidelines for computing crop water requirements - FAO Irrigation and drainage paper No. 56, P.23.
Ali S. S. (2007). Geology and hydrogeology of Sharazoor - Piramagroon basin in Sulaimani area, northeastern Iraq. Unpublished PhD thesis, Faculty of Mining and Geology, University of Belgrade, Serbia. 317P.
Al-Rawabdeh, Abdulla M, Nadhir A. Al-Ansari, Ahmed A. Al-Taani, Fadi L. Al-Khateeb, Sven Knutsson.(2014). Modeling the Risk of Groundwater Contamination using Modified DRASTIC and GIS in Amman-Zerqa Basin, Jordan. Cent. Eur. J. Eng. • 4(3) • 2014 • 264-280 DOI: 10.2478/s13531-013-0163-0.
Al-Rawabdeh, A., Al-Ansari, N.A., Al-Taani, A. and Knutsson, S., 2013, A GIS-based DRASTIC model for assessing aquifer vulnerability in Amman-Zerqa groundwater basin, Jordan, J. Engineering, V.5,490-504 Bellen R.C., Dunnington H.V., Wetzel R., and Morton D. (1959). Lexique Stratigraphique International. Asie,
Iraq. Vol. 3C, 10a, 333p.
Buday T.( 1980). Regional Geology of Iraq: Vol. 1, Stratigraphy, I.I. Kassab and S.Z. Jassim (Eds) D. G. Geo Survey. Min. Invest. Publication. 445p.
Buday T., and Jassim S.(1987) The Regional geology of Iraq: Tectonis, Magmatism, and metamorphism. I.I. Kassab and M.J. Abbas (Eds), Baghdad, 445 p.
Berding F. (2003). Agro-ecological zoning of the three northern governorates of Iraq, FAO Agricultural Rehabilitation Programme. Plant production SS, Erbil, Iraq.
Baziany M.M.Q.(2006). Stratigraphy and sedimentology of former Qulqula Conglomerate Formation, Kurdistan region, NE- Iraq. Msc thesis, Sulaimani University, 98p.
Baziany M.M.Q. and Karim K. H. (2007). A new concept for the origin of accumulated conglomerates, previously known as Qulqula Conglomerate Formation at Avroman- Halabja area, NE-Iraq., Iraqi Bulletin of Geology and Mining, Vol.3, No.2, 33-41.
Bety A.K.S. (2013). Urban Geomorphology of Sulaimani City, Using Remote Sensing and GIS Techniques, Kurdistan Region, Iraq. Unpublished PhD thesis, Faculty of Science and Science Education, University of Sulaimani, . P.125.
Cihlar, J. R. E. Kennedy, P. A. Townsend, J. E. Gross, W. Cohen, P. Bolsrad, and Wang T. (2001). “Remote sensing change detection tools for natural resource managers: Understanding concepts and tradeoffs in the design of landscape monitoring projects,” Remote Sensing of Environment, vol. 113 (7), 2009, pp. 1382-1396.
Evans, B. M., & Mayers, W. L. (1990): A GIS-based approach to evaluating regional groundwater pollution potential with DRASTIC. Journal of Soil and Water Conservation, 45, 242–245.
Fritch, T. G., McKnight, C. L., Yelderman Jr, J. C., & Arnold, J. G. (2000). An aquifer vulnerability assessment of the paluxy aquifer, central Texas, USA, using GIS and a modified DRASTIC approach. Environmental Management, 25, 337–345.
FAO Representation in Iraq (2001). Reconnaissance soil map of the three northern. governorates, Iraq. Map Scale =1:1000,000. Erbil Sub-Office.
Hernandez L. R., Bravo J. A, and Mejuo M. F. (2004). Map of vulnerability to groundwater contamination. Excelentisima Diputacion Provincial de Alicante, Espana. A-1029-2004.Cited in Hamamin D.F. (2011). Hydrogeological assessment and groundwater vulnerability map of Basara Basin, Sulaimani Governorate, Iraq, Kurdistan Region. Unpublished PhD thesis, College of Science, University of Sulaimani. 174P.
Hamamin D.F. (2011). Hydrogeological assessment and groundwater vulnerability map of Basara Basin, Sulaimani Governorate, Iraq, Kurdistan Region. Unpublished PhD thesis, College of Science, University of Sulaimani. 174P.
Huang T, Pang Z, Edmunds W. (2012). Soil profile evolution following land-use change: Implications for groundwater quantity and quality. Hydrol. Process 27(8):1238-1252.
340p.
Jwan Al-doski, Shattri B. Mansor and Helmi Zulhaidi Mohd Shafri. (2013). Monitoring Land Cover Changes in Halabja City, Iraq. International Journal of Sensor and Related Networks (IJSRN) Volume 1,Issue1 , February 2013.
Knox, R. C., Sabatini, D. A., & Canter, L. W. (1993): Subsurface transport and fate processes. USA: Lewis Publishers
Lee S. (2003). Evaluation of waste disposal site using the DRASTIC system in southern Korea. Environmental Geology 44: 654-664.
Meyer W. B. and Turner B. L. (1992). “Human population growth and global land-use/cover change,” Annual Review Ecology and Systematics, vol. 23, 1992, pp. 39-61.
Merchant G. (1994). GIS-based groundwater pollution hazard assessment: a critical review of the DRASTC model, Photogramm Eng Remote Sensing 60, 1994, 1117-1127.
Mas J. F. (1999). "Monitoring land-cover changes: a comparison of change detection techniques," Int. J. Remote Sens., Vol. 20, pp. 139-152, 1999.
Mehta V. K., Walter, M. T., and DeGloria, D. S. (2006). A simple water balance model. Cornell University, technical report No.5, 9p.
Piscopo, G. (2001): Groundwater vulnerability map, explanatory notes, Castlereagh Catchment, NSW. Department of Land and Water Conservation, Australia, Found at:
http://www.dlwc.nsw.gov.au/care/water/groundwater/reports/pdfs/castlereagh_map_notes.pdf .
Plymale, C.L. and Angle, M.P. (2002). Groundwater pollution potential of Fulton County, Ohio. Groundwater pollution potential, report 45. Columbus, OH: Ohio Department of Natural Resources Division of Water, Water Resources Section.
Rundquist, D., Peters, A., Liping. D., Rodekohr, D., Ehrman, R., Murray, G. (1991). State-wide groundwater vulnerability assessment in Nebraska using the DRASTIC/GIS model. Geo Cartography International, Vol. 6, P. 51–58.
Secunda S., Collin M. and Melloul A. J.(1998). Groundwater Vulnerability Assessment Using a Composite Model Combining DRASTIC with Extensive Land Use in Israel’s Sharon Region, Journal of Environmental Management 54(1), 1998, 39-57.
Statistical Directorate in Sulaimaniyah (2014). Achieve Department.
ADDRESS FOR CORRESPONDENCE Nadhir A. Al-Ansari
Department of Civil, Environmental and Natural Resources Engineering Lulea University of Technology
Lulea, Sweden