Teknik och samhälle
Datavetenskap och medieteknik
Examensarbete
15 högskolepoäng, grundnivåHow can machine learning help identify cheating
behaviours in physical activity-based mobile
applications?
Hur kan maskininlärning hjälpa till att
identifiera fuskbeteenden i rörelsebaserade mobila applikationer?
Elina Kock
Yamma Sarwari
Examen: Kandidatexamen 180 hp Handledare: Nancy Russo
Huvudområde: Datavetenskap Examinator: José Font
Program: Systemutvecklare
Sammanfattning
Den här studien undersöker möjligheten att använda sig utav Human Activity Recognition (HAR) i ett mobilspel, Bamblup, som använder sig utav fysiska rörelser för att upptäcka om en spelare fuskar eller om denne verkligen utför den verkliga aktiviteten. Sensordata från en accelerometer och ett gyroskop i en iPhone 7 användes för att samla data från olika människor som utförde ett antal aktiviteter utav intresse. Aktiviteterna som är utav intresse är hopp, knäböj, stampa och deras fuskmotsvarigheter, fuskhopp, fuskknäböj och fuskstampa.
En sekventiell modell skapades med hjälp av det öppna programvarubiblioteket, TensorFlow. Feature Selection gjordes i programmet WEKA (Waikato Environment for Knowledge Analysis), för att välja ut attributen som var mest relevanta för klassificeringen. Dessa attribut användes för att träna modellen i TensorFlow, vilken gav en klassificeringsprecision på 66%. Fuskaktiviteterna klassificerades relativt bra, och det gjorde även stampaktiviteten. Hopp och knäböj hade lägst klassificeringsprecision med 21.43% respektive 28.57%. Dessutom testades Random Forest klassificeraren i WEKA på vårt dataset med 10-delad korsvalidering, vilket gav en klassifieringsnoggranhet på 90.47%. Våra resultat tyder på att maskininlärning är en stark kandidat för att hjälpa till att identifiera fuskbeteenden inom fysisk aktivitetsbaserade mobilspel.
Abstract
This study investigates the possibility to use machine learning for Human Activity Recognition (HAR) in Bamblup, a physical activity-based game for smartphones, in order to detect whether a player is cheating or is indeed performing the required activity. Sensor data from an accelerometer and a gyroscope from an iPhone 7 was used to gather data from various people performing a set of activities. The activities of interest are jumping, squatting, stomping, and their cheating counterparts, fake jumping, fake squatting, and fake stomping.
A Sequential model was created using the free open-source library TensorFlow. Feature Selection was performed using the program WEKA (Waikato Environment for Knowledge Analysis), to select the attributes which provided the most information gain. These attributes were subsequently used to train the model in TensorFlow, which gave a classification accuracy of 66%. The fake activities were classified relatively well, and so was the stomping activity. Jumping and squatting had the lowest accuracy of 21.43% and 28.57% respectively. Additionally, the Random Forest classifier in WEKA was tested on the dataset using 10-fold cross validation, providing a classification accuracy of 90.47%. Our findings imply that machine learning is a strong candidate for aiding in the detection of cheating behaviours in mobile physical activity-based games.
Table of Contents
1. Introduction 1 1.1 Research questions 2 2. Related Work 2 2.1 Choice of sensors 2 2.2 Sensor placement 3 2.3 Classifiers 32.4 TensorFlow and Deep Neural Networks 4 2.5 HAR and cheating in physical activity-based games 5
2.6 Contributions of this paper 6
3. Method 7 3.1 Data Collection 9 3.2 Feature Extraction 11 3.3 Data Preprocessing 12 3.4 Model design 14 3.5 Feature Selection 16 4. Data Analysis 17
4.1 Exploratory Data Analysis (EDA) 18
4.1.1 Activity variation between test subjects 19 4.1.2 Differences between real/fake activity sensor readings 21 4.1.3 Timespan for distinguishable instances of activities 23
5. Results 24
5.1 Version 1: incomplete dataset, no proper train-test split and no proper feature selection 25 5.2 Version 2: complete dataset, proper train-test split but no proper feature selection 25 5.3 Version 3: complete dataset, proper train-test split and a proper feature selection 27
5.4 Using Random Forest in WEKA 28
6. Discussion 30
6.1 Dataset 30
6.2 Sequential model 31
6.2.1 Fake activities classified most accurately 31 6.2.2 False positives of predicted labels and their implications 33 6.2.3 Activities confused with each other 33
6.3 Random Forest 34
6.3.1 Comparison with Sequential model 34
6.3.2 Future work with WEKA 35
6.4 Implications for Bamblup and mobile physical activity-based games 35
6.5 Future work 36
7. Conclusion 37
8. Acknowledgements 38
1. Introduction
In today’s society smartphones are extensively used by many people in the world. Smartphones are convenient tools for everyday activities, entertainment, and much more. The sophisticated sensors found in these devices have been found to be extremely valuable for several applications, human activity recognition (HAR, the study of recognizing human activities through various technologies) being one of them. This is indicated by the extensive research done within the area using smartphone sensors, e.g. Ghosh and Riccardi [1], Yin et al. [2], Wannenburg and Malekian [3], Ahmed et al. [4], Hussein et al. [5], Mishra et al. [6]. Something that goes hand-in-hand with human activity recognition is physical exercise. Humans are less physically active than before, and some of the reasons stated by the World Health Organization (WHO) are “high-density traffic, fear of violence or crime in outdoor areas, lack of park recreation facilities“ [7]. Inadequate physical activity has been linked to several health issues, e.g. diabetes [8]. On the contrary, regular physical activity can, among other things, reduce the risk of several diseases and improve functional health [8]. Additionally, children increasingly live a sedentary lifestyle [9], which can lead to child obesity. Child obesity is a global problem and “one of the most serious public health challenges of the 21st century” [10]. To battle this phenomenon, several physical activity-based games (e.g. Pokémon Go) and technologies (e.g. Xbox Kinect and Wii Sports) have been developed. Physical activity-based games are sometimes referred to as “exergames”, e.g. [11]. In this paper, these kinds of games will henceforth be referred to as physical activity-based games. It has been shown that gamification can help children and young adults be more active by providing motivation for physical activity [12]. Pokémon Go is a well-known example of how gamification motivated millions of people to get outside and be physically active, albeit the activity required for Pokémon Go (walking) is less vigorous than the movements investigated in this paper.
The possibility to cheat in physical activity-based games demotivates play as intended [13] and is a fairly common phenomenon both in games and non-gamified physical activity-based applications [13, 14, 15]. Cheating in a physical activity-based game can come in a variety of forms. A common way to cheat is to shake the phone in order to fool the game that the player is moving [13]. Several reasons for cheating in physical activity-based games have been found. Some of the reasons that cheating appears in physical activity-based games is when players want others to notice them doing well, i.e. if the application contains a leaderboard. Another reason is that players want to play without moving or that they want to efficiently collect items [14].
Bamblup is a game developed by the company First & Ten to motivate its 1 players to be more physically active and to improve their physical and mental well-being. While playing the game, the player might encounter different enemies
or obstacles that can be overcome by performing one or some of the physical activities jumping, squatting, or stomping. Beating the obstacles grants the player different rewards, one of these being the in-game currency. Bamblup’s own activity recognition is not reliable and does not use machine learning, and so, the developers of the game suggested Bamblup be the focus of this thesis. Therefore, this paper investigates how machine learning can be utilized to detect whether a player is actually performing the intended physical activity of a physical activity-based application, or if the player is simply pretending to perform the activity. The activities investigated are jumping, squatting, and stomping along with their fake counterparts fake jumping, fake squatting, and fake stomping.
1.1 Research questions
The main points investigated in this paper will be the following two questions.
● How can machine learning help identify cheating behaviours in physical activity-based mobile applications?
● How well can we classify physical exercise activities using only sensor data?
The rest of this paper is organised as follows: The next section presents previous research that has been done within the field of human activity recognition; section 3 describes how this work is structured, and details how data was collected for this research; section 4 shows how the data was visualized and interpreted; section 5 presents the findings of this study while section 6 discusses their implications and mentions what needs to be done as future work. Lastly, Section 7 concludes this paper.
2. Related Work
Human activity recognition using machine learning has been widely studied. However, most existing works focus on everyday activities such as walking, standing, sitting, running, going upstairs or downstairs, etc. [3, 16, 17, 18]. As many studies investigate these same activities, most of them are able to focus on improving the accuracy and perfecting the models that already exist. Very few works, e.g. [11, 19], aim to investigate how more vigorous activities such as jumping or squatting can be recognized. Therefore the research gap filled by this paper will be the investigation of recognizing more vigorous activities than previously studied, and how a machine learning model can be used for cheat detection in physical activity-based games for smartphones.
2.1 Choice of sensors
In the research of human activity recognition, several combinations of sensors have been used. Examples of sensor combinations are: Accelerometer only [3, 18]; accelerometer and gyroscope [2, 16]; accelerometer, gyroscope, and
magnetometer [20, 21]; tri-axial accelerometer, linear accelerometer, gyroscope, and orientation sensors [22]; accelerometer, gyroscope, visible light, barometer, magnetometer [11]. Research has even been conducted on how audio signals can aid in the accuracy of HAR [1], but that is outside the scope of this paper. However, a majority of previously conducted HAR research has utilized the accelerometer in combination with the gyroscope.
2.2 Sensor placement
The accuracy of HAR depends on the sensor placement. Some examples of sensor placements that have been investigated include:
● the smartphone in the user’s pant pocket or shirt pocket (some papers do not specify which kind of pocket they used) with accuracies between 91% - 99% [3, 20, 22, 23, 24]
● the smartphone in the user’s backpack or in the user’s hand while the user is texting with an accuracy of approximately 96% [20]
● the smartphone on the user’s waist with accuracies between 90% - 98% [5, 6, 23]
● the smartphone in a stationary position with an accuracy of approximately 85% [2].
Researchers have found that sensor locations closer to the body provide a higher accuracy for running, walking, jumping, throwing, and hopping [11]. Another study by Nurwanto et al. has experimented with human activity recognition for three activities, sit-ups, push-ups and squat-jumps, by combining the accelerometer sensors from both a smartwatch and a smartphone, where the phone is attached to a strap around the upper arm and the watch is strapped to the wrist [25]. The study by Nurwanto et al. found a recognition accuracy of 76.67% for push-ups, 80% for sit-ups, and 96.67% for squat-jumping.
2.3 Classifiers
WEKA (Waikato Environment for Knowledge Analysis) is a program developed by2 the University of Waikato containing various tools, algorithms and different classifiers for machine learning. One of these classifiers is the Random Forest classifier. This classifier creates randomly pathed decision-trees for supervised learning.
Previous research has found success in human activity recognition with accuracies ranging between approximately 74% [26, 27] to as high as 99% [3]. Studies conducted in the past have had outstanding results using the Random Forest classifier for human activity recognition, e.g. Hussein et al. [5] with a 98.05% accuracy, Almeida and Alves [19] with a 99% accuracy, and Li et al. [17] with a 99.8% accuracy. Other classifiers that have been widely used and/or tested in previous research are:
● J48 Decision Tree, e.g. [2, 3, 11, 22, 27]
● Support Vector Machine, e.g. [3, 18, 22, 24] ● Naive Bayes, e.g. [2, 3, 22, 26]
● k-Nearest-Neighbors, e.g. [3, 6, 16, 24] ● Logistic regression, e.g. [3, 11, 18, 27]
● Multilayer perceptron (MLP), e.g. [3, 11, 22, 27]
Wannenburg and Malekian [3] found that one single classifier does not work as a general solution for all human activity recognition, but that different classifiers work well for the recognition of different activities. This is further strengthened by the findings of Ahmed et al. [4] who found that different sliding window sizes (batch size of iteration of data input to a model) are optimal for different activities. Furthermore, Almeida and Alves [19] found that in order to satisfactorily classify the movements “move left” and “move right”, a sub-classifier within their main classifier had to be used. Upon detection of sideways movements the main system invoked the sub-classifier which would then classify whether the movement was “move left” or “move right”. The results from the study by Nurwanto et al. [25] showed that for the model to accurately predict a performed activity, the entire length of the activity had to be recorded, i.e. if the recorded activity is a sit-up, it has to be recorded from start to finish. If the recording starts from somewhere in the midst of the sit-up, the prediction will not be as accurate.
2.4 TensorFlow and Deep Neural Networks
TensorFlow is an open source library developed by Google for machine learning3 development. It provides functions for creating and utilizing custom machine learning models. The advantage of using TensorFlow over WEKA is the amount of control over the neurons, making it so that the weights in the neural network can be adjusted to improve the performance of the model. This is not possible in WEKA. Neither is it possible to port a model created by WEKA for usage in an iOS device, something which is possible by creating a model in TensorFlow.
TensorFlow was used by Mishra et al. [6] to create a deep neural network classifier for HAR on a publicly available data set. They found out that using a deep neural network (DNN) gives better results for HAR when compared to other methods, e.g. a k-Nearest-Neighbors model. A DNN is a machine learning model which consists of several hidden layers. Some examples of a DNN are:
● Convolutional neural network (CNN): mainly used for image recognition but is also usable for any data which must be used in a specific order (just like the pixels of an image) [20]. When working with a CNN, one downsamples the input data (just like pixelating/blurring an image) by using a technique called max pooling . What max pooling does is that it 4 moves a two-dimensional vector across the dataset and changes each datapoint in its center based on the data points in proximity to it, either by summarizing the values or by choosing the greatest value.
3 https://www.tensorflow.org/ [Accessed: 4 June 2020]
● Multilayer Perceptron (MLP): used for classification problems where a specific input can be matched to a specific output out of some sets of outputs. An example is inputting a set of recorded sensor data which was created by jumping where the MLP can classify the data as either jumping or squatting. In short, MLPs consist of an input and output layer, 1 or more hidden layers, and are used for supervised machine learning [22]. ● Recurrent Neural Network (RNN): used to process unsegmented data (data
without a predefined input shape), e.g. language recognition, or time series prediction. RNNs use a kind of “memory” which helps them classify, predict, or cluster some input data based on previously received data [28]. RNNs are usable with both supervised and unsupervised machine learning.
Zhu et al. [20] propose a framework for HAR in which the utilize CNN in order to better be able to differentiate between activities which are often confused with each other in HAR, namely going up/downstairs, running, walking, standing, bicycling, swinging. They achieve a 96% accuracy in their study.
In studies conducted previously it has been found that multilayer perceptron can yield high accuracies when dealing with human activity recognition [26]. Wannenburg and Malekian found that MLP is more accurate at predicting “slightly more complex activities such as jogging and stair climbing” [3]. On the other hand, Zainudin et al. [27] found that MLP shows good results but not for complex activities when using data from a single sensor. Furthermore, Yin et al. [22] state that MLP takes the longest time out of J48, SVM, Naive Bayes, and MLP to build a model, making it not optimal for use in smartphone applications. However, Jablonsky et al. [11] found in their study that MLP gave an accuracy of around 92% when dealing with the activities running, walking, jumping, throwing, and hopping.
RNN has also been previously utilized within the field of HAR, by for example Pienaar and Malekian [29], Damodaran and Schäfer [30], Hernández et al. [28], and Wang et al. [31]. Pienaar and Malekian [29] attempt to use an RNN to classify activities from a public dataset and get an accuracy of > 94%, whereas Damodaran et al. [30] compare RNN with SVM for recognizing human activities with wifi signals and raw data and find that SVM outperforms RNN. Hernández et al. [28] get a 92.67% accuracy for HAR when using RNN on data recorded with a smartphone. Wang et. al. [32] found that using a personalized RNN (PerRNN) on the same dataset used by Pienaar and Malekian, they received a classification accuracy of 96.44% without extracting any features.
2.5 HAR and cheating in physical activity-based games
One area where activity recognition is used is in physical activity-based games in order to detect whether the user is performing the required activity, e.g. making
the correct dance move in Xbox Kinect’s Dance Central . Research shows that 5 players of mobile physical activity-based games cheat in various creative ways, e.g. using step-simulators in a game called Walkr, GPS-hacking, or frantically shaking the device in an upwards and downwards motion to replicate the physical activities required by the physical activity-based game [13]. It has been found that cheating in games is quite prevalent. Seventy-six percent (76%) of respondents to a survey carried out by Gal-Oz and Zuckerman [15] admitted to cheating in online games. Additionally, another survey carried out by Lee and Lim [13] found that most respondents admitted to cheating in physical activity-based games. The respondents of [13] additionally explained how and why they cheated, with some of the reasons for cheating being to achieve goals which seemed too tough to achieve fairly, or an inability to progress in the game. Paay et al. [14] also received responses from respondents of why they chose to cheat in Pokémon Go. Some reasons given by respondents to [14] were:
- A feeling of inequality inherent to the game’s design, e.g. less items in rural places such as in Pokémon Go.
- Wanting to play without moving, for various reasons. - Efficiency of item collection.
- Increasing game pace.
- Exploring limits of technology, e.g. GPS spoofing.
As shown above, it has been found regarding cheating in games that it comes in various forms. Paay et al. [14] found that cheating also comes with various opinions thereof. What some people consider legit play, others may consider cheating [14]. This distinction is out of the scope for this paper and will not be considered. This paper simply focuses on the mechanics of recognizing physical exercise activities with the use of machine learning.
2.6 Contributions of this paper
Based on findings in previous works where researchers have had success in using machine learning to identify everyday human activities, this work will bridge the research gap that exists for HAR and physical exercise, namely, recognizing more vigorous activities than previously studied. Additionally, this work will fill the research gap regarding how machine learning can be used for cheat detection in physical activity-based games for smartphones. Furthermore, this work investigates a new orientation for the smartphone during data collection, namely holding the phone in landscape mode at shoulder height extended from the body with slightly bent arms (see fig. 1 ). This position is used during this study, with the reason being that this is the position Bamblup is played in. The position also contributes with a previously uninvestigated phone orientation within HAR. Thus, this work will contribute with new knowledge within the field of human activity recognition regarding physical exercise.
fig. 1 The starting position of a test subject recording data for this research.
3. Method
The research method chosen for this study was design and creation [33] because a model had to be created in order to achieve the goal of cheat detection through machine learning in Bamblup. This model was iteratively adjusted and evaluated until the desired result was met. The approach to this study can be grouped into some different steps. At first in the planning phase it was decided what data should be collected (we chose accelerometer and gyroscope data) based on research discussed in section 2 and based on the wishes of Bamblup stakeholders. It was also decided on what format the data should be in, in order to ensure that it was as structured as possible from the beginning. Later on, an application was developed with the sole purpose of recording and storing data in the format which was decided upon. When the application was ready, data was collected according to convenience sampling. Data was collected by letting voluntary test subjects perform the activities of interest according to the instructions given by the researchers. The data was preprocessed and put into a single file. The chosen features were then extracted by the application, and feature selection was performed using WEKA.
Simultaneous to data collection, we began developing a deep neural network in TensorFlow using the Sequential class (sometimes referred to as the Sequential 6 model). Because Bamblup only supports iOS, our model had to be portable to iOS. Models created in TensorFlow can easily be ported to iOS, whereas models created in WEKA cannot. However, in addition to the deep neural network created in TensorFlow, a model was created in WEKA using WEKA’s Random Forest classifier and was also tested on the dataset using 10-fold cross validation. This Random Forest model was created to verify that the predictions initially made by the Sequential model in TensorFlow were inaccurate because the Sequential model itself needed tweaking, and not because the dataset was insufficient. The second reason for creating a Random Forest model using WEKA was to see how it would compare to our deep neural network created in TensorFlow. Random Forest was chosen for this purpose because studies previously conducted within HAR have had high classification accuracies using Random Forest, so it was a good reference point. Some examples of studies with high HAR accuracies are Hussein et al. [5] with a 98.05% accuracy, Almeida and Alves [19] with a 99% accuracy, and Li et al. [17] with a 99.8% accuracy. The reasoning behind using TensorFlow and WEKA for this study was that they are both open source software. As mentioned above, models created in TensorFlow are easily portable to iOS making it the perfect option for the purpose of this study which uses Bamblup as a point of reference because Bamblup only supports iOS. WEKA’s feature selection tool is an easy and effective way to compare the features of the dataset to each other in order to find which features are the most valuable for the model. The fact that TensorFlow and WEKA have also been used in several other studies, e.g. [6, 22, 27] indicates that they are established tools within the field of HAR.
In the end the Sequential model was tested on previously unseen data to evaluate its performance. These steps are described in detail in the subsections of this section. See fig. 2 for a description of the workflow.
6 https://www.tensorflow.org/api_docs/python/tf/keras/Sequential [Accessed: 6 June
fig. 2 Flowchart of the workflow applied in this research.
3.1 Data Collection
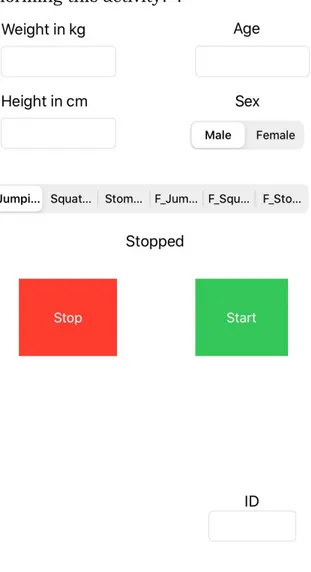
For the gathering of data from the accelerometer and the gyroscope, an application (see fig. 3 ) was developed for the operating system iOS version 13 using Swift 5.0. The application provides an interface for beginning and stopping the recording of sensor data, choosing which activity is being performed, and input fields for personal physical data such as weight, height, sex, and age. Additionally, an input field for an ID is provided by the application. The ID was filled in by the researchers to be able to separate the various test subjects. No actual names of the individuals providing the data are saved in the application or in the dataset in order to preserve the integrity and privacy of the test subjects. That is also partly why this research bases activity recognition on sensors instead of on video recordings, as video based HAR comes with a greater invasion of privacy [17]. Apple’s Core Motion framework was used for retrieving the raw 7 data values from the built-in sensors of the iPhone 7 that was used for data collection. The reason for using an iPhone and not an Android compatible device is because Bamblup, the game which this research is tied to, currently only supports iOS compatible devices.
The six activities that are of interest are: ● Jumping ● Squatting ● Stomping ● Fake Jumping ● Fake Squatting ● Fake Stomping
Three of the activities are labeled as “fake”. This is where the test subject is performing physical motions or manipulating the phone in their own way in order to attempt to simulate the activity in an attempt to cheat. Before each test subject began performing activities they were told about Bamblup. Therefore, the way the instructions for these fake activities were given to the test subjects was “How would you move the phone if you were trying to trick the game into thinking you were performing this activity?”.
fig. 3 The user interface of the application that was used for data collection
For the data collection itself, a number of test subjects were asked to perform the six aforementioned activities while holding the phone in the same way it is to be held while playing the game. Each person thus performed each of the 6 various activities. 12 test subjects were used for this study, wherein 10 were men and 2 were women. All test subjects but one are people who spend a considerable amount of time sitting in front of a computer either for work or for personal entertainment. A few of them regularly (one or more times per week) visit the gym. Ages ranged between 18-38, heights ranged between 160-197 cm, and weights ranged between 60-116 kg. Due to the Corona outbreak, which took place during the timespan of the study, it was more difficult than expected to find willing test subjects. Therefore, some persons provided data twice each. Three people provided data twice, one of which was a female test subject. This means that in total there were 15 separate data entries of 6 activities each. Although that means the same person’s data is sometimes present multiple times in the dataset, we argue that one does not perform the activities exactly the same every time. We further argue that despite the duplicate persons, more data enriches the dataset. Further countermeasures that were taken to reduce bias of the duplicates included the persons using different intervals than the first time while performing the aforementioned activities. They were told not to use the same fake movements as the first, but still never received any instructions on how to perform them. Additionally, as to not confuse the model with similar data, we decided to use the data from the same person in either only testing or only training.
3.2 Feature Extraction
To extract features from the iPhone sensor data, the class CMDeviceMotion of 8 the CoreMotion framework was used. This class provides “Encapsulated 9 measurements of the attitude, rotation rate, and acceleration of a device.” fig 4 shows the variables returned by an instance of CMDeviceMotion.
fig. 4 The information received from the sensor data.
Aside from the data extracted from CMDeviceMotion, some personal data was collected for each test subject. Namely, their weight in kilograms, height in centimeters, age, and sex. The reason these features were also collected was because the initial idea was to find out if there was any correlation between the activities performed and the physique of a person. This idea was however not implemented, and as such, these features are not used in the machine learning model. Instead, they are used during data analysis. The reason they are not used in the model is that Bamblup does not require its users to enter such data, and 8 https://developer.apple.com/documentation/coremotion/cmdevicemotion [Accessed: 3
June 2020]
thus it would be unfitting for a model created for Bamblup to require such features. Therefore, the goal of our model is to identify an activity regardless of a player’s physique. However, if our dataset is to be used in any future work these features may freely be used.
Several previous studies in the field extract and make use of statistical features such as mean, max, and standard deviation in their feature sets, e.g. [4, 22]. This is to increase the accuracy of their classification. Studies which have previously investigated squatting and jumping, two of the three activities of interest in this study, have utilised statistical features [11, 19], although one study [25] does not utilize such features. Due to the fact that this study explores activities which have previously not been extensively investigated we wanted to see how well these activities would be classified using only the sensor data without additional features.
3.3 Data Preprocessing
The first step was to remove noise at the start and end of each recorded activity, as there naturally is an undesirable time gap between pressing start on the smartphone application and beginning to perform the activity in question. Some of the gathered data was plotted using the python library matplotlib to get a general idea of how long this noise period was. It was determined that removing 2 seconds at the start of each file would be sufficient, as the curve of each activity seemed fairly stable after that point. See fig. 5 and fig. 6 below for an example of the difference between the raw data and the processed data. As the sampling rate was 50Hz, removing 2 seconds of data meant removing 100 rows of data. This reduced the collected data for each activity from 1500 rows to 1400 rows.
The smartphone application was designed in such a way that data recording automatically stopped after 30 seconds. However, no timer was presented for the test subject to see how long they had been performing the activity. This means that the test subjects never had to press the stop button even though it was there. This in turn means that there was no noise at the end of the recorded data, because the test subject kept performing the activity all the way until the end. Thus, the time gap between stopping the activity and stopping the recording did not exist in the way that it did at the start. It can be clearly seen in fig. 5 and
fig. 6 that there is no determining difference in the measurements taken at the very end of each file and anywhere in the middle, as the subject was unaware of when exactly the recording would stop.
fig. 5 Raw sensor data for stomping
fig. 6 Processed sensor data for stomping
The raw data extracted from the smartphone sensors have varying ranges. Having data with a large variance in ranges decreases the performance of the model [34]. For machine learning, having the data normalized makes it easier for the model to add weights. This is because all the data is then within the same range, meaning that one feature will not exaggeratedly affect the outcome [34].
The data was therefore normalized to a range between 0 and 1 using the min-max normalization method, see equation 1. Additionally, the data was rounded to 4 decimals as these contain the significant digits.
(1)
N =
N − N
minN
max− N
minAs in [3], each of the individually saved activity sets were appended to create a single file containing one large data set which was used to feed both training and test data into the model. Because the activities investigated are different and because every person performs them differently it was impossible to choose a perfect window size which would perfectly suit all data. One person might perform a squat in the same duration that another person would have performed three jumps, and yet another person might have performed one and a half squat during that time interval. For this reason, the chosen window size was set to 200 data rows, which is approximately four seconds. This made sure that the batch size was large enough to hold enough data to represent each performed activity regardless of who performed it. For example, if one squat took 2 seconds to perform and another took 3.5 seconds, our batch size was large enough to capture both squats in their entirety. The overlap was set to 50% in order to make up for what might have been lost at the edges of each window.
Lastly, the data was split into a training and a test set where 80% of the data was used for training and 20% for testing. This means that the data from 12 people (the duplicates are counted as two separate people here) were used for the training data, and 3 people were used for the test data. Furthermore, 20% of the training set was used for validation. This split is performed by TensorFlow in the fit-method of the Sequential class based on the parameter “validation_split”.
3.4 Model design
Our Sequential model is a Multilayer Perceptron (MLP) deep neural network created with the Sequential class in TensorFlow 2.0 using Python 3.7. It consists of 9 hidden dense layers with 100 neurons each and all with the relu activation function. The input layer takes a vector of data in the shape 200x9 as its input. The output layer is preceded by one Flatten-layer and the output layer itself is a dense layer with 6 neurons (one neuron for each possible output, namely jumping, fake jumping, stomping, fake stomping, squatting, fake squatting) and softmax as its activation function because we are dealing with a classification problem. The loss function used in the model was a categorical crossentropy, and the optimizer function was using the Adam algorithm. The model outputs its predictions as a vector with 6 floating point numbers that together add up to 1 (100%). Those numbers represent the percentage of certainty the model has that the input data is that of each activity. For example, if the activities are listed to the model in the order
● fake jumping ● fake squatting
● fake stomping ● jumping ● squatting ● stomping
and the model outputs “[0.1, 0.2, 0.6, 0.03, 0.03, 0.03]”, it means that the model is 60% certain the input data represents the third activity which, looking at the order of activities listed above, is fake stomping.
The training data was fed into the model 200 rows at a time with a 100 step distance, meaning that the first training sample was rows 1-200, the second training sample was rows 100-300, the third was 200-400 etc. That means there is a 50% overlap in the data between the samples. This was chosen to make as much use of the data as possible without making training samples too similar to each other (e.g. if there had been a 90% overlap), and to make sure that all data had a chance to occur at various positions in a training sample. The model was trained using 12 epochs after some trial and error experiments in order to optimize the ration between overfitting and accuracy.
As mentioned previously in section 2.4, Mishra et. al. [6] found more accurate results for HAR using a deep neural network for classification. This is the main reason for using a deep neural network in our study. We chose to use a Sequential model because it was the most suitable out of the available choices in TensorFlow. TensorFlow offers the following three choices:
● Sequential: allows you to create a model and control each layer, but does not allow advanced options such as multiple in- or outputs.
● Functional : allows you to work with models in a more advanced way10 than sequential, e.g. multiple in- or outputs or shared layers.
● Model subclassing : allows you to create and fully customize a model. 11
The reason for using an MLP instead of other suitable options, such as a CNN (suitable for data which comes in a certain order, e.g. pixels in an image or time series) or an RNN (suitable for time series data such as ours), is that an MLP, given its simplicity, is a good starting point for creating a DNN. Because we introduce new activities to be classified using machine learning, we opt to create an as basic as possible starting point. It is for the same reason that we have chosen to not include any statistical features in our dataset. Although an MLP model takes a long time to build, the advantages of using a Multilayer Perceptron is that it connects a specific input to a specific output. MLP is also often used for supervised machine learning.
10 https://www.tensorflow.org/guide/keras/functional [Accessed: 6 June 2020]
11 https://www.tensorflow.org/guide/keras/custom_layers_and_models [Accessed: 6
3.5 Feature Selection
The features selected from CMDeviceMotion were the ones provided by the accelerometer and gyroscope. These were userAcceleration (accelerometer), gravity (accelerometer), rotationRate (gyroscope), and attitude (gyroscope). Each of these objects contain three values. Three of them, userAcceleration, gravity, and rotationRate, contain X, Y and Z values, whereas attitude contains pitch, roll, and yaw. This means that there were 12 sensor features in total, 6 from each sensor. See Table 1 for an overview of the names this study uses for each sensor data value.
Table 1: Overview of the different sensors and the name for each value retrieved CMDeviceMotion
sensor data Sensor Name used in this study userAcceleration x Accelerometer acc_x userAcceleration y Accelerometer acc_y userAcceleration z Accelerometer acc_z gravity x Accelerometer grav_x gravity y Accelerometer grav_y gravity z Accelerometer grav_z rotationRate x Gyroscope rotation_x rotationRate y Gyroscope rotation_y rotationRate z Gyroscope rotation_z attitude pitch Gyroscope pitch
attitude roll Gyroscope roll attitude yaw Gyroscope yaw
The reason that these values were chosen over the values from the other sensors present in the iPhone is due to the recommendations and preferences of Bamblup stakeholders. Additionally, most of the research within this field has successfully utilized the accelerometer and gyroscope, either together or separately, although the gyroscope is usually not used on its own. Some examples are Wannenburg and Malekian [3], Hung et al. [18], Yin et al. [2], Astriani et al. [16]. These are substantial indications that a combination of accelerometer and gyroscope is a solid basis for human activity recognition. Zhu et al. also stressed that it is important to consider the energy consumption of the
smartphone during HAR [23], as constantly using the sensors consumes battery power. In addition to this, Bamblup already consumes a lot of energy resources. Therefore we have opted to use the minimum amount of resources possible while still maintaining reasonable results, meaning accelerometer and gyroscope are a satisfactory choice of sensors for this study.
Feature selection was performed using WEKA’s attribute selection to determine which attributes provided the most information gain, and WEKA determined that the features with the highest information gain were, in the following order: yaw, acc_x, rotation_z, rotation_y, grav_z, roll, rotation_x, acc_y, acc_z, pitch, grav_y, grav_x. This, however, does not mean that all features used together would provide satisfactory results. Therefore, WEKA’s attribute selection was subsequently used to determine which subset of these features would yield the best results. According to WEKA, the most valuable subset of these features were: yaw, acc_x, rotation_z, rotation_y, grav_z, rotation_x, acc_y, acc_z, pitch. When this subset was tested with the deep neural network in TensorFlow (the Sequential model) overfitting immediately decreased as accuracy increased. Overfitting means that the model gets high accuracy on training data because it memorizes the data, but that new data would be poorly classified. Ultimately, the selected features that we decided to move forward with were the ones in the subset that WEKA determined suitable.
4. Data Analysis
Exploratory data analysis was chosen as an approach to analyze the collected data for this research. The data analysis was performed in order to gain a greater understanding of the dataset. The main investigation points during the data analysis were whether it was possible to distinguish encapsulated instances of the activities (e.g. one jump, one squat, one stomp), and how similar/different to each other the sensor readings for the various activities looked. Because this work was made for Bamblup, real-time activity recognition had to be continuously kept in mind. Therefore, it was important to know approximately how many seconds an encapsulated instance of each activity lasted. This was also estimated from the graphs. The data analysis was performed by analyzing plots of the sensor readings for each activity in order to find patterns relating to the activities. Additionally, we looked for distinct aspects of each kind of activity. Such patterns or aspects were for example distinguishable individual jumps or squats. Individual stomps are arguably difficult to distinguish even if one is observing the activity being performed, because it is not clearly defined what encapsulates a stomp in the same clear way that a jump or a squat is encapsulated. This is true even for the way that some test subjects performed the fake activities where they would mimic the phone’s trajectory as during the real performance of the activity. Some test subjects on the other hand simply shook the phone during the recording of the fake activities.
4.1 Exploratory Data Analysis (EDA)
The dataset used in this study is neither qualitative nor quantitative. Therefore, approaches for analyzing qualitative or quantitative data were not suitable for this study. The dataset consists of a time series. Time series is data which is recorded over time, and must be used in the same order it was recorded for it to be meaningful. When analyzing a time series, drawing the data in a graph is a very easy and effective way to visualize patterns and/or changes in the data, which is exactly what exploratory data analysis does [35]. EDA also focuses a lot on observing statistical features of the data [35], but because we have decided to completely omit statistical features we also ignore that part of EDA.
Mishra et al. [6] show that activities which are “objectively, more physically demanding than others” will have a higher fluctuation in sensor readings than other, more passive activities. This coincides with the data collected for this study, as can be seen in the figures below, e.g. fig. 7, fig. 8. However, this also means that classification of our activities, jumping, stomping, squatting, and their fake counterparts, may be more difficult to correctly classify. That is because there are no non-vigorous activities within our dataset to separate them, and because they all yield similarly fluctuating sensor readings. It has been observed a number of times that activities similar to each other, such as going upstairs or downstairs, get confused with each other more easily than activities which are vastly different from each other, e.g. going upstairs and lying down [20, 24]. Therefore we hypothesize that our model will have a lower accuracy than models provided for HAR regarding everyday human activities which classify both vigorous and non-vigorous activities.
fig. 7 Different graphs describing the jumping activity for the person with the id 5.
fig. 8 Different graphs describing the jumping activity for the person with the id 16.
fig. 9 Different graphs describing the jumping activity for the person with the id 9.
4.1.1 Activity variation between test subjects
Because Bamblup is not a health application, but a game application, it does not provide instructions about at which interval activities should be performed. Therefore, we did not instruct the test subjects on how to ergonomically perform the said activity or on how fast each activity must be performed. This naturally led to a difference in how the various test subjects performed the activities. The
figures above (fig. 7, fig. 8, fig. 9 ) represent the jumping activity from three different persons. As observed from the graphs, it can be seen that different people perform the aforementioned activities differently. Looking at the acc_x value graph of each figure, it is observed that the interval between each jump varies depending on the person. For example, looking at acc_x in fig. 9 one can see a pattern which repeats roughly every 90 timestamps (1.8 seconds) at the start, and then declines to repeat once approximately every 120 timestamps (2.4 seconds). This declination in speed probably occurred because the test subject became tired more tired the longer they were jumping. In contrast, fig. 8 shows jumping being performed at a steady interval of roughly 25 timestamps (0.5 seconds) per jump, whereas fig. 7 shows jumping at an interval of approximately 20 timestamps (0.4 seconds) per jump.
Although the height and weight of a person might be similar, the results can still vary. Table 2 describes the height and weight of each test subject. Test subject 9 (fig. 9 ) weighs 108kg and is 187cm tall which is very similar to test subject 5 (fig. 7) who weighs 116kg and is 192cm tall. Yet, they jumped at very varying intervals from one another. On the contrary, test subject 16 (fig. 8 ) weighs only 82kg and is 183cm tall, but performed the activity more like test subject 5 (fig. 7 ) than test subject 9 (fig. 9).
Another factor for why the results vary, may be how the test subject interprets the given instructions and how much physical effort they choose to put into the activity. Due to this, our model must be capable of classifying these activities independent of whether they are performed slowly or fast. There is, naturally, a limit as to how large the interval between two instances of an activity can be to be considered acceptable by Bamblup, but that is out of the scope of this paper.
Table 2: Table for reference showing the height and weight of each test subject.
ID Height (cm) Weight (kg)
1 160 65 2 197 104 3 189 80 4 178 74 5 192 116 8 173 60 9 187 108 10 190 90 11 183 72 13 187 106 15 180 74 16 183 82 17 160 65 18 167 96 19 197 100
4.1.2 Differences between real/fake activity sensor readings
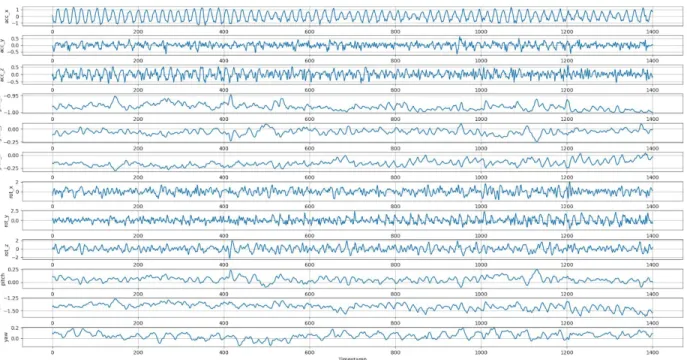
Figures 10 and 11 below show stomping and fake stomping as performed by two different test subjects. For details about what sensor values correspond to each Y-axis label, e.g. acc_x, see Table 1. By examining these figures it becomes clear that the sensor readings of the real activities end up being coarser and not as distinct as their fake counterparts. Looking at acc_x of stomping shows no meaningful difference to the naked eye, as the graphs for acc_x are very similar with the only clear difference being the range in which they are in. The acc_x value of real stomping is performed in the range -1 to 1, whereas the fake stomping acc_x ends up in a range between roughly -2.5 and 0.5. However, looking at the other remaining sensor values, acc_y through yaw, none of the readings in the real activity are as similar to their fake counterparts as acc_x. The largest difference in figures 10 and 11 can be seen on the yaw readings, where fake stomping has an almost flat curve and real stomping has a noticeably lively curve.
fig. 10 Stomping performed by the test subject with the id 17.
fig. 11 Fake stomping performed by the test subject with id 2.
Figures 12 and 13 show squatting and fake squatting as performed by yet another two test subjects. Similarly in figures 12 and 13 the sensor readings for actual squatting are generally much more rugged around the edges than the curves for fake squatting.
4.1.3 Timespan for distinguishable instances of activities
Although both figures show distinguishable individual squats in the acc_x curves, fig. 13 shows a clear grouping of squats in every sensor value except for acc_y, rot_x, and rot_z. For example, looking at acc_x of fig. 13 at timestamp 0-200 it can be seen that two squats are performed during this timespan, and that a third is started right before timestamp 200, at approximately timestamp 170. Looking further at the remaining sensor readings of fig. 13 and their curves, they mimic the pattern of acc_x’s distinct squats reasonably well, whereas the squats in fig. 12 are much less clear.
fig. 12 Squatting performed by the test subject with id 11.
fig. 13 Fake squatting performed by the test subject with id 13.
5. Results
The data set was, as previously mentioned, split into a training and a test set where 80% of the data was used for training and 20% for testing. From the training set, 20% of the data was used as a validation set. A validation set is used to minimize overfitting in a model without adjusting any of the weights, and to check how well the model performed during training. A test set is used to evaluate the performance of the model on previously unseen data. The test set is kept away from the model until it is finished in order to make sure that the results are not biased.
In sections 5.1 - 5.3 we describe the results of three different versions of our deep neural network (the Sequential model) created in TensorFlow. The versions are separated based on three factors: the state of the dataset, the state of the training-test split, and which feature subset was used. We regard version 3 as the final version of this study:
● Version 1: This version had an incomplete dataset, no proper train-test split and no proper feature selection.
● Version 2: This version had a complete dataset with a proper train-test split, but no proper feature selection.
● Version 3: This version had a complete dataset, a proper train-test split, and proper feature selection.
Section 5.4 describes the results produced by WEKA’s Random Forest classifier on our dataset. The results produced by Random Forest are completely separate from the results produced by the deep neural network.
5.1 Version 1: incomplete dataset, no proper train-test split and
no proper feature selection
Initially, our model showed an accuracy of approximately 52% on the test set and 79% on the validation set. At this point, the training-test split was not yet configured properly (as described in section 3.3). Instead, the training-test split for this version was approximately 70% for training and 30% for testing. Additionally, two of the persons used in the test set for this version of the model were people who had provided data samples twice, meaning they were present in both the training set and test set. Furthermore, this version of the model used the dataset when it contained data from only 14 people, meaning the dataset was incomplete. The subset of features determined for version 1 by WEKA’s attribute selection was: yaw, rotation_z, rotation_y, acc_x, grav_z, rotation_x, acc_y, grav_y. However, this selection of features was different from the selection of features used in version 3 of the model.
To summarize, this version of the model was built on an incomplete dataset, an improper training-test split, and an outdated selection of features. Its accuracy was approximately 52% on the test set. No confusion matrix was generated for this version of the model.
5.2 Version 2: complete dataset, proper train-test split but no
proper feature selection
Version 2 of the model was improved by adding more data to the dataset. As described in section 5.1, the dataset initially only contained data from 14 people, whereas the final version of the dataset contains data from 15 people. When the last of the data was added, we changed the training-test split of the model so that the data from duplicate people (explained in the final paragraph of section 3.3) would only be present in the training set. This was to avoid any classification bias which might occur by training and testing on the same person’s data. After these changes, the model was recompiled to a second version (version 2) and gave an accuracy of 60% on the test set. This is an improvement of 8% compared to version 1. The subset of features used for this model (version 2) was the same outdated feature subset as in version 1 (described in section 5.1), namely yaw, rotation_z, rotation_y, acc_x, grav_z, rotation_x, acc_y, grav_y.
fig. 14 Confusion matrix for an initial version of the model in TensorFlow.
Fig. 14 shows a confusion matrix of the results from the test set on version 2 of the model. It shows that fake jumping, fake squatting, fake stomping, and stomping were classified very well during testing. On the contrary, jumping and squatting were classified extremely poorly. Table 3 shows the accuracies of classification of each activity for version 2 of the model.
Table 3: Table showing the accuracy of each activity for an initial model version
Activity Classification accuracy
Fake jumping 76.92% Fake squatting 92.86% Fake stomping 100% Jumping 7.14% Squatting 0% Stomping 84.62%
To summarize, this version of the model used the completed dataset, a proper train-test split, but an outdated selection of features. Its overall accuracy was
60% and classified jumping and squatting extremely poorly, whereas it classified the other activities satisfactorily.
5.3 Version 3: complete dataset, proper train-test split and a
proper feature selection
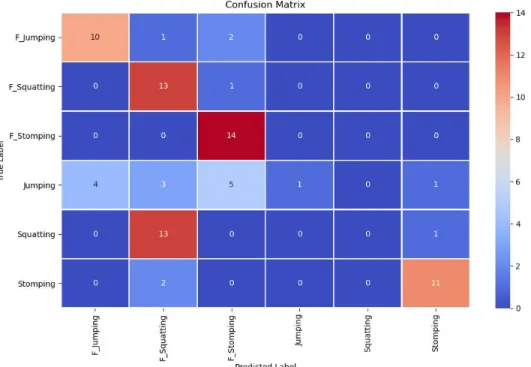
In the final version of the model, version 3, the dataset was complete, a proper training-test split had been made, and the subset of features was up to date according to the latest data. The accuracy of our final Sequential model in TensorFlow was 83.3% on the validation set and 66% on the test set. Out of 84 instances, 56 were classified correctly and 28 were classified incorrectly. This means that a total of 34% of the activities from the test set were classified incorrectly. The confusion matrix in fig. 15 shows how the model classified each activity during testing. Some activities are classified with high accuracy, while others are classified poorly. The results of the final model are similar to the results of version 2 in the sense that the fake activities and stomping are classified well, and jumping and squatting are classified poorly. As seen in Table 4, fake stomping was classified with a 100% accuracy and fake squatting was classified with a 92.86% accuracy. These two are the activities with the highest recognition rate. On the contrary, the two activities with the lowest accuracies are jumping and squatting. Jumping and squatting were classified with an accuracy of 21.43% and 28.57% respectively.
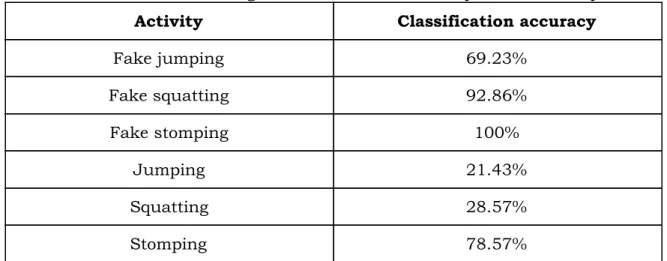
Table 4: Table showing the classification accuracy of each activity
Activity Classification accuracy
Fake jumping 69.23% Fake squatting 92.86% Fake stomping 100% Jumping 21.43% Squatting 28.57% Stomping 78.57%
To summarize, the final version of the Sequential model created in TensorFlow showed an accuracy of 66% during testing. This version of the model was created with a complete dataset, a proper train-test split of 80/20, and a proper selection of features.
5.4 Using Random Forest in WEKA
When the dataset was complete and an updated subset of features had been chosen, we ran WEKA’s Random Forest classifier on the dataset using 10-fold cross validation. Using 10-fold cross validation means that WEKA handles the train-validation split on its own, but it does not create a separate test set to use. Therefore, it is very important to note that the results presented here simply reflect the validation phase and do not reflect how the Random Forest model would perform on previously unseen data. The results using Random Forest are separate from the results presented in sections 5.1 - 5.3, and are presented in this section.
In fig. 16 , it can be seen that the dataset was split into 106400 total instances, or batches, of data. Additionally, fig. 16 shows that 90.47% of those instances were classified correctly and 9.53% were classified incorrectly.
fig. 17 Output from WEKA showing detailed statistics from the model
In fig. 17, the attributes are as follows:
● TP Rate (true positives) describes the rate of instances correctly classified [36].
● FP Rate (false positives) describes the rate of instances falsely classified [36].
● Precision is the ratio of instances that are positively of a class divided by the total instances classified as that class [36].
(2)
P =
(T P +F P )
T P
● Recall is synonymous with TP rate. See equation 3, where FN are false negatives, i.e. instances of one class incorrectly classified as another class [36].
(3)
R =
T P
(T P +F N)
● MCC is Matthews correlation coefficient [37]. See equation 4.
(4)
CC
M
=
T P T N−F P F N
*
*
√
(T P +F P )(T P +F N)(T N+F P )(T N+F N)
● ROC (receiver operating characteristics) are “is a measure of the usefulness of a test in general, where a greater area means a more useful test” [31]. A range between 0.9-1.0 is classified as very good [31].
● PRC (precision recall) area shows the fraction of true positives among positive predictions.
fig. 18 Output from WEKA showing the confusion matrix for classified instances
Figure 18 displays a confusion matrix generated by WEKA after the Random Forest classifier was run on the data. Table 5 presents the percentages of the results presented in fig. 18. The activities with the highest classification accuracy in Random Forest were squatting with 95.75% and fake stomping with 94.37%.
Table 5: Table showing the classification accuracy of each activity in WEKA
Activity Classification accuracy
Jumping 83.77% Squatting 95.75% Stomping 88.05% Fake Jumping 92.02% Fake Squatting 89.09% Fake Stomping 94.37%
6. Discussion
6.1 Dataset
Test subjects for the data collection were chosen according to convenience sampling, which means results might not be representative of the entire intended target audience of Bamblup, which consists of people between the ages of 15 to 99. As people grow older, their ability to perform physical activities decreases. Our results may be more biased toward a certain demographic, namely men in their twenties, as the majority of test subjects belong to that demographic. If the graph of the sensor data retrieved from a person that is 60 years old would be compared against a graph from a test subject in our dataset, the graph from the older person would likely have larger intervals between the activities.