February 2006
EDR 06-01
Department of Agricultural and Resource Economics, Fort Collins, CO 80523-1172
http://dare.colostate.edu/pubs
•
In 2002, 867 Colorado farm and ranch businessesin 59 counties derived some income from recrea-tional sources, contributing 13% to total farm income for producers, and a state total of well over $10 million (US Census of Agriculture).
•
In the U.S., a total of 106 rural counties had morethan 1,000 travel and tourism jobs in 2000, with some counties having as much as 90% of their total employment in the travel and tourism indus-try (many of these in Colorado).
•
Nationwide, 12% of recreation expendi-tures wentto land-owners in the form of leases or ownership of land for wildlife recreation, which translated to over $12 billion in 2001 and illustrates the broad economic impact of these tourism dollars for rural communities and rural landowners.
Agritourism is increasingly recognized as a means of enterprise diversification for agricultural producers, especially for its ability to increase cash flows to farm and ranch operations and in addition to their surround-ing communities. Lacksurround-ing a formal definition, agri-tourism can be summarized as anything that connects consumers with the heritage, natural resource or culi-nary experiences unique to the agricultural industry, or
a particular region of the country’s rural areas. The list of agritourism activities continues to grow, and includes a variety of participant, educational, and spec-tator experiences including: outdoor recreation
(fishing, hunting, wildlife photography, horseback rid-ing); educational experiences (farm and cannery tours, cooking classes, wine tasting, cattle drives, or help work the ranch); entertainment (harvest festivals or corn mazes); hospitality services (farm and ranch stays, guided tours or outfitter services); on-farm direct sales (u-pick operations or roadside stands); and, off-the-farm direct sales (farmers’ markets, county and state fairs, special events).
Still, most states are only beginning to give technical assistance and attention to the potential rural economic development opportunities that producers and commu-nities might consider.
The objectives of this fact sheet are to:
1) Draw the attention of economic and commu-nity development professionals to agritour-ism, given current revenues and potential growth in this sector, especially in the Inter-mountain West.
2) Summarize findings from research and out-reach projects assessing the relationships be-tween agritourism and other agricultural
AGRITOURISM: A POTENTIAL ECONOMIC DRIVER IN THE RURAL WEST
Joshua Wilson, Dawn Thilmany, and Martha Sullins 1
1
Graduate Research Assistant, Associate Professor and Coordinator, Cooperative Extension County Information Service in the Depart-ment of Agricultural and Resource Economics, Colorado State University.
objectives including conservation, value-added agriculture and community-oriented economic development.
Current Agritourism Activity and Trends
Much evidence points to tourism as a growing sector, with good potential for income generation in rural counties. According to a 2003 report by the Federal Reserve Bank of Kansas City, the travel and tourism industry has become increasingly important in the Tenth Federal Reserve District (Colorado, Kansas, Nebraska, Oklahoma, and Wyoming, plus the northern half of New Mexico and the western third of Missouri), contributing more to gross output than either agriculture or oil and gas extraction. Further-more, the basic travel and tourism industries accounted for 3.5% of total employment in the Tenth District in 2000 (approximately the same share as in the nation), but the industry has withstood the effects of the last two recessions much better in the Tenth District than in the rest of the nation due largely to decreased reliance on business and international travelers. A total of 106 rural counties had more than 1,000 travel and tourism jobs in 2000, with some counties having as much as 90 percent of their total employment in the travel and tourism industry (many of these in Colorado). The region’s three Rocky Mountain states—Colorado, New Mexico and Wyoming—are among the top ten states in the country in terms of their concentration of employ-ment in the basic travel and tourism industries. From the early 1980s to the late 1990s, the basic travel and tourism industries’ share of gross state product grew about 20 percent in Colorado.
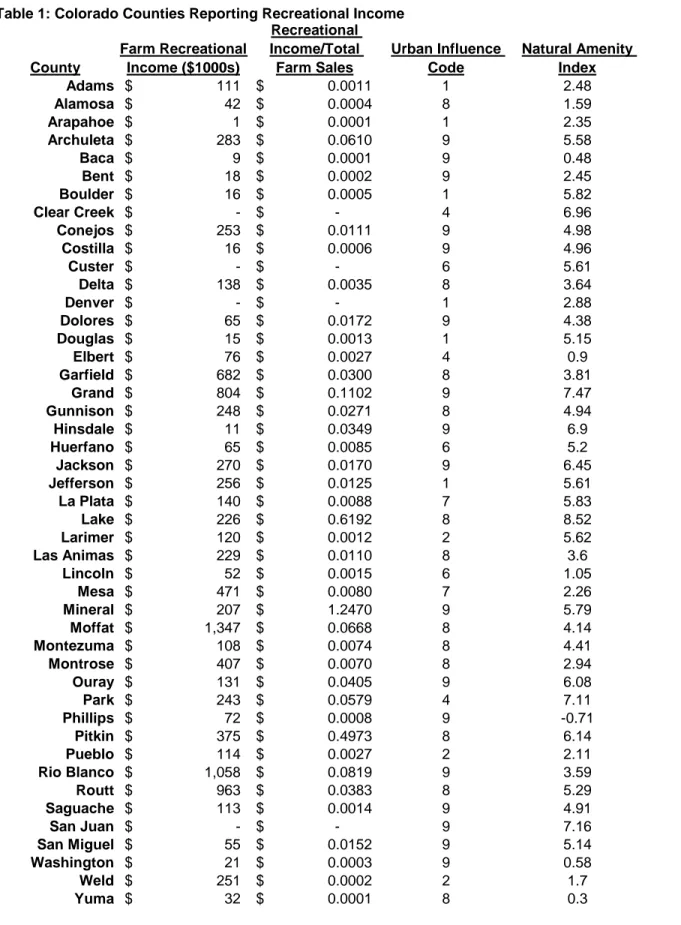
In 2002, 867 Colorado farm and ranch businesses in 59 counties derived some income from recreational sources, contributing 13% to total farm income for pro-ducers, and a state total of well over $10 million (US Census of Agriculture). While some counties contain only a few agritourism-based businesses, others have multiple enterprises, such as Rio Blanco (48), Weld (52), Routt (54), and Moffat (59), where the emphasis is primarily related to hunting and fishing on private agricultural lands. In addition, there are opportunities for expanding agritourism-related enterprises in many counties across the state, based on the presence of sig-nificant natural amenities or cultural/historical sites and events. Table 1 reports the recreational income status of Colorado counties as reported in the 2002 Census of Agriculture. Of the counties participating, 87% (42 out of 46 counties) report generating some
recreational income. A 2004 Colorado Division of Wildlife study, based on data from 2001, showed that in some rural Colorado counties, hunting and fishing alone have a great economic impact. For example, in Jackson County, more than 17 percent of all local jobs are directly or indirectly supported by hunting and fishing activities.
Nationwide, the United States Department of Agricul-ture (USDA) estimates that more than 62 million peo-ple age 16 years and older visited farms during a one-year period in 2000 and 2001 (USFS National Survey on Recreation and the Environment). This does not count the numerous children and youth under 16 years of age who visited farms during this same time period. One estimate suggests approximately 20 million chil-dren under the age of 16 also visited farms during the year, making the total number of visitors to farms approximately 82 million. This level of activity moti-vated the USDA to begin collecting statistics on agri-tourism revenues generated by farms in the 2002 Cen-sus of Agriculture. Table 2 lists the top 20 counties in the West by gross farm recreational income, with cor-responding natural amenity and urban influence values. The natural amenity scale measures the physical char-acteristics of a county that enhance its desirability as a place to live; environmental characteristics include topography, water, temperature and humidity (www.ers.usda.gov/Data/NaturalAmenities/). Like-wise, the urban influence code measures the influence of metropolitan forces, and is based on an increasing scale, meaning that the distance from urban regions is relatively greater for larger values. The information on natural amenities and degree of rurality shows the positive relationship between those variables and tour-ism. This correlation between agritourism and high amenity areas farther away from an urban interface motivated some recent research on agritourism poten-tial in the West.
Research on Conservation and Agritourism
Although a producer’s ability to supplement farm income by developing an agritourism enterprise is dependent on several factors, CSU conducted some research to determine whether high natural amenities and proximity to metro areas were relatively important factors in the potential success of agritourism opera-tions. This research focused on only the new agritour-ism data from USDA (targeted solely at wildlife-based agritourism) and only states west of the Great Plains.
Table 1: Colorado Counties Reporting Recreational Income County Farm Recreational Income ($1000s) Recreational Income/Total Farm Sales Urban Influence Code Natural Amenity Index Adams $ 111 $ 0.0011 1 2.48 Alamosa $ 42 $ 0.0004 8 1.59 Arapahoe $ 1 $ 0.0001 1 2.35 Archuleta $ 283 $ 0.0610 9 5.58 Baca $ 9 $ 0.0001 9 0.48 Bent $ 18 $ 0.0002 9 2.45 Boulder $ 16 $ 0.0005 1 5.82 Clear Creek $ - $ - 4 6.96 Conejos $ 253 $ 0.0111 9 4.98 Costilla $ 16 $ 0.0006 9 4.96 Custer $ - $ - 6 5.61 Delta $ 138 $ 0.0035 8 3.64 Denver $ - $ - 1 2.88 Dolores $ 65 $ 0.0172 9 4.38 Douglas $ 15 $ 0.0013 1 5.15 Elbert $ 76 $ 0.0027 4 0.9 Garfield $ 682 $ 0.0300 8 3.81 Grand $ 804 $ 0.1102 9 7.47 Gunnison $ 248 $ 0.0271 8 4.94 Hinsdale $ 11 $ 0.0349 9 6.9 Huerfano $ 65 $ 0.0085 6 5.2 Jackson $ 270 $ 0.0170 9 6.45 Jefferson $ 256 $ 0.0125 1 5.61 La Plata $ 140 $ 0.0088 7 5.83 Lake $ 226 $ 0.6192 8 8.52 Larimer $ 120 $ 0.0012 2 5.62 Las Animas $ 229 $ 0.0110 8 3.6 Lincoln $ 52 $ 0.0015 6 1.05 Mesa $ 471 $ 0.0080 7 2.26 Mineral $ 207 $ 1.2470 9 5.79 Moffat $ 1,347 $ 0.0668 8 4.14 Montezuma $ 108 $ 0.0074 8 4.41 Montrose $ 407 $ 0.0070 8 2.94 Ouray $ 131 $ 0.0405 9 6.08 Park $ 243 $ 0.0579 4 7.11 Phillips $ 72 $ 0.0008 9 -0.71 Pitkin $ 375 $ 0.4973 8 6.14 Pueblo $ 114 $ 0.0027 2 2.11 Rio Blanco $ 1,058 $ 0.0819 9 3.59 Routt $ 963 $ 0.0383 8 5.29 Saguache $ 113 $ 0.0014 9 4.91 San Juan $ - $ - 9 7.16 San Miguel $ 55 $ 0.0152 9 5.14 Washington $ 21 $ 0.0003 9 0.58 Weld $ 251 $ 0.0002 2 1.7 Yuma $ 32 $ 0.0001 8 0.3
Not surprisingly, natural amenities and urban influence were found to significantly affect recreational income at the county level. Counties with higher amenity val-ues are expected to have increased opportunities to expand recreational services, possibly leading to new income streams. The finding that more remote areas have also generated greater than average wildlife-
based agritourism revenues was more surprising, since proximity to urban areas may make visitation more convenient. Still, people demanding wildlife-oriented recreational activities appear to value the opportunity to “get away” from the hustle and bustle of metro life. In further analysis, the majority of counties outper-forming their expected revenue generation (according
Table 2: Top 20 Counties by Gross Farm Recreational Income
State and County
Farm Recreation Income ($1000) Recreation Income per Farm Value Urban Influence Code Natural Amenity Code Colorado\Moffat $ 1,347 $ 0.0032 8 4.14 Colorado\Rio Blanco $ 1,058 $ 0.0042 9 3.59 Colorado\Routt $ 963 $ 0.0011 8 5.29 Colorado\Grand $ 804 $ 0.0030 9 7.47 Arizona\Cochise $ 781 $ 0.0013 5 7.13 Colorado\Garfield $ 682 $ 0.0013 8 3.81 Wyoming\Johnson $ 597 $ 0.0010 8 2.78 Montana\Custer $ 558 $ 0.0015 8 -1.06 California\Humboldt $ 546 $ 0.0007 7 11.15
New Mexico\Rio Arriba $ 546 $ 0.0012 6 5.23
Wyoming\Campbell $ 514 $ 0.0010 7 0.79 Wyoming\Crook $ 503 $ 0.0009 9 2.57 California\Sonoma $ 474 $ 0.0001 1 7.93 Colorado\Mesa $ 471 $ 0.0009 7 2.26 Wyoming\Carbon $ 455 $ 0.0009 8 5.41 New Mexico\Catron $ 422 $ 0.0019 9 6.24 Colorado\Montrose $ 407 $ 0.0010 8 2.94 Washington\Spokane $ 393 $ 0.0003 2 1.33 Colorado\Pitkin $ 375 $ 0.0027 8 6.14 Montana\Park $ 371 $ 0.0006 8 3.61
Total Reported Recreational Income by State
$893 $5,344 $10,114 $337 $6,289 $422 $2,553 $2,656 $1,233 $1,999 $5,263 $-$2,000 $4,000 $6,000 $8,000 $10,000 $12,000 Ariz ona Calif ornia Colo rado Idah o Mon tana Neva da New Mex ico Oreg on Utah Wa shin gto n Wy omi ng R ec I n com e ($1000)
to statistical models) are located in the Rocky Moun-tain States—even after controlling for the influence of natural amenities and urban adjacency.
It is also important to understand the degree to which potential agritourism economic activity will benefit producers and their communities. A 2004 Kansas City Federal Reserve study published in the Main Street Economist stated that, nationally, more than half of all wildlife recreation dollars went to equipment pur-chases, while trip costs (food, lodging and transporta-tion) accounted for only 14% of hunting and 10% of wildlife-watching expenditures. Still, 12% of recrea-tion expenditures went to landowners in the form of leases or ownership of land for wildlife recreation, which translated to over $12 billion in 2001 and illus-trates the broad economic impact of these tourism dol-lars for rural communities and rural landowners. Another important force to consider is the motivation behind agriculture-based tourism. A 2001 USDA study investigated the reasons people made trips to farms (USFS National Survey on Recreation and the Environment). Responses included “enjoy rural scen-ery,” “learning where food comes from,” “visit family or friends,” “watch or participate in farm activities,” “purchase agricultural products,” “pick fruit or pro- duce,” “hunt or fish,” or “spend a night.” Responses are summarized in the table below. The reason most often given, by a total of 53 million respondents, was to “enjoy rural scenery.” “Learning where food comes from” and “visit family or friends” received the next highest numbers of responses with 44 million and 40 million respectively.
The study found that farm visitors traveled an average distance of 80 miles, and responses ranged from zero to 1,000 miles. Farm visitors reportedly spent an aver-age of $45 on the trip, including gas and other travel expenses, with all respondents’ trip costs ranging from zero to $450.
Implications for Rural Communities
Results from this study may be useful to rural commu-nities looking to improve current economic conditions through expanded recreational services revenue. Counties with higher amenity values and lower urban influence show great potential to continue to attract and likely grow wildlife-based recreational income. This is encouraging news for many rural counties, since the alternative economic development opportuni-ties for remote counopportuni-ties are generally more limited. As public lands open to hunting and fishing become scarcer and more crowded, and the number of house-holds with direct connections to farm operations decline, demand for recreational experiences on farms and ranches is likely to increase in the future. This market force points to agritourism as a potential eco-nomic driver for high-amenity, rural communities. In the long run, enhanced agritourism infrastructure may result in increased economic activity while decreasing producer reliance on agricultural returns and govern-ment support. However, agritourism enterprises require a very different set of managerial skills and human resources, which producers may not have at their disposal, and with which traditional outreach and advocacy groups (Cooperative Extension, farm
Reason for Trip Number of Responses*
(millions)
Percent of Respondents
Enjoy rural scenery 53 86
Learning where food comes from
44 71
Visit family or friends 40 63
Watch/participate in farm activities
41 64
Purchase agricultural products 27 39
Pick fruit or produce 27 43
To hunt and fish 16 27
Spend a night 19 8
*Sum of “important” and “somewhat important” responses.
organizations) may not yet be familiar. There are a growing number of initiatives emerging throughout the country which producers and their communities can draw on as they plan for new agritourism enterprises.
Links to Resources for Agritourism Development
Colorado Department of Agriculture
http://www.ag.state.co.us/mkt/agritourism/ tours.html
Agri-Business Council of Oregon
http://www.aglink.org/
Agricultural Marketing Resource Center
http://www.agmrc.org/
Agritourism in Focus: A Guide for Tennessee Farmers
http://cpa.utk.edu/level2/agri-tourism/training.htm
USDA National Agricultural Library Rural Informa-tion Center:
http://www.nal.usda.gov/ric/ricpubs/tourism.html
University of California, Davis Tourism Development Program
http://extension.ucdavis.edu/tourism/
Kansas Agritourism
http://www.kansasagritourism.org/
North Carolina Department of Agriculture and Con-sumer Services
http://www.ncagr.com/agritourism/index.htm
UC Davis Small Farm Center- Agricultural Tourism
http://www.sfc.ucdavis.edu/agritourism/ agritour.html
Agritourism World
http://www.agritourismworld.com/
British Columbia Agritourism
http://www.agritourismbc.org/
Mississippi Department of Agriculture and Commerce
http://msagritourism.org/
Kentucky Division of Agritourism
http://www.kyagr.com/mkt_promo/agritourism/ index.htm
NRCS Alternative Enterprises and Agritourism
http://www.nrcs.usda.gov/technical/RESS/ altenterprise/ http://www.nrcs.usda.gov/technical/RESS/ altenterprise/resmanual.html Farmstop.Com http://www.farmstop.com/aboutagritourism.asp References
Economic Research Service. 1999. Data: Natural Amenities Scale. www.ers.usda.gov/Data/ NaturalAmenities/.
Henderson, Jason. 2004. Wildlife Recreation: Rural America’s Newest Billion Dollar Industry. Main Street Economist, Center for the Study of Rural America, Federal Reserve Bank of Kansas City.
Ministry of Tourism. 2001. Travel Activities and Moti-vations Survey. Ontario, Canada. Available online at:
http://www.tourism.gov.on.ca/english/tourdiv/ research/reportshtm#TravelActivities
Pickton, Todd and Sikorowski, Linda. 2004. The Eco-nomic Impacts of Hunting, Fishing and Wildlife Watching in Colorado. Prepared for the Colorado Divi-sion of Wildlife by BBC Research & Consulting, Den-ver, Colorado.
USDA Forest Service, Interagency National Survey Consortium. National Survey on Recreation and the Environment (NRSE). 2000-2003. (rest of citations? U.S. Department of Agriculture. 2002. Census of Agri-culture. National Agricultural Statistics Service, Wash-ington, DC. Available online at: http://
www.nass.usda.gov/Census_of_Agriculture/index.asp
U.S. Fish and Wildlife Service. 2003 (revised). 2001 National Survey of Fishing, Hunting, and Wildlife-Associated Recreation: Colorado. U.S. Department of the Interior, Washington, DC.
Wilkerson, Chad. 2003. Travel and Tourism: An Over-looked Industry in the U.S. and Tenth District. Federal Reserve Bank of Kansas City, Third Quarter 2003 Eco-nomic Review.