DEGREE PROJECT, IN OPTIMIZATION AND SYSTEMS THEORY , SECOND LEVEL
STOCKHOLM, SWEDEN 2015
Integration of Production Scheduling
and Energy Management
SOFTWARE DEVELOPMENT
ABDERRAHMAN AIT ALI
KTH ROYAL INSTITUTE OF TECHNOLOGY
Integration of Production Scheduling
and Energy Management
Software Development
A B D E R R A H M A N A I T - A L I Master’s Thesis in Optimization and Systems Theory (30 ECTS credits) Master Programme in Computer Science and Engineering (300 credits)
Royal Institute of Technology year 2015 Supervisors at ABB Corporate Research Center, Tyskland, were Hubert Hadera and Lennart Merkert Supervisor at KTH was Anders Forsgren
Examiner was Anders Forsgren TRITA-MAT-E 2015:01 ISRN-KTH/MAT/E--15/01--SE
Royal Institute of Technology School of Engineering Sciences
KTH SCI
SE-100 44 Stockholm, Sweden URL: www.kth.se/sci
i Abstract:
Demand-Side Management concepts have the potential to positively impact the financial as well as the environmental aspects of energy-intensive industries. More specifically, they allow reducing the energy cost for the industrial plants by dealing with energy-availability fluctuations.
In this context, efficient frameworks for scheduling with energy awareness have been studied and showed potential to reduce the overall energy bill for energy-intensive industries, for instance stainless steel and paper plants. Those frameworks usually combine scheduling and energy optimization into one monolithic system. This work investigates the possibility of integrating the two systems by specific exchange of signals, while keeping the scheduling model separated from the energy-cost optimization model. Such integration means that the pre-existent schedulers and energy optimizers could be easily modified and reused without re-implementing the whole new system.
Two industrial problems with different scheduling approaches are studied. The first problem is about pulp and paper production which uses the Resource Task Network (RTN) scheduling approach. The second one is about stainless steel production which is based on a bi-level heuristic implementation of an improved energy-aware scheduler. This work presents the decomposition methods that are available in literature and their application to the two
industrial problems. Besides an improvement in the RTN approach for handling storages, this thesis describes a prototype implementation of the energy-aware RTN scheduler for paper and pulp production. Furthermore, this work investigates the performance of the application of different decomposition methods on different problem instances.
The numerical case studies show that even though the decomposition decreases the solution quality compared to the monolithic system, it still gives good solutions within an acceptable duration with the advantage of having two separate pre-existent systems which are simply exchanging signals.
Keywords: Pulp and paper production, stainless steel production, scheduling, energy-awareness, energy optimization, RTN, MILP, demand-side management, decomposition methods, prototype implementation.
ii
Table of Contents
List of Figures ... iv List of Tables ... v 1. Introduction ... 1 1.1.Background ... 1 1.2.Problem ... 11.3.Aim and Scope ... 2
1.4.Methodology ... 2
2. Problem Description ... 3
2.1.Pulp and Paper Production Process ... 3
2.2.Stainless Steel Production Process ... 4
2.3.Energy-cost Optimization ... 5
3. Literature Review ... 7
3.1.Resource Tasks Network (RTN) for Discrete Scheduling ... 7
3.2.General Monolithic Model ... 9
3.3.Primal Decomposition ... 10
3.4.Dual Decomposition... 12
3.5.Cross Decomposition ... 15
3.5.1.Mean-Value Cross Decomposition (MVCD) ... 16
3.5.2.Weighted Mean-Value Cross Decomposition (WMVCD) ... 16
3.5.3.One-sided Weighted Mean-Value Cross Decomposition (OWMVCD) ... 17
4. Mathematical Modeling ... 18
4.1.Basic Model for Pulp Production ... 18
4.1.1.Pre-existent Model ... 18
4.1.2.Simplified Model ... 19
4.2.Extended Model for Paper Production ... 21
4.2.1.RTN Superstructure and Excess Balance Equation ... 21
4.2.2.Processing Rates ... 21
4.2.3.Machines Start-up and Stop ... 22
4.2.4.Late Orders ... 23
4.2.5.Resource Storage ... 24
4.2.6.Paper Making Change-over ... 24
4.2.7.Energy Consumption ... 26
iii
4.3.Pre-existent Model for Stainless Steel Production ... 26
5. Energy Integration to Production Planning ... 29
5.1.1.Simple Decomposition Scheme for Pulp and Paper Production ... 29
5.1.2.Complex Decomposition Scheme – Stainless Steel Model ... 30
6. Prototype Software Development ... 32
6.1.Architecture Overview ... 32
6.2.Input Structure ... 33
6.3.Objects Representation... 33
6.4.Graphical User Interface (GUI) ... 34
7. Case Study ... 35
7.1.Setup and Input Data – Pulp and Paper Production ... 35
7.2.Results - Pulp and Paper Production ... 36
7.3.Setup and Input Data – Stainless Steel Production ... 38
7.4.Results – Stainless Steel Production ... 39
8. Concluding Remarks ... 42
8.1.Conclusions ... 42
8.2.Limitations ... 42
8.3.Future Work ... 43
Bibliography ... 44
Appendix 1 – RTN Superstructure of Paper Production ... 46
Appendix 2 – Bi-level Heuristic for Stainless Steel Problem ... 47
Appendix 3 – Decomposition Algorithms on Bi-level Heuristic... 48
iv
List of Figures
Figure 1 - Basic process of pulp production ... 3
Figure 2 - Extended process of paper and pulp production ... 4
Figure 3 - Stainless steel production process, from (Hadera, et al., 2014a) ... 5
Figure 4 - Energy sources and sinks, based on (Hadera, et al., 2014a) ... 6
Figure 5 – Consumption and production of resources by a processing task ... 7
Figure 6 – Continuous and discrete interactions in RTN superstructure ... 7
Figure 7- Primal block-angular structure of the monolithic problem ... 10
Figure 8 - Primal decomposition algorithm, based on (Hadera, 2015) ... 12
Figure 9 - Dual block-angular structure of the monolithic problem ... 12
Figure 10 - Dual decomposition algorithm, based on (Hadera, 2015) ... 14
Figure 11- Overview of the primal and dual decomposition methods... 15
Figure 12 - Cross decomposition algorithm, based on (Hadera, 2015) ... 15
Figure 13 – Improved cross decomposition algorithms, based on (Hadera, 2015) ... 17
Figure 14 – RTN Superstructure of the basic pulp production model (Hadera, et al., 2015) .. 18
Figure 15 – RTN Superstructure of the simplified basic model for pulp production ... 20
Figure 16 - Simple task-machine interaction with starting and stopping task ... 23
Figure 17 - Use of structural parameters for starting and stopping discrete tasks ... 23
Figure 18 - Change-over illustration in a production machine ... 24
Figure 19 - Capturing machine change-over using additional variables ... 25
Figure 20 - Example of RTN superstructure to capture change-overs ... 26
Figure 21 - Stainless production planning problem, based on (Hadera, et al., 2014a) ... 27
Figure 22 - Structure overview of the demonstrator software ... 32
Figure 23 - UML class diagram showing the overall objects representation ... 34
Figure 24 - Spot market hourly prices for energy cost (NordPoolSpot, 2014) ... 36
Figure 25 - Hourly day-ahead electricity prices for 24 hours (EPEX, 2013) ... 38
Figure 26 - Iteration history of the first decomposition approach on instance 2 ... 41
v
List of Tables
Table 1 - Basic real scenario (S0) for pulp and paper production ... 35
Table 2 - Case study scenarios for pulp and paper production ... 35
Table 3 - Numerical results of the monolithic model for different instances ... 37
Table 4 - Numerical results of the cross decomposition iterative method ... 37
Table 5 - Investigated problem instances for cross decomposition ... 38
Table 6 - Solution algorithms implemented for stainless steel production case study ... 39
Table 7 - Numerical results of the bi-level heuristic algorithm on the different instances ... 39
Table 8 - Numerical results of the decomposition for all levels of the bi-level heuristic with two different signal strategies ... 40
Table 9 - Numerical results of the decomposition for the upper-level of the bi-level heuristic with two different signal strategies ... 40
1
1. Introduction
This document is the final report for the Master Degree in Computer Science and Engineering at The Royal Institute of Technology in Stockholm (KTH) as well as for the Engineer
Diploma in Applied Mathematics and Computer Science at The Grenoble Institute of Technology in Grenoble (INPG).
This introductory chapter describes the professional and scientific context surrounding the degree project. The second chapter gives a description in more details of the industrial problems which are studied in this project. The literature review of the scientific researches and the theoretical tools related to the project are exposed and summarized in the third chapter. In the fourth chapter, the mathematical models are presented and explained whereas the prototype development is discussed in the following chapter. Finally, the case study is conducted to check the mathematical models in the sixth chapter before drawing several concluding remarks in the last chapter.
1.1. Background
The project is performed at ABB Corporate Research Center in Ladenburg, Germany. ABB is among the leading companies in power and automation technologies. It strives to increase the industrial productivity through its efficient products and breakthroughs in the domain of electrical power and automation combined with the care of lowering the environmental impact. The company is operating in power products and systems, discrete automation and motion, low voltage products and process automation. In addition to the research center of Ladenburg in Germany, ABB has six other research centers all over the world. Those research centers and their research teams are of paramount importance for the company to stay competitive as well as innovative against its main competitors (ABB, 2014).
The project was carried out between July 2014 and February 2015 in an ongoing research project within the research group of Process and Production Optimization, one of the eight research groups in ABB research center in Ladenburg.
1.2. Problem
In the last few years, world’s electric energy consumption (measured in watt-hours) has increased, especially in industry. Meanwhile, electricity volatility has increased due to the deployment of renewable energy generation, environmental concerns and shrinking of the conventional energy sources (Merkert, et al., 2014). Energy markets became liberalized and energy prices became subject to high fluctuations for the final consumers. In this case, production planning without awareness of these considerations may lead to expensive electricity bills at the user side. For this reason and within the concept of Demand-Side Management, integrating energy awareness into production planning for energy-intensive industries may have a noticeable potential in the future (Hadera, et al., 2014a).
Energy-cost optimizers and production planning solutions are available for energy-intensive industry and there are very efficient implementations of those systems that are the result of years of engineering and research. Thus, the idea is to integrate energy management and
2
production planning in a way that uses such pre-existent optimizers. Hence, the problem is to find an efficient iterative scheme between the energy optimizer and the production planner in order to get an integrated optimizer that could be used for real problem instances.
1.3. Aim and Scope
Decomposition methods are widely used to decompose optimization problems with special structure into sub-problems, either to increase model performance (lower computation times or better solution quality) or to represent desired problem structures. There are several methods that are proven to perform well for specific optimization problems. The aim of this study will be:
To model and expand pulp and paper production planning problem using the Resource Task Network (RTN) technique.
To explore different decomposition methods in literature: primal, dual and cross decomposition methods.
To apply cross decomposition methods to two different production planning problems (pulp and paper production and stainless steel production) using different iterative schemes for energy awareness.
To investigate the behavior of the decomposition algorithms on real world instances.
To draw useful conclusions for further work.
To implement a prototype software demonstrator for pulp and paper production. The study here will not aim to prove the theoretical properties of the decomposition methods. On the contrary, it will be restricted to a more algorithmic and numerical study of the
decomposition methods and the iterative schemes on the specific industrial problems.
1.4. Methodology
The two industrial problems which are studied here are based on mathematical programming and more precisely on large-scale Mixed Integer Linear Programming (MILP). One of the industrial problems (i.e. pulp and paper production) will be modeled and extended using the RTN techniques which lead to MILP problems. The decomposition of the energy-aware production planning will use Primal-Dual decomposition methods called cross decomposition methods. In order to study the cross decomposition methods applied to the industrial
problems considered here, the starting point is the monolithic model of each production problem which is simply the full problem in one mathematical optimization program. Setting the monolithic model will help to decompose the full problem into sub-problems and
therefore leads to the problem decomposition. The literature review will help to explore the way to construct efficient iterative schemes for the two production planning problems. To assess the implemented models, numerical case studies will be performed and will be discussed and analyzed in order to conclude with regard to the performance of the investigated cross decomposition methods.
3
2. Problem Description
Two industrial problems are explored in this project. One is about pulp and paper production and the other is about stainless-steel production. The main concern is to find an optimal (or close to optimal) production schedule by considering an effective scheduling of the
production processes and an optimal energy purchase strategy. The production plan has to take into account several production and energy-related constraints. Whereas the energy purchase has to consider different energy contracts as discussed later. In this chapter, the two production processes will be presented as well as the energy management component which is common between the two problems.
2.1. Pulp and Paper Production Process
The production process of paper starts with the preparation of raw material (wood, recycled paper, agricultural residues, etc.). The pulp is produced after several stages of mechanical or chemical pulping, pulp washing and screening. In thermo-mechanical pulping (TMP) which is considered here, the pulping technique uses the application of heat alongside the
mechanical refiners. Once the pulp is produced, it is fed to the storage tanks for additional chemical processing before being used in the paper machines. In order to add flexibility to the model, pulp can be bought from external sources. The basic process of pulp production is given in Figure 1.
Figure 1 - Basic process of pulp production
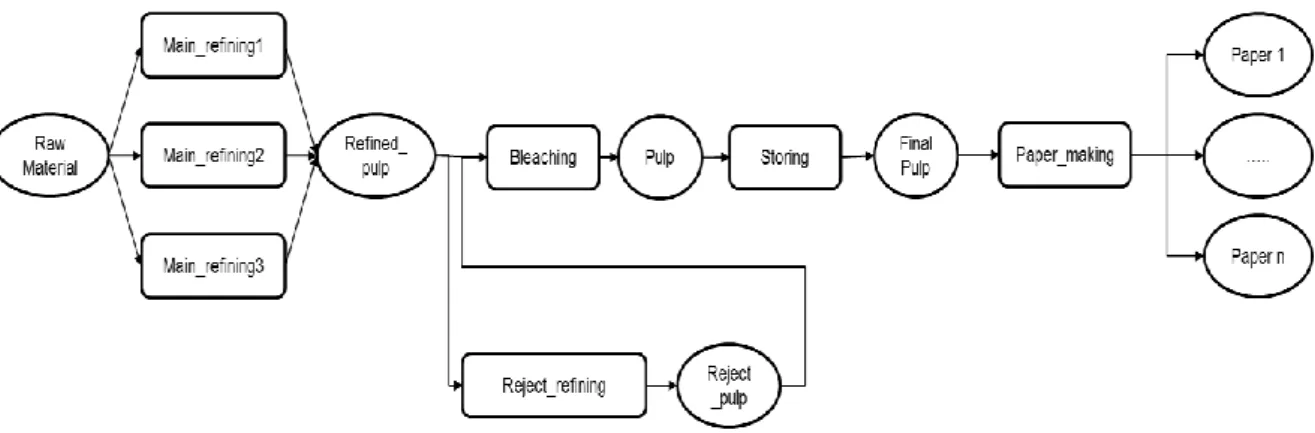
In the extended model, the basic stages have more details of the production. Certain amount of the main processed pulp is refined once again in the reject refiners and then used by the paper machines after the bleaching stage in order to produce rolls of paper. Finally, those paper rolls are cut into smaller rolls which form the final paper product (Bajpai, 2012). This cutting stage is not considered in the study, for interested readers this topic was treated by Harjunkoski (Harjunkoski, et al., 1996).
Figure 2 shows an overview of the paper production process which is considered in this study.
4
Figure 2 - Extended process of paper and pulp production
The extended production process has several stages, each of which contains parallel and identical machines. The process has many functional constraints which have to be satisfied. For instance, both refiners and paper machines have certain production rates which cannot be exceeded. Besides, there are other production details which are not represented in Figure 2. For example, steam is produced in the main refining stage and consumed in the paper making stage. Other properties and requirements will be discussed in more details in the next
chapters. To add more flexibility to the production process, steam can be bought from some external sources with given constant prices and with maximal buying capacity. Besides, all the necessary resources, such as woodchips, electricity, external pulp and steam are
considered unlimited.
It is important to mention that the extended process for paper production could be used as well for pulp production by considering the first stages which correspond to pulp production process. Practically, this could be done by fixing the allocations tasks and quantities of paper according to the demand of pulp and the production rates of the paper machines.
2.2. Stainless Steel Production Process
To produce stainless steel, the production starts with a scrap melting phase in an Electric Arc Furnace (EAF) which is a batch process that forms the heats. After a full heat is formed, it is transported to the second stage where the carbon in the molten steel is reduced. This is done in the phase of Argon Oxygen Decarburization (AOD). To adjust the final chemistry and temperature, the heat goes through the Ladle Furnace (LF) stage. The final stage is the Continuous-Casting (CC) stage where the heat is casted into slabs of stainless steel (Hadera, et al., 2014a).
5
Figure 3 - Stainless steel production process, from (Hadera, et al., 2014a)
The production process has four different stages and two parallel, non-identical machines at each stage. In addition, the industrial process has several functional constraints. For instance, all machines, except those in the CC stage, have machine-specific setup times. Moreover, the heat is subject to minimum transportation time and maximum waiting or hold-up time
between two production stages. Heats of the same heat group have to be casted subsequently without hold-up time. More details are described in (Hadera, et al., 2014a).
2.3. Energy-cost Optimization
In addition to the production constraints, there are numerous electricity considerations in the energy management side of the problem. Both processes (pulp and paper production or stainless steel production) have high energy consumption. For instance, 45 % of the total energy use in Sweden alone in 2011 was accounted for pulp and paper industry and 18 % for steel industry (Swedish Energy Agency, 2013b). Most of this energy is consumed in the EAF stage in the stainless steel production and by mechanical refiners used in TMP and by electric motors used in paper machines in pulp and paper production.
The energy demand of each stage should always be satisfied. Thus, for more effective energy management, several electricity sources are considered in order to satisfy the energy demand with lower costs. The purchasing contracts are as follows:
- Long-term or pre-agreed contract: The price is constant through the time horizon and generally low.
- Short term contract: Two price levels (peak and off-peak), one price level is low and the second one is generally higher.
- Spot market: Highly fluctuating prices with hourly variations. - On-site generation: The generation cost is constant.
For all the previous contracts, deviation penalties are considered if the energy purchase quantity is different by more than a given tolerance buffer from a given pre-agreed energy consumption. Besides, the purchased electricity is used to satisfy the production process demand and if there is an excess of energy, it has to be sold back to the power grid.
6
The electricity management process could be summarized in the following figure:
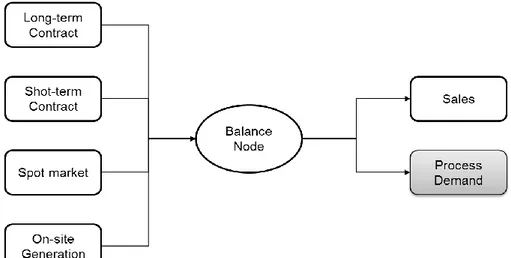
Figure 4 - Energy sources and sinks, based on (Hadera, et al., 2014a)
In Figure 4, the different energy contracts can be mathematically seen as sources of a certain flow (of energy) in a flow network problem, whereas the energy demand and the sales are considered as sinks. The balance node ensures the flow conservation between sources and sinks. Besides, each arc has a cost which helps formulate the energy cost objective function to minimize. Hence, the problem of energy management can be considered as a minimum-cost flow network optimization problem (Hadera, et al., 2014a).
7
3. Literature Review
3.1. Resource Tasks Network (RTN) for Discrete Scheduling
The Resource-Task Network (RTN) approach is a technique which has been recently widely used to model different scheduling problems. The technique was first presented in
(Pantelides, 1994) as an extension of the State-Task Network (STN). The logic behind the RTN approach is the use of a general mathematical scheduling formulation to model the consumption and production of resources by processing tasks. The resources quantities propagate through the scheduling time horizon after either consumption or production by some processing tasks. Thus, it is a unified framework for optimal planning and scheduling which regards all processes as bipartite graphs comprising two types of nodes: Resources and Tasks (Pantelides, 1994).
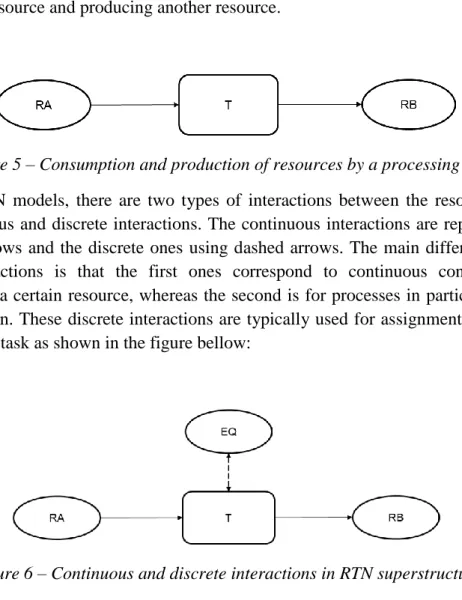
A structural diagram could be drawn to show all the different interactions between resources and tasks in the system, such a diagram is called RTN superstructure of the system. The resources are generally represented with circles and the tasks with rectangles. The following figure shows an example of the superstructure of a simple system in which a task is consuming a resource and producing another resource.
Figure 5 – Consumption and production of resources by a processing task
In general RTN models, there are two types of interactions between the resources and the tasks: continuous and discrete interactions. The continuous interactions are represented with continuous arrows and the discrete ones using dashed arrows. The main difference between the two interactions is that the first ones correspond to continuous consumptions or productions of a certain resource, whereas the second is for processes in particular points in the time horizon. These discrete interactions are typically used for assignment of equipment to a processing task as shown in the figure bellow:
8
The RTN scheduling approach can be formulated as a continuous or discrete problem. The latter problem was chosen to be used in the pulp and paper production problem. The main reason is that for large scales industrial problems, the RTN discrete scheduling showed generally better results compared to the continuous one (Castro, et al., 2009).
Once the time horizon was discretized uniformly, the strength of the RTN technique is in the compact Mixed Integer Linear Program (MILP) formulation of the scheduling problem. The most important equation in the mathematical formulation is the excess balance equation. Pantelides presented, in his original paper (Pantelides, 1994), a general form of the RTN excess balance equation as below:
∀𝑟 ∈ 𝑅𝑒𝑠𝑜𝑢𝑟𝑐𝑒𝑠 ∀𝑡 ∈ {1 … 𝑇} 𝑅𝑒(𝑟, 𝑡) = 𝑅𝑒(𝑟, 𝑡 − 1) + Π(𝑟, 𝑡) + ∑ ∑ 𝜆(𝑟, 𝑖, 𝜃)𝜉(𝑖, 𝑡 − 𝜃) + 𝜇(𝑟, 𝑖, 𝜃)𝑁(𝑖, 𝑡 − 𝜃) 𝜃∈τi 𝑖∈𝑇𝑎𝑠𝑘𝑠 (1)
Equation (1) describes the variations of the amount 𝑅𝑒(𝑟, 𝑡) of each resource through the scheduling time horizon 𝑡 ∈ {1 … 𝑇}. Hence, the amount of resource 𝑟 at time slot 𝑡 is the quantity of the same resource at time slot 𝑡 − 1 plus the variations (i.e. consumptions or productions) of the resource during the time slot 𝑡.The variations could be from the interactions with external systems, for instance: energy demand, product orders or material release. This is expressed in the equation with the term Π(𝑟, 𝑡). The variations of the resource quantities could also be related to the processing tasks within the system, this is expressed as a summation of all the variations by each processing task. In this summation the parameters 𝜆(𝑟, 𝑖, 𝜃) and 𝜇(𝑟, 𝑖, 𝜃) describe the nature of the interactions between the resource 𝑟 and the task 𝑖 (discrete or continuous, consumption or production). The integer index 𝜃 ∈ τi allows considering the variations over the length of the processing task 𝑖. The variables 𝜉(𝑖, 𝑡) and 𝑁(𝑖, 𝑡) represent, respectively, the amount that task 𝑖 processed and the state of the processing task during time slot 𝑡.
The excess balance equation describes how the resources are processed (i.e. consumed or produced) as well as how they propagate through the scheduling time horizon. Yet, this equation is not enough to fully describe the process. To complete the model, initial quantities of some resources are required. To do this, a parameter 𝑅0(𝑟) for each resource is typically used to set its initial quantity:
∀𝑟 ∈ 𝑅𝑒𝑠𝑜𝑢𝑟𝑐𝑒𝑠; 𝑅(𝑟, 𝑡 = 0) = 𝑅0(𝑟) (2) In order to set the processing capacities (minimal and maximal capacity) for certain production stages, the following constraint is generally used:
∀𝑖 ∈ 𝑇𝑎𝑠𝑘𝑠 ∀𝑡 ∈ {1 … 𝑇}; 𝐶𝑚𝑖𝑛𝑁(𝑖, 𝑡) ≤ 𝜉(𝑖, 𝑡) ≤ 𝐶𝑚𝑎𝑥𝑁(𝑖, 𝑡) (3) Those equations and constraints may be used in a slightly different form to adapt to certain specific industrial requirements of the scheduling process (Castro, et al., 2009). The objective function (make-span, production cost, etc.) can be mathematically expressed as a linear
9
combination of the RTN decision variables (i.e. 𝜉(𝑖, 𝑡) and 𝑁(𝑖, 𝑡)). Thus, the technique yields a compact MILP formulation for large scales production planning and scheduling problems (Pantelides, 1994).
3.2. General Monolithic Model
The integration of the scheduling model and the energy management model leads to a
monolithic model with two nested optimization problems: production planning problem (PP) and energy flow network problem (EFN). Production planning models with integrated energy management are generally modelled as the minimization of the following objective cost function
𝐹 = 𝐶𝐸𝐹𝑁𝑇 𝑓 + 𝐶
𝑃𝑃𝑇 𝑦 (4)
With respect to the functional constraints
𝐴𝐸𝐹𝑁𝑓 + 𝐷𝐸𝐹𝑁 𝑥 − 𝑏𝐸𝐹𝑁 ≤ 0 (5)
𝐴𝑃𝑃𝑦 + 𝐷𝑃𝑃𝑞 − 𝑏𝑃𝑃 ≤ 0 (6)
𝐴𝑓 − 𝐼𝑞 = 0 (7)
𝑓 ≥ 0; 𝑥 ∈ 𝑋; 𝑦 ∈ 𝑌; 𝑞 ≥ 0 (8)
The objective cost function (4) consists of the cost of the production planning – PP (production cost) and the cost of the flow network - EFN (energy purchase).
The inequality constraint (5) represents the functional constraints of the flow network or the energy management whereas (6) describes those of the production planning.
The equality constraint (7) links the production demand of electricity to the flow from the balance node to the process demand node as represented in Figure 4.
The inequalities and inclusions in (8) represent the bounds as well as the type (continuous or discrete) of variables.
Solving this problem means finding the minimal total cost 𝐹∗ with the corresponding optimal schedule and energy purchase strategy. It is important to note the linearity of all the
constraints and the objective function, thus the problem is linear. Moreover, the model has both continuous and discrete variables. Therefore, the general monolithic model is a Mixed Integer Linear Program (MILP).
MILP problems are a variant of Integer Linear Program (ILP) problems which are NP-hard problems. This means that the industrial models which are treated here do not have any polynomial solving algorithm (unless the famous equation NP=P is proven).
Adding the flow network problem into the scheduling problem makes the monolithic model more complex and even longer to solve (or at least to find a good solution) for real instances. Besides, it is easy to recognize the two different optimization problems that are linked with a simple constraint, i.e. consensus constraint (7). Moreover, there exist very efficient industrial
10
implementations to solve each of the two problems. Thus, it is desirable here to study the decomposition of this monolithic model into two well-known optimization models. In the next sections, several separation methods will be applied to find out the best scheme from those methods that will serve the industrial purpose of this separation.
3.3. Primal Decomposition
Primal decomposition is a method firstly introduced by Benders (Benders, 1962). The method was developed to solve large-scale linear programming problems but it is also used with mixed integer programming problems. Primal decomposition, also called Benders’ decomposition, uses the special structure of the linear programs in order to solve them efficiently. This special structure, called primal block-angular structure, is typically when the constraint matrix is in the following block-angular form:
Figure 7- Primal block-angular structure of the monolithic problem
This is the case basically when some constraints contain variables from different sub-problems. This is the case with the equality constraint (7) in the general monolithic formulation. The method divides a complex problem into two problems. One is called the primal sub-problem or Benders’ sub-problem which gives an upper bound (for minimization problems). The other one is the primal master problem which gives a lower bound. The method iterates between the two problems and reduces the gap between the bounds to find an optimal solution to the complex original monolithic problem.
In the general monolithic problem presented in the previous section, the complicating variable is the energy consumption 𝑞 which links the two sub-problems by the equality constraint (7). If 𝑞 is fixed, the original problem can be easily separated. After fixing the complicating variable (𝑞 = 𝑞̅ ≥ 0), we get the primal sub-problem as minimizing
𝐶𝐸𝐹𝑁𝑇 𝑓 + 𝐶
𝑃𝑃𝑇 𝑦 (9)
With respect to the constraints
𝐴𝐸𝐹𝑁𝑓 + 𝐷𝐸𝐹𝑁 𝑥 − 𝑏𝐸𝐹𝑁 ≤ 0 (10)
11
𝐴𝑓 − 𝐼𝑞̅ = 0 (12)
𝑓 ≥ 0; 𝑥 ∈ 𝑋; 𝑦 ∈ 𝑌 (13)
This sub-problem is clearly separable into two different optimization problems. The first problem is about finding an energy purchase strategy for the fixed energy consumption 𝑞̅ which has a minimal cost 𝐹𝐸𝐹𝑁(𝑞̅), this problem is called here as Primal Energy-cost Flow Network or Primal EFN. The second one is to find a production schedule for the fixed energy consumption (𝑞̅ ≥ 0) which gives a minimal cost 𝐹𝑃𝑃(𝑞̅); this problem is called as Primal Production Planning or Primal PP.
Solving the primal sub-problem (i.e. summing the two solutions from the two separate optimization problems) gives an upper bound for the optimal solution 𝐹∗ of the original general monolithic problem.
In order to get a lower bound, the primal master problem has to be solved. The primal master problem for the general monolithic problem is constructed by relaxing the constraint (6) from the original problem using the Lagrange multiplier 𝜇. Thus, the primal master problem at iteration 𝑘 is considered for fixed values of the multiplier 𝜇(𝑘) as the minimization of
𝑤 (14)
With respect to the constraints
∀𝑘 ≥ 1; 𝑤 ≥ 𝐹𝐸𝐹𝑁(𝑞)+(𝑏𝑃𝑃− 𝐷𝑃𝑃𝑞)𝑇𝜇(𝑘) (15)
𝑞 ≥ 0 (16)
This gives a lower bound for the optimal solution of the original monolithic problem.
𝑤∗(𝜇(𝑘)) ≤ 𝐹∗ (17)
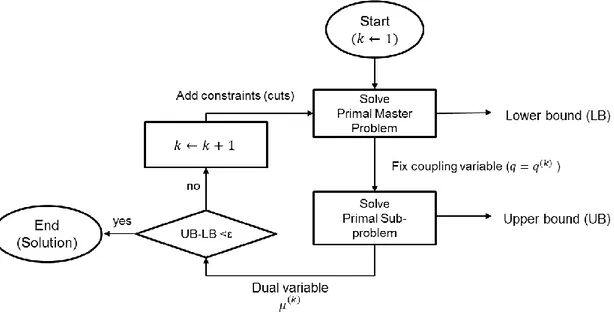
The Primal decomposition algorithm iterates between the sub-problem and the master problem. At iteration 𝑘, a solution from the sub-problem gives the values of the fixed multiplier 𝜇(𝑘) in the master problem as the marginal of the constraint (11) and a new cut is added in (15) to the previous ones. A solution from the master problem sets the value of the coupling variable 𝑞̅ to the sub-problem. The algorithm stops when the lower and upper bound converge to the optimal solution up to a tolerance.
12
Figure 8 - Primal decomposition algorithm, based on (Hadera, 2015)
The primal decomposition algorithm has the advantage of decomposing the monolithic problem while solving the primal sub-problem. However, the main disadvantage is the obligation to solve the master problem which can be even more complex than the original monolithic problem.
3.4. Dual Decomposition
Dual decomposition, also known as Dantzig-Wolfe decomposition, is another decomposition method which was developed in 1960 by Wolfe and Dantzig (Wolfe & Dantzig, 1960). As with the primal decomposition, the dual decomposition uses the dual block-angular structure of the constraint matrix to solve large scale optimization problems. This is when the
constraint matrix is in the following form
Figure 9 - Dual block-angular structure of the monolithic problem
This structure is when some variables are present in the different sub-problems. This is the case with the complicating variable 𝑞 which is present in EFN and PP sub-problems. In contrast with the primal decomposition, this method makes use of Lagrangean relaxation to eliminate the complicating constraints. The Lagrangean multipliers in this case are to be interpreted as shadow prices for the objective cost function.
13
As with the primal decomposition, the dual decomposition iterates between one problem which is called the dual sub-problem and another problem called the dual master problem.
To eliminate the complicating constraint, the equality constraint (7) in the general monolithic problem is relaxed with the corresponding free Lagrangean multiplier 𝜆. The dual
problem is constructed by setting the multiplier to a fixed value 𝜆̅. Hence, the dual sub-problem is to minimize
(𝐶𝐸𝐹𝑁𝑇 − 𝜆̅𝑇𝐴)𝑓 + 𝐶
𝑃𝑃𝑇 𝑦 + 𝜆̅𝑇𝑞 (18)
With respect to the constraints
𝐴𝐸𝐹𝑁𝑓 + 𝐷𝐸𝐹𝑁 𝑥 − 𝑏𝐸𝐹𝑁 ≤ 0 (19)
𝐴𝑃𝑃𝑦 + 𝐷𝑃𝑃𝑞 − 𝑏𝑃𝑃 ≤ 0 (20)
𝑓 ≥ 0; 𝑥 ∈ 𝑋; 𝑦 ∈ 𝑌; 𝑞 ≥ 0 (21)
Once the complicating constraint is relaxed and the multiplier is fixed, the problem becomes clearly separable. Therefore, the dual sub-problem can be solved by minimizing the first term in (18) with respect to the constraint (19) independently from minimizing the last two terms in (18) with respect to (20). The first optimization problem is called Dual EFN and the second is called Dual PP. The dual sub-problem gives a lower bound for the optimal solution of the original monolithic problem.
𝐹𝑃𝑃(𝜆̅) + 𝐹𝐸𝐹𝑁(𝜆̅) ≤ 𝐹∗ (22)
Similarly to the primal decomposition, the dual master problem has to be solved in order to get an upper bound. The master problem is formed by considering the convex combination of the solutions (extreme points) from the dual sub-problem. This combination is applied to the objective function and the complicating constraint in the original problem to form the dual master problem. Thus, at iteration 𝑘 and for fixed values of 𝑓(𝑘), 𝑦(𝑘) and 𝑞(𝑘), the dual master problem is to minimize
𝐹(𝑓(𝑘), 𝑦(𝑘), 𝑞(𝑘)) = ∑(𝑐
𝐸𝐹𝑁𝑇 𝑓(𝑘)+ 𝑐𝑃𝑃𝑇 𝑦(𝑘))𝜆(𝑘) 𝑘≥1
(23)
With respect to the constraints
∑ (𝐴𝑓(𝑘)− 𝐼𝑞(𝑘))𝜆(𝑘) = 0
𝑘≥1 (24)
∑ 𝜆(𝑘) = 1
𝑘≥1 (25)
∀𝑘 ≥ 1; 𝜆(𝑘) ≥ 0 (26) The dual master problem gives an upper bound for the optimal solution of the original
14
𝐹∗ ≤ 𝐹∗(𝑓(𝑘), 𝑦(𝑘), 𝑞(𝑘)) (27)
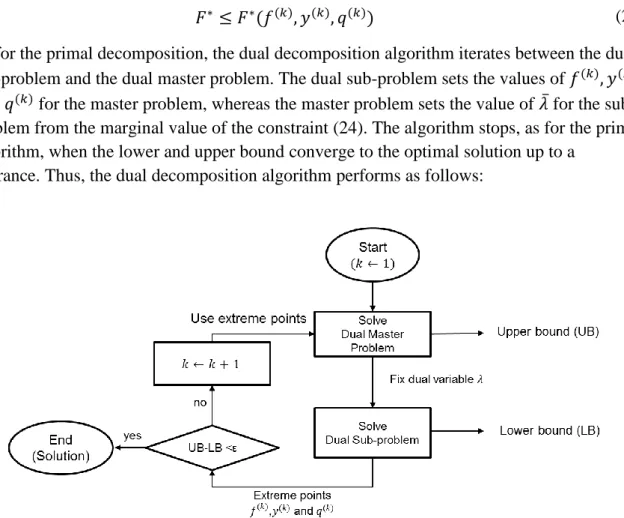
As for the primal decomposition, the dual decomposition algorithm iterates between the dual sub-problem and the dual master problem. The dual sub-problem sets the values of 𝑓(𝑘), 𝑦(𝑘) and 𝑞(𝑘) for the master problem, whereas the master problem sets the value of 𝜆̅ for the sub-problem from the marginal value of the constraint (24). The algorithm stops, as for the primal algorithm, when the lower and upper bound converge to the optimal solution up to a
tolerance. Thus, the dual decomposition algorithm performs as follows:
Figure 10 - Dual decomposition algorithm, based on (Hadera, 2015)
As with the primal decomposition algorithm, the dual algorithm has the advantage of decomposing the monolithic problem. Yet, the main disadvantage is once again the need to solve the dual master problem which can be more difficult to solve than the original
monolithic problem. One may notice that the PP dual sub-problem in this decomposition is a scheduling problem with a modified objective function.
From the two decomposition methods previously described, one can draw the general overview of the methods as in the following figure:
15
Figure 11- Overview of the primal and dual decomposition methods
3.5. Cross Decomposition
Van Roy in (Roy , 1983) published an interesting method called cross decomposition method that was originally applied to solve MILP-type problems. The method iterates between the primal sub-problem from the primal or Benders’ decomposition and the dual sub-problem from the dual or Dantzig-Wolfe’s decomposition. In each iteration, a convergence test is performed and if the test fails, the primal or dual master problem has to be solved to get the solution iterate for the next iteration. As discussed previously, the primal and the dual sub-problems give, respectively, an upper and a lower bound for the solution of the original minimization problem. Thus, the method converges when the bound gap is small enough. The following figure shows a generic scheme of the cross decomposition method:
16
It is important to note that for the sub-problems, one part of the solution is used as an input signal in the other sub-problem. This means that the complete sub-problem (EFN and PP) does not need to be solved. Thus, instead of solving the complete dual sub-problem, only dual PP is solved to get the value for 𝑞̅. Similarly, instead of solving the complete primal sub-problem, only the Primal EFN is solved to get the value for 𝜆̅.
As mentioned previously, dual PP sub-problem is a scheduling problem with a modified objective function. Similarly, primal EFN is an energy flow network problem with a fixed flow between two nodes. Hence, to solve those problems, it is possible to use the pre-existent optimizers with slight modifications.
Cross decomposition method has the advantage of decomposing the original monolithic problem by solving the primal and dual sub-problems. It uses the master problems only to steer the algorithm toward convergence if a convergence test fails. However, with this scheme it is still necessary to implement the model of the master problems which as shown previously does not correspond to any of the pre-existent models.
3.5.1. Mean-Value Cross Decomposition (MVCD)
A new development from the cross decomposition method was the so called Mean-Value Cross Decomposition method. The method was first published by Holmberg in 1992 and was initially used to solve large Linear Program (LP) problems (Holmberg, 1992). It was proven to converge for LP problems in 1994 (Holmberg, 1994). In contrast with the cross
decomposition method, MVCD iterates between the primal and dual sub-problem without having to solve any master problem when the convergence test fails. Instead of using the current solution as an input signal to each sub-problem, the method uses the mean value of all the solutions to construct the input signal. In MVCD, the input signal at iteration 𝑘 is as follows: 𝜇𝑘 =1 𝑘𝜇̃𝑘−1+ 𝑘 − 1 𝑘 𝜇𝑘−1 (28)
Where the signal input in the previous iteration is 𝜇𝑘−1 and 𝜇̃𝑘−1 is the previous solution from the dual or primal sub-problem and 𝜇𝑘 is the signal input in the current iteration.
Note that in (28), the previous solution 𝜇̃𝑘−1 is used instead of the current solution 𝜇̃𝑘. This is used in order to allow solving the primal and dual sub-problems in parallel. Thus, a second option would be to consider the current solution which gives the following input signal:
𝜇𝑘 = 1 𝑘𝜇̃𝑘+
𝑘 − 1 𝑘 𝜇𝑘−1
(29)
3.5.2. Weighted Mean-Value Cross Decomposition (WMVCD)
Another way of constructing the input signal was reported by Holmberg and Kiwiel in 2006 and yields a method that was proven to converge for nonlinear convex problems (Holmberg & Kiwiel, 2006). The method is called Weighted Mean-Value Cross Decomposition. WMVCD uses a weighted mean to construct the signal as in the following equation:
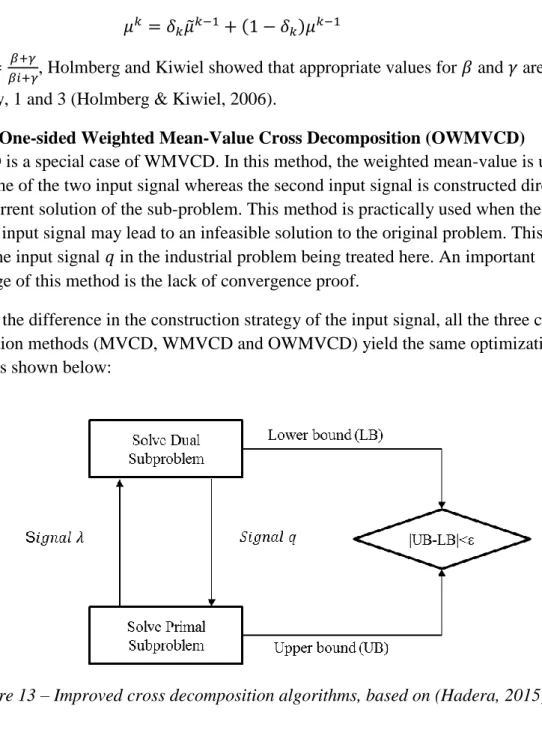
17 𝜇𝑘 = 𝛿
𝑘𝜇̃𝑘−1+ (1 − 𝛿𝑘)𝜇𝑘−1 (30)
Where 𝛿𝑖 =𝛽𝑖+𝛾𝛽+𝛾, Holmberg and Kiwiel showed that appropriate values for 𝛽 and 𝛾 are, respectively, 1 and 3 (Holmberg & Kiwiel, 2006).
3.5.3. One-sided Weighted Mean-Value Cross Decomposition (OWMVCD)
OWMVCD is a special case of WMVCD. In this method, the weighted mean-value is used to construct one of the two input signal whereas the second input signal is constructed directly from the current solution of the sub-problem. This method is practically used when the mean value of an input signal may lead to an infeasible solution to the original problem. This is the case with the input signal 𝑞 in the industrial problem being treated here. An important disadvantage of this method is the lack of convergence proof.
Apart from the difference in the construction strategy of the input signal, all the three cross decomposition methods (MVCD, WMVCD and OWMVCD) yield the same optimization algorithm as shown below:
18
4. Mathematical Modeling
Once the theoretical and technical tools have been exposed and discussed in the literature review, those tools are applied to build the mathematical models corresponding to the two industrial problems which are treated here. Firstly, the RTN technique is applied to revise and simplify a pre-existent basic model of pulp production. Secondly, the model is extended to consider paper production and additional extensions. Thirdly, we integrate the production planning with energy management into a monolithic model for both problems.
4.1. Basic Model for Pulp Production 4.1.1. Pre-existent Model
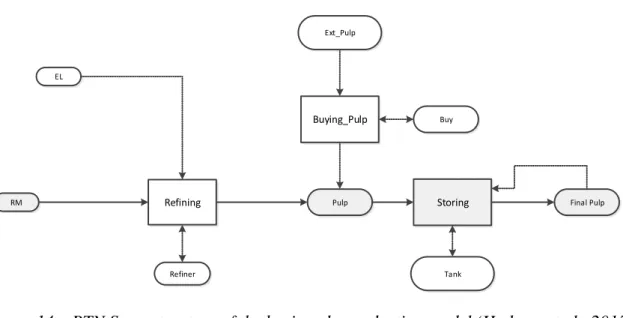
As presented in Figure 1, the basic model for pulp production represents the first stage of paper production in which the final product is pulp. This pre-existent basic model was
developed by Hadera and co-authors in (Hadera, et al., 2015) . The RTN superstructure of the model is below in Figure 14.
Storing Pulp Tank Buying_Pulp Ext_Pulp Buy Final Pulp RM EL Refining Refiner
Figure 14 – RTN Superstructure of the basic pulp production model (Hadera, et al., 2015)
This basic model describes essentially the first stage in the paper production process. The final product in this model is the final pulp that will be fed to the paper machines. There is a possibility to store the final pulp before leaving the system. The excess balance equation used in this basic model was inspired by the formulation in the literature with some adaptations in order to handle the pulp storing possibility.
19 ∀𝑟 ∈ 𝑅, ∀𝑡 ∈ 𝑇 𝑅𝑟,𝑡 = 𝑅𝑟,𝑡0 | 𝑡=1+ 𝑅𝑟,𝑡−1𝑒𝑛𝑑 |𝑟∈𝑅𝑅𝑀∪ 𝑅𝑝𝑢𝑙𝑝∪𝑅𝐹𝑖𝑛𝑎𝑙𝑃𝑢𝑙𝑝 + 𝑅𝑟,𝑡−1|𝑟∈𝑅𝑅𝑒𝑓𝑖𝑛𝑒𝑟∪ 𝑅𝐵𝑢𝑦∪ 𝑅𝑇𝑎𝑛𝑘∪ 𝑅𝐸𝑥𝑡𝑝𝑢𝑙𝑝 + ∑(𝜇𝑟,𝑖𝑁𝑖,𝑡 𝑖∈𝐼 + 𝑣𝑟,𝑖𝜉𝑖,𝑡 + 𝜇𝑟,𝑖𝑁𝑖,𝑡−1) + ∑ (𝜇𝑟,𝑖𝑁𝑖,𝑡 |𝑡=1) 𝑖∈𝐼𝑆𝑡𝑜𝑟𝑖𝑛𝑔 + Π𝑟,𝑡𝑖𝑛 |𝑟∈𝑅𝐸𝐿 − Π𝑟,𝑡𝑜𝑢𝑡 | 𝑟∈𝑅𝐹𝑖𝑛𝑎𝑙𝑃𝑢𝑙𝑝 ∀𝑟 ∈ 𝑟 ∈ 𝑅𝑅𝑀∪ 𝑅𝑝𝑢𝑙𝑝∪ 𝑅𝐹𝑖𝑛𝑎𝑙𝑃𝑢𝑙𝑝, ∀𝑡 ∈ 𝑇 (31) 𝑅𝑟,𝑡𝑒𝑛𝑑 = 𝑅 𝑟,𝑡+ ∑ 𝜆𝑟,𝑖𝜉𝑖,𝑡 𝑖∈𝐼𝑅𝑒𝑓𝑖𝑛𝑖𝑛𝑔 + ∑ (𝑣𝑟,𝑖𝜉𝑖,𝑡+ 𝜆𝑟,𝑖𝜉𝑖,𝑡∗ ) 𝑖∈𝐼𝑆𝑡𝑜𝑟𝑖𝑛𝑔 + ∑ (𝑣𝑟,𝑖𝜉𝑖,𝑡) 𝑖∈𝐼𝐵𝑢𝑦𝑖𝑛𝑔 (32)
The previous expression of the excess balance equation is slightly different from the general form exposed in the literature review. Indeed, an additional variable (𝑅𝑟,𝑡𝑒𝑛𝑑) has been added to handle the continuous resource quantities a part from the discrete ones. Besides, additional variables and structural parameters have been used to express the hybrid interaction between the storing tasks and the final pulp resource. However, as for the general excess balance equation, the quantities of each resource are either increasing (production) or decreasing (consumption).
The previous excess balance equation has been presented to show how the basic model looks like before the simplifications and then the extension. Hence, this model was not discussed here in details as will be the case with the simplified and extended model.
4.1.2. Simplified Model
In order to simplify the basic model, the solution to the storing requirement has been rethought again. Indeed, the current way of handling the storing process adds more
complexity to the modeling step as well as the solving step. Another problem with this model is that it does not make use of the propagation property of resource quantities in the RTN technique. This property of the RTN approach could be used to express the storing of the produced pulp in the system. In this way, the model could be simplified and the new RTN superstructure could be presented as in the Figure 15 below.
20 Pulp RM EL Refining Refiner Buying_Pulp Ext_Pulp Buy
Figure 15 – RTN Superstructure of the simplified basic model for pulp production
Thus, instead of handling explicitly the storing requirement with an explicit processing task (i.e. storing), the new structure makes use of the pulp quantity propagation in the RTN excess balance equation to model the pulp storing process in a more efficient way. Therefore, there will be no need to consider additional variables and structural parameters and the excess balance equation will be more compact and expressive compared to the one in the pre-existent basic model:
∀𝑟 ∈ 𝑅, ∀𝑡 ∈ 𝑇 𝑅𝑒(𝑟, 𝑡) = 𝑅𝑒(𝑟, 𝑡 − 1)𝑟≠𝐸𝐿 + ∑ (𝜇(𝑟, 𝑖)𝑁(𝑖, 𝑡) + 𝜆(𝑟, 𝑖)𝜉(𝑖, 𝑡) 𝑖∈𝑇𝑎𝑠𝑘 ) + Π𝑖𝑛(𝑟, 𝑡) − Π𝑜𝑢𝑡(𝑟, 𝑡) (33)
To complete the modeling of the interactions between tasks and resources, the values of the structural parameters for continuous 𝜆(𝑟, 𝑖) and discrete interactions 𝜇(𝑟, 𝑖) are set according to the RTN superstructure. For production interactions between a resource and a task, the value is set to +1 whereas for consumption interaction, it is set to -1. The value is set to 0 if there is no interaction. For instance, the refining task consumes continuously the raw material, therefore 𝜆(𝑟𝑎𝑤_𝑚𝑎𝑡𝑒𝑟𝑖𝑎𝑙, 𝑟𝑒𝑓𝑖𝑛𝑖𝑛𝑔) is set to -1.
Another parameter which has to be specified for the RTN model is the initial quantities of each resource. This could be given as follows:
For unlimited resources such as raw material and external pulp, the initial quantities are expressed using a large number, whereas the limited amount, such as the stored pulp, can be initialized with an initial volume in the tank. Since the process includes 3 refiners and 1 source for buying, the initial quantities of refiner and buy resources are, respectively, 3 and 1.
21
All the resources propagate except electricity (i.e. EL); this is expressed in the term 𝑅𝑒(𝑟, 𝑡 − 1)𝑟≠𝐸𝐿. The main reason is that electricity cannot be stored but it is only provided from external sources (i.e. energy grid) at the beginning of each time slot. This supply of electricity is expressed in Π𝑖𝑛(𝑟 = 𝐸𝐿, 𝑡).
The supply of raw material and external pulp is considered as unlimited. However, there is a limited amount of external pulp that could be bought at the end of each time slot which can be expressed using the following constraint
𝜉(𝑖 = 𝐵𝑢𝑦𝑖𝑛𝑔𝑃𝑢𝑙𝑝, 𝑡) ≤ 𝑀𝑎𝑥𝑝𝑢𝑙𝑝𝑒𝑥𝑡𝑁(𝐵𝑢𝑦𝑖𝑛𝑔𝑃𝑢𝑙𝑝, 𝑡) (34) The demand of pulp is given in the parameter Π𝑜𝑢𝑡(𝑟 = 𝑃𝑢𝑙𝑝, 𝑡). Thus, this amount of pulp demand will be subtracted from the amount of pulp in the system at the end of time slot 𝑡. One may notice that the index 𝜃 is considered neither for the continuous interactions 𝜉(𝑖, 𝑡 − 𝜃) nor for the discrete ones 𝑁(𝑖, 𝑡 − 𝜃). Indeed, the processing duration of the continuous tasks are not known a priori. So, the duration is considered always one time slot (i.e. 𝜃 ∈ {0}). For the discrete interactions, which are mainly between tasks and equipment resources, the semantic of the variable 𝑁 is the state of the processing task since there is only one equipment resource per task.
Thus, the basic model was significantly simplified. However, the model is still basic and does not include many of the production details. It will essentially serve as a basis towards a more general and extended model of paper production process.
4.2. Extended Model for Paper Production
Real world models for paper production consider certain level of details compared to the basic model for pulp production. Thus, as represented in Figure 2, instead of considering that the TMP is modeled with one refining stage, the real world models consider two different refining stages. The pulp produced in the first stage is used with a certain percentage directly to form the final pulp for bleaching. The remaining percentage is refined again using the refiners in the second stage before being bleached.
4.2.1. RTN Superstructure and Excess Balance Equation
The RTN superstructure can be built easily from the overview of the paper process production process in Figure 2. Using RTN conventions, Appendix 1 shows the
superstructure of the developed extended model. In order to handle the storing functionalities, the same idea as in the simplified basic model could be used. Hence, the RTN excess balance equation will remain the same. The structural parameters alongside the initial quantities are set accordingly as described in the basic model.
4.2.2. Processing Rates
The scheduling time grid is discretized uniformly and the time slot length is noted
as 𝑇𝑖𝑚𝑒𝑃𝑒𝑟𝑖𝑜𝑑 (given in hours). The time horizon is set by giving the total number of time slots. Continuous processing tasks have a limit on the amount they can process per time slot.
22
Those limits are given by minimal and maximal production rates (𝑀𝑖𝑛𝑅𝑎𝑡𝑒 and 𝑀𝑎𝑥𝑅𝑎𝑡𝑒), the constraint could be formulated in the following form:
∀𝑖 ∈ 𝑃𝑟𝑜𝑑𝑢𝑐𝑡𝑖𝑜𝑛𝑇𝑎𝑠𝑘𝑠 ∀𝑡
𝑇𝑖𝑚𝑒𝑃𝑒𝑟𝑖𝑜𝑑. 𝑀𝑖𝑛𝑅𝑎𝑡𝑒. 𝑁(𝑖, 𝑡) ≤ 𝜉(𝑖, 𝑡) ≤ 𝑇𝑖𝑚𝑒𝑃𝑒𝑟𝑖𝑜𝑑. 𝑀𝑎𝑥𝑅𝑎𝑡𝑒. 𝑁(𝑖, 𝑡) (35) Some material resources could be bought within a certain maximal rate 𝑀𝑎𝑥𝐵𝑢𝑦. This limit could be set to zero to avoid any external purchase for certain material resources. The corresponding constraint is:
∀𝑖 ∈ 𝐵𝑢𝑦𝑖𝑛𝑔𝑇𝑎𝑠𝑘𝑠 ∀𝑡
𝜉(𝑖, 𝑡) ≤ 𝑇𝑖𝑚𝑒𝑃𝑒𝑟𝑖𝑜𝑑. 𝑀𝑎𝑥𝐵𝑢𝑦. 𝑁(𝑖, 𝑡) (36)
It is important to note that those rates depend on the time period which a global parameter of the model. This allows more flexibility in considering the discretization and the time horizon.
4.2.3. Machines Start-up and Stop
In order to consider some functional requirements in start-ups and stops of machines (refiners, bleachers and paper machines), some modifications need to be brought to the structural parameters and the excess balance equation. For instance, non-active refiners, when switched on, need some time to start processing the resources. Besides, there is a start-up cost that needs to be accounted in the total cost. There are two different ways of doing this:
Using additional functional variables and constraints
As mentioned before, the state of each production task 𝑖 at time 𝑡 is indicated by the RTN integer variable 𝑁(𝑖, 𝑡). Additional positive variables 𝑠𝑡 and 𝑒𝑛𝑑 are used to capture,
respectively, the number of machines that start and the ones that stop. The additional equation is therefore as follows:
∀𝑖 ∈ 𝑃𝑟𝑜𝑑𝑢𝑐𝑡𝑖𝑜𝑛𝑇𝑎𝑠𝑘𝑠 ∀𝑡
𝑠𝑡(𝑖, 𝑡) − 𝑒𝑛𝑑(𝑖, 𝑡) = 𝑁(𝑖, 𝑡) − 𝑁(𝑖, 𝑡 − 1) (37) Accounting the cost of start-ups and stops is now easy once the variables and the constraints are added. However, this does not allow forcing easily the start-up and stopping time for the tasks.
Using additional RTN tasks and resources
In order to force the start-up and stop time for the tasks as well as to capture the number of starting and stopping machines, some RTN tasks and resources need to be added. For each production task 𝑖, two additional tasks will be added: one for starting idle machines and the other for stopping active machines. The RTN superstructure of a simple task-machine interaction as in Figure 6 becomes in this case as represented in Figure 16 below.
23
Figure 16 - Simple task-machine interaction with starting and stopping task
With the new model of task-machine interaction in mind, the RTN variable 𝑁(𝑖, 𝑡) for the new tasks is exactly the same as 𝑠𝑡 and 𝑒𝑛𝑑 in the previous method. However, the power of this new way of modeling this problem is the ability to control the duration of the starting and stopping tasks. Indeed, instead of using the structural parameter for discrete interaction as 𝜇(𝑟, 𝑖), it is now more convenient to use 𝜇(𝑟, 𝑖, 𝑡) with the additional time parameter. The excess balance equation will now include an additional summation over time for the discrete interaction term. The following figure illustrates the scenario of an example of starting task with 3 time slots as starting duration.
Figure 17 - Use of structural parameters for starting and stopping discrete tasks
4.2.4. Late Orders
In order to add more flexibility to the demand satisfaction, late orders are considered in the model. However, penalties are applied whenever an order is not satisfied before its due date. To model this, one variable will be added to the excess balance equation. The variable 𝐿𝑎𝑡𝑒𝑂𝑟𝑑𝑒𝑟(𝑟, 𝑡) will account the overdue quantity of resource 𝑟 at time 𝑡. The new balance equation with the new structural parameters for discrete interaction as well as late orders is as follows:
24 ∀𝑟 ∈ 𝑅, ∀𝑡 ∈ 𝑇 𝑅𝑒(𝑟, 𝑡) = 𝑅𝑒(𝑟, 𝑡 − 1)𝑟≠𝐸𝐿 + ∑ 𝜆(𝑟, 𝑖)𝜉(𝑖, 𝑡) + ∑ 𝜇(𝑟, 𝑖, 𝜏)𝑁(𝑖, 𝑡 − 𝜏 + 1) 𝜏 𝑖∈𝑇𝑎𝑠𝑘 + Π𝑖𝑛(𝑟, 𝑡) − Π𝑜𝑢𝑡(𝑟, 𝑡) + 𝐿𝑎𝑡𝑒𝑂𝑟𝑑𝑒𝑟(𝑟, 𝑡) − 𝐿𝑎𝑡𝑒𝑂𝑟𝑑𝑒𝑟(𝑟, 𝑡 − 1) (38)
In case the scheduling starts initially with initial late orders, the variable 𝐿𝑎𝑡𝑒𝑂𝑟𝑑𝑒𝑟(𝑟, 𝑡) for 𝑡 = 0 can be set to the initial late order of product 𝑟. As mentioned, those overdue quantities are penalized with a fixed cost 𝐿𝑂𝐶𝑜𝑠𝑡 in the objective function; therefore the cost can be easily accounted as in the following equation:
𝐿𝑎𝑡𝑒𝑂𝑟𝑑𝑒𝑟𝐶𝑜𝑠𝑡(𝑟) = ∑ 𝐿𝑂𝐶𝑜𝑠𝑡. 𝐿𝑎𝑡𝑒𝑂𝑟𝑑𝑒𝑟(𝑟, 𝑡) 𝑡∈𝑇
(39)
4.2.5. Resource Storage
Resources can be stored in different storage tanks. Those tanks are characterized with minimal and maximal volume that can be stored. This is easily incorporated in the RTN model by adding the following constraint on each resource 𝑟 at each time 𝑡
𝑀𝑖𝑛𝑉𝑜𝑙𝑢𝑚𝑒(𝑟) ≤ 𝑅𝑒(𝑟, 𝑡) ≤ 𝑀𝑎𝑥𝑉𝑜𝑙𝑢𝑚𝑒(𝑟) (40)
Storage cost can be accounted by associating a fixed cost 𝑆𝑡𝐶𝑜𝑠𝑡 to each excess of a resource 𝑟 in the storage tank as in the following equation
𝑆𝑡𝑜𝑟𝑎𝑔𝑒𝐶𝑜𝑠𝑡(𝑟) = ∑ 𝑆𝑡𝐶𝑜𝑠𝑡. 𝑅𝑒(𝑟, 𝑡) 𝑡∈𝑇
(41)
4.2.6. Paper Making Change-over
The changeover in a machine is needed when two different products can be produced. This is for instance what happens for the paper machines with the different paper grades. The
change-over in a machine 𝑅, performing two different tasks, could be illustrated as in the following figure:
Figure 18 - Change-over illustration in a production machine
One may notice that the change-over occurs when the machine is shifting from performing one task to a different one, this is indicated in the figure using the red arrows. In order to
25
handle the changeover requirements, for instance: changeover costs and time delay, there are two different ways to do this:
Using additional variables and constraints
This first solution requires some thinking effort to set the correct equations. It is instructive to discuss the equations based on a simple example. The following figure shows a scenario of the simple process presented in Figure 18. The variables 𝑁(𝑖, 𝑡) represent the usual RTN state variables of task 𝑖 at time 𝑡, we add an additional Boolean variable 𝑅(𝑖, 𝑡) which indicates if the machine is assigned to perform task 𝑖 at time 𝑡.
Figure 19 - Capturing machine change-over using additional variables
The following constraints give the relation between the variables 𝑅(1, 𝑡) and 𝑁 for the example. Similar constraints could be written for 𝑅(2, 𝑡):
𝑅(1, 𝑡) ≥ 𝑅(1, 𝑡 − 1) − 𝑁(2, 𝑡) (42)
𝑅(1, 𝑡) ≥ 𝑁(1, 𝑡) (43)
One more important constraint has to be added to ensure that initially the machine is assigned to perform at most one task:
𝑅(1, 𝑡 = 0) + 𝑅(2, 𝑡 = 0) ≤ 1 (44)
The change-over can now be easily captured using an additional equation and two constraint. The first constraint captures the change-over from task 1 to 2 and the second from 2 to 1:
𝐼𝑠𝐶ℎ𝑔(𝑡) ≥ 𝑅(1, 𝑡) − 𝑅(1, 𝑡 − 1) (45)
𝐼𝑠𝐶ℎ𝑔(𝑡) ≥ 𝑅(2, 𝑡) − 𝑅(2, 𝑡 − 1) (46)
The constraints can be easily generalized to the case where a machine can perform more than two tasks. Thus, the cost is accounted for a given change-over cost 𝐶ℎ𝑔𝑂𝑣𝑒𝑟𝐶𝑜𝑠𝑡as:
𝐶ℎ𝑔𝑐𝑜𝑠𝑡 = 𝐶ℎ𝑔𝑂𝑣𝑒𝑟𝐶𝑜𝑠𝑡 ∗ ∑ 𝐼𝑠𝐶ℎ𝑔(𝑡) 𝑡
26
Using additional RTN tasks and resources
The second way is by using additional resources and tasks in the RTN superstructure. The idea is to use the following change-over interactions instead of the ones used in Figure 18.
Figure 20 - Example of RTN superstructure to capture change-overs
The structural parameters are afterwards set accordingly. In this way, the constraints to capture the changeover are implicitly added to the model via the excess balance equation since the corresponding structural parameters were set. Once again, the method can be easily used for more than two tasks. Thus, the change-over cost can be accounted using the RTN state variables 𝑁(𝑅𝑖 𝑡𝑜 𝑅𝑗, 𝑡).
4.2.7. Energy Consumption
As mentioned in 2.3 about energy management model, the energy consumption is accounted as an optimal purchase strategy of the energy demand in each time slot of the production. The model is basically a flow network optimization problem. Since this energy optimization model is not the main topic of this project, we simply refer to (Hadera, et al., 2014a) for interested readers.
4.2.8. Objective Function
The objective function expresses the different production and energy costs. This includes electricity consumption cost, material resource buying costs and storing costs as well as penalties on late orders. Electricity consumption cost is of course accounted from the optimal electricity purchase strategy using the energy optimizer. The overall cost of the process is given in the following equation:
𝑂𝑏𝑗 =
𝐸𝑙𝐶𝑜𝑠𝑡
+ ∑(𝐵𝑢𝑦𝑖𝑛𝑔𝐶𝑜𝑠𝑡(𝑟) + 𝑆𝑡𝑜𝑟𝑎𝑔𝑒𝐶𝑜𝑠𝑡(𝑟) + 𝐿𝑎𝑡𝑒𝑂𝑟𝑑𝑒𝑟𝐶𝑜𝑠𝑡(𝑟)) 𝑟(48)
4.3. Pre-existent Model for Stainless Steel Production
So far only pulp and paper production planning model was revised and extended, stainless steel production planning model will be shortly discussed in this section. Unlike pulp and paper production model which uses discrete scheduling, stainless steel production model uses
27
continuous-time production scheduling model. The starting time of a machine 𝑚 which is processing a heat or a product 𝑝 is noted as 𝑡𝑚,𝑝𝑠 and can take any real value in the scheduling time horizon. Like the pulp and paper case, the energy management is modeled as an Energy Flow Network - EFN for all the time intervals, i.e. for each time slot 𝑠. The EFN is modeled with one balancing node between the nodes which correspond to the sources of energy and the ones which represents 𝑞𝑆 the demand of energy for production during the time slot 𝑠 as well as the sales (Figure 4) (Hadera, et al., 2014a). The deviation penalties are modeled as the cost of the deviation of the load curve 𝑞 = (𝑞𝑆) from a pre-agreed curve. Thus, the overall cost of the steel production problem considered in this application is a follows.
𝐶𝑜𝑠𝑡 = 𝑐 ∑ 𝑡𝑚,𝑝𝑠 𝑚,𝑝
+ 𝜇(𝑞) + 𝛿(𝑓) (49)
An overview of the model corresponding to the steel production problem being studied is given below:
Figure 21 - Stainless production planning problem, based on (Hadera, et al., 2014a)
Hadera and co-authors have developed a detailed model for the monolithic problem as a MILP problem in (Hadera, et al., 2014a). The mathematical model was later on improved in (Hadera, et al., 2014b) with a more concise time accounting in the scheduling model.
The pre-existent developed MILP model can be formulated in a general compact form as minimizing the overall cost
28 𝑐 ∑ 𝑡𝑚,𝑝𝑠
𝑚,𝑝
+ 𝜇(𝑞) + 𝛿(𝑓) (50)
With respect to the production planning constraints
𝐴𝑃𝑃(1)𝑦 + 𝐷𝑃𝑃(1)𝑡𝑠 − 𝑏
𝑃𝑃(1)≤ 0 (51)
𝐴𝑃𝑃(2)𝑤 + 𝐷𝑃𝑃(2)𝑡𝑠 − 𝑏
𝑃𝑃(2) ≤ 0 (52)
𝐻𝑤 − 𝐼𝑞 = 0 (53)
And the energy flow network constraints
𝐴𝐸𝐹𝑁𝑓 + 𝐷𝐸𝐹𝑁 𝑔 − 𝑏𝐸𝐹𝑁 ≤ 0 (54)
𝐴𝑓 − 𝐼𝑞 = 0 (55)
And the variable type and bounds requirements
𝑔 ∈ 𝐺; 𝑦 ∈ 𝑌; 𝑞, 𝑓, 𝑤, 𝑡𝑠 ≥ 0 (56)
The objective function (50) represents all the cost of the production process. The production planning constraints regarding the scheduling are given by the constraint (51). Whereas (52) allows the accounting of the production time which is translated to the energy consumption 𝑞 with the constraint (53). The consumption 𝑞 is linked to the flow from the balance node to the demand node using (55) and the flow network constraints are represented using (54). For more detailed equations of the models see (Hadera, et al., 2014a) and (Hadera, et al., 2014b).
In order to get a good feasible solution to this optimization problem for real industrial instances within a reasonable time, this monolithic formulation has to be changed and some heuristic has to be implemented. For this, Hadera and co-authors in (Hadera, et al., 2014a) developed a bi-level heuristic that decomposes the monolithic problem into two main levels. The basic idea is to use some variable fixings between the different levels and iterate after adding cuts. Fixing some variables decreases the complexity of the problem in each level. This allows iterating until a CPU time limit is reached to get a good feasible solution which is not necessarily optimal since this is a heuristic method.
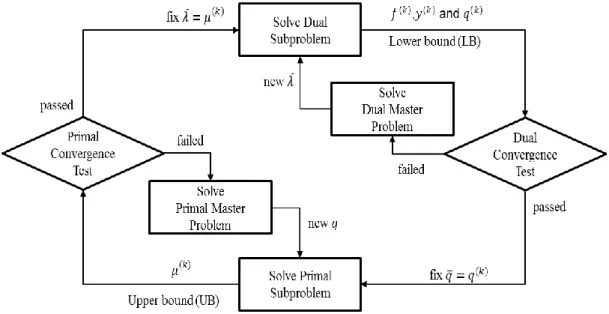
Appendix 2 shows the optimization algorithm using the bi-level heuristic to solve the monolithic problem for stainless steel production process.
29
5. Energy Integration to Production Planning
After revising and developing an extended version of pulp and paper production planning model as well as revising an already existing stainless steel production planning model, we get two of the most interesting mathematical models for energy integration using different decomposition schemes.
Through the literature review, different methods were described which led at the end to the so-called cross decomposition methods. These decomposition methods do not only meet the industrial requirements of using the pre-existent optimizers, but are also considered among the best decomposition methods in the literature dealing with this decomposition problem. The study here could be considered as the first to investigate those methods on real industrial problems. In this chapter, energy management for pulp and paper production is first
integrated using simple decomposition schemes. Second, stainless steel case requires
complex schemes. Along the way, the mathematical models will be used in a compact form.
5.1.1. Simple Decomposition Scheme for Pulp and Paper Production
The pulp and paper production planning model is a MILP model which is based on the RTN scheduling technique. To serve the purpose of energy integration to production planning using cross decomposition methods, we first start by writing the two main sub-problems: the primal sub-problem which is the Energy Flow Network - EFN model with fixed flow on one arc and the dual sub-problem which is the Production Planning– PP model with a marginal cost for pricing energy in the objective function.
On the one hand, the primal EFN sub-problem is easily constructed by fixing 𝑞 to a certain value 𝑞̅ ≥ 0 and considering the energy flow network sub-problem as minimizing
𝐶𝐸𝐹𝑁𝑇 𝑓 (57)
With respect to the energy flow network constraints
𝐴𝐸𝐹𝑁𝑓 + 𝐷𝐸𝐹𝑁 𝑔 ≤ 𝑏𝐸𝐹𝑁 (58)
𝐴𝑓 − 𝐼𝑞̅ = 0 (59)
𝑔 ∈ 𝐺; 𝑓 ≥ 0 (60)
On the other hand, the dual sub-problem is constructed by fixing the Lagrangean multiplier 𝜆 to the marginal cost 𝜆̅ of the complicating constraint in the previous primal EFN
sub-problem. The dual PP sub-problem corresponds to the following production planning problem as minimizing
𝑂𝑏𝑗𝑃𝑃(𝑥) + 𝜆̅𝑞 (61)
With respect to the production planning constraints
𝐴𝑃𝑃𝑦 + 𝐷𝑃𝑃𝑥 ≤ 𝑏𝑃𝑃 (62)