How to improve the inbound flow of
an manufacturing company
Analyzing and refining the Customer-driven Purchasing method
Master Thesis in Business Administration
Author: Eric Hedén
Fredrik Tiedemann
Tutor: Per Skoglund
Acknowledgments
First and foremost we would like to thanks our supervisor Per Skoglund, Assistant Profes-sor at Jönköping International Business School and our mentor Jenny Bäckstrand, Assis-tant Professor at Jönköping School of Engineering for their invaluable guidance and advic-es that they have given throughout this radvic-esearch.
We have been very fortunate to conduct our research at Ericsson AB in Borås, Fagerhult Belysning AB in Habo, Parker Hannifin AB in Trollhättan and Siemens Industrial Tur-bomachinery AB in Finspång.
Several people deserve a special mention. We are incredibly grateful to ‘Senior Supplier Developer’ at Ericsson AB – ‘Production Logistics Manager’ at Fagerhult Belysning AB – ‘Inbound/Outbound Manager’ at Parker Hannifin AB – ‘Logistics Development Manager’, ‘Strategic Logistics Developer’ and ‘Senior Project Manager, Global sourcing’ at Siemens for taking their time and for contributing with data. To all of you we express our sincere thanks and appreciation.
This research could never have been done without the cooperation of all mentioned above. May, 2014, Jönköping.
_________________
_________________
Summary
Master Thesis in Business Administration
Title: How to improve the inbound flow of an manufacturing company: Analyzing and refining the Customer-driven Purchasing method
Author: Eric Hedén, Fredrik Tiedemann
Tutor: Per Skoglund
Date: 2014-05-29
Subject terms: Customer-driven Purchasing, CDP-method, Portfolio purchasing, Customer Order Decoupling Point, Supply chain strategy, Standard-ization, Over-specification
Purpose
The purpose of this research is to analyze the CDP-method in order to develop and refine the method. The method is developed and presented in Bäckstrand (2012), with the aim to strengthen the competitiveness of manufacturing companies. Someone outside of the de-velopment context has never, until now and to the researchers knowledge, refined the method.
Methodology
A multiple case study with four companies where used. The empirical data collected within the study where used to evaluate the CDP-method and to refine the method. The present-ed improvement is baspresent-ed on the empirical data and conceptual models developpresent-ed from theory.
Findings
Three improvements were developed. The first of them changed step 8 of the method, the second can´t be tied to a single step and is therefore an overall suggestion, whereas the third provides a new type of analysis within step 6 of the method.
Research limitations
The research was conducted at companies where the CDP-method was already implement-ed. An implementation at a new company could possibly reveal another type of empirical data, which could be interpreted in a different way. The researchers have also detected are-as that couldn’t be investigated within this research, these are identified and left for further research.
Theoretical implications
Results from this thesis connect the classification of supply risk by Kraljic (1983) with sup-ply chain strategy by Fisher (1997) to enable a new type of analysis. Furthermore, theory within the standardization and over-specification (e.g. Burt, Petcavage & Pinkerton, 2010; Geldeman & van Weele, 2002) is introduced and incorporated in the CDP-method. A third implication is a reinforced focus on strategy in combination with the CDP-method, which is based on theory regarding strategic alignment (e.g. Gattorna & Walter, 1996; Hines, 2004).
Managerial implications
The new analysis should, together with the CDP-method as a whole, strengthen adopting companies supply chain and improve internal and external communication.
Originality/value
This thesis provides a new set of analysis in the CDP-method that could benefit practition-ers.
Table of Contents
1 Introduction ... 1 1.1 Background ... 1 1.2 Problem statement ... 2 1.3 Purpose ... 2 1.4 Delimitations ... 3 1.5 Key terms ... 3 1.5.1 Efficiency focus ... 3 1.5.2 Responsiveness focus ... 3 1.6 Disposition ... 3 2 Methodology ... 5 2.1 Research process ... 5 2.2 Research approach ... 6 2.2.1 Methodological choice ... 6 2.2.2 Case Study ... 6 2.3 Data collection ... 7 2.3.1 Observations ... 7 2.3.2 Interviews ... 7 2.3.3 Documentation studies... 8 2.4 Analysis of data ... 9 2.4.1 Triangulation ... 9 2.4.2 Pattern matching ... 10 2.5 Trustworthiness... 10 2.6 Ethical considerations ... 11 3 Theoretical framework ... 12 3.1 Literature review ... 123.2 The method for customer-driven purchasing ... 13
3.2.1 Step 1 – Identifying product structure and ‘Bill of material’ ... 13
3.2.2 Step 2 – Identify Supply lead-time for each item ... 14
3.2.3 Step 3 – Differentiate forecast- from customer-order-driven items ... 14
3.2.4 Step 4 – Differentiate generic from unique items ... 15
3.2.5 Step 5 – Differentiate make from buy items ... 15
3.2.6 Step 6 – Analyze items in the customization-perspective framework ... 15
3.2.7 Step 7 – Analyze items in the certainty-customization framework... 16
3.2.8 Step 8 – Analyzing items in the CAP matrix ... 17
3.2.9 Step 9 – Select supplier relationships to analyze ... 18
3.3 Strategy... 18
3.3.1 Levels of strategy ... 18
3.3.2 Alignment of strategies ... 19
3.4 Matching supply chain strategies with product type ... 20
3.4.1 Impact of the customer order decoupling point ... 21
3.4.2 Supply chain strategy paradigms ... 22
3.5 Portfolio purchasing ... 23
3.6 Standardization ... 25
3.7 Over-specification... 25
4 Presentation of empirical data ... 27
4.1 Description of case companies ... 27
4.1.2 Fagerhult Group ... 27
4.1.3 Parker Hannifin Manufacturing Sweden AB ... 28
4.1.4 Ericsson AB ... 28 4.2 Empirical findings ... 28 4.2.1 Siemens ... 28 4.2.2 Fagerhult ... 30 4.2.3 Parker ... 31 4.2.4 Ericsson ... 32
5 Refinement of the CDP-method ... 36
5.1 Improvement 1 - Step 8 of the CDP-method ... 36
5.2 Improvement 2 - Strengthen alignment of strategies ... 39
5.3 Improvement 3 - Reducing the variation of unique items ... 40
6 Conclusion and Discussion ... 45
6.1 Theoretical implications ... 45
6.2 Managerial implications ... 45
6.3 Fulfilment of purpose ... 46
6.4 Final reflection and suggestions for future research ... 46 Appendices
Appendix 1 – Phase 3 of the CDP-method. Appendix 2 – Interview guide.
Figures
Figure 2.1 Research process ... 5
Figure 2.2 The dimensions of interviews and the one used in this research ... 7
Figure 2.3 Analyze of empirical data and theoretical data ... 9
Figure 3.1 The theoretical framework and its structure. ... 12
Figure 3.2 Flowchart of the CDP-method, with delimitation ... 13
Figure 3.3 The customization-perspective framework ... 16
Figure 3.4 The certainty-customization framework ... 16
Figure 3.5 Focus in the CAP matrix ... 17
Figure 3.6 Appropriate CAP matrix in different positions in the certainty-customization framework ... 17
Figure 3.7 Framework for strategic alignment ... 19
Figure 3.8 Finding the Zone of Strategic fit ... 21
Figure 3.9 The CODP... 21
Figure 3.10 How demand and supply characteristics determines supply chain strategy ... 23
Figure 3.11 The Kraljic-matrix ... 24
Figure 4.1 Supply risk matrix ... 32
Figure 5.1 Adjusted CAP matrix ... 37
Figure 5.2 Sourcing focus based on the level of certainty combined with the CODP ... 38
Figure 5.3 Vertical and horizontal alignment ... 39
Figure 5.4 The customization perspective framework ... 40
Figure 5.5 Moving downwards in the customization perspective framework ... 42
Figure 5.6 Moving upwards in the customization perspective framework ... 43
Tables
Table 2.1 Summery of interviews, duration and type ... 8Table 3.1 Example of layout of the BOM table ... 13
Table 3.2 Example of layout of the lead-time table ... 14
Table 3.3 Example of the layout for the supply lead-time compilation table ... 14
Table 3.4 Example of the supply lead-time compilation table, with CODP ... 15
1 Introduction
This chapter starts by describing the background for this research. The background will build up to the is-sues under investigation, which are expressed in the problem statement. The specification of the problem will then lead to the formulation and presentation of the purpose. Lastly will the boundaries of the investigation be stated together with the disposition of the thesis.
1.1 Background
This thesis takes off in the growing competition that companies, or more precisely their supply chains, faces in the modern business environment (Christopher, Peck & Towill, 2006; Lyons, Mondragon, Piller & Poler, 2012). The competition has led to a higher strate-gic relevance for functions such as purchasing and manufacturing and their connections to related functions. This enhances the importance of alignment of functional strategies (Ly-ons et al., 2012; Porter, 1996).
The scope and role of logistics have changed dramatically over the years (Chapman, Soosay & Kandampully, 2003). It has evolved from being seen as a supportive role and a cost-absorbing function (Chapman et al., 2003; Christopher, 1993) to be recognized as a strate-gic factor that provides a unique competitive advantage (Chapman et al, 2003; Gadde & Hulthen, 2009) in the intensified global competition (Christopher, 2011; Cui & Hertz, 2011; Datar, Kekre, Mukhopadyay & Svaan, 1991).
Competition among industrial firms, in modern business, is therefore no longer conducted between individual firms, but rather between their supply chains (Christopher, 2011; Chris-topher et al., 2006; Lambert & Cooper, 2000), which puts more emphasis on managing the business relations (Lambert & Cooper, 2000). One of the reasons for the heightened com-petition is that outsourcing and global sourcing has been more prevalent (Nagurney & Li, 2013). Today it´s common practice to outsource production processes or source globally (Nassimbeni & Sartor, 2006; Wang, Niu & Guo, 2013). One of the arguments for outscor-ing and global sourcoutscor-ing is cost reduction, derived from the fact that other organizations may have better knowledge or resources (Kroes & Ghosh, 2010). Furthermore, by out-sourcing a company can reduce excess production capacity and focus on its core competi-tive competences (Nagurney & Li, 2013). This leads to a situation were an external actor performs activities that has traditionally been performed internally (Lambert & Cooper, 2000).
The trend of outsourcing and sourcing globally has lead to longer supply chains, as firms increasingly move production offshore or source from more distant locations (Christopher, 2011). A drawback from this might be that the customer order decoupling point1 (CODP)
is transferred from the manufacturer (internal) to the supplier (external) (Bäckstrand, 2012; Wikner & Bäckstrand, 2011). The position of the CODP, in regard to the supply chain, has received much attention by other scholars (e.g. Borgström and Hertz, 2011; Lamming, Johnsen, Zheng & Harland, 2000; Mason-Jones and Towill, 1999; Rudberg and Wikner, 2002). Bäckstrand (2012) targets her research on how the supplier interaction should be
1 The CODP separates the part of the supply chain focused on satisfying the customer and the part of the
supply chain based on planning (Hoekstra and Romme, 1992). This means that the CODP is the point in the flow of goods that separates forecast driven production (speculation) from customer order driven production (Giesberts & van den Tang, 1992).
handled with regard to the position of the CODP. Furthermore, since the CODP might be located outside of the manufacturer, the firms manufacturing strategy must be extended and also include the supplier interaction (Bäckstrand, 2012). This identifies a need for stra-tegic alignment and knowledge transfer between manufacturing and purchasing functions, also highlighted by other scholars (e.g Rebolledo & Jobin, 2013; Soni & Kodali, 2011). To reduce these problems and provide guidance for manufacturing companies who experi-ence them, Bäckstrand (2012) developed a method for ‘Customer-driven Purchasing’ (the CDP-method). The method was developed together with six companies in a project called ‘KOPeration’, and then implemented on four of them. The aim of the method is to
inves-tigate how the customer requirements should impact the supplier interactions and how the requirements can be incorporated in the purchasing strategy. This method is interesting since it contributes to improved interaction with suppliers as well as improved internal communication and integration (Bäckstrand et al., 2013), which has proven to be a compet-itive advantage by other scholars (e.g. Huo, 2012; Pagell, 2004). Since the method uses a triadic perspective, including the suppliers, the manufacturer and the customer, it takes on a supply chain approach. Given the current situation with competition between supply chains, the approach by the CDP-method reduces the risk of sub-optimizations in the sup-ply chain. Considering the reasoning above, the importance of such a method cannot be neglected since it will increase the competitiveness of manufacturing companies, and their supply chains.
1.2 Problem statement
Research within supply chain management is mainly devoted to theory building, such as the development of the CDP-method, with little attention on verifying the theories (Soni & Kodali, 2011). Development of existing theories within operations management has been lacking. One reason for this is that they are seldom developed in a format or depth that en-able refinement or supporting of the theories presented (Schroeder, 2008). The CDP-method is based on a doctorial dissertation that, according to the researchers, fulfills aforementioned criteria’s and therefore could be refined and supported. The CDP-method has never, to the researchers knowledge, been supported, verified or refined after its release in year 2012. This reveals an area that the researcher can contribute to, namely theory re-finement of the CDP-method. Furthermore, it is stated in Bäckstrand (2012) that subse-quent work with the method is needed in order to provide even more competitiveness for companies that chooses to adopt it. These facts form the core of this research problem statement and purpose.
1.3 Purpose
From the reasoning above the following research purpose is derived:
The purpose of this research is to analyze the CDP-method in order to develop and refine the method.
To be able to fulfill this purpose, an analysis of the CDP-method as well as the context where it has been implemented needs to be conducted. This analysis needs to be based both on theoretical data, that is how the method should be used, and empirical data, how the method is used. When this analysis is done, further developments can be proposed.
1.4 Delimitations
The CDP-method, as described by Bäckstrand (2012), contains 12 steps divided into 3 phases. This study focus on step 1-5 (phase 1) and step 6-9 (phase 2) of the method. The result from the first two phases are which products or suppliers to further investigate. The third phase involves evaluation of the present relationship with the suppliers and the de-sired future state and is not included in this study. Non of the case companies have imple-mented step 10-12 (phase 3) and therefore can no empirical data can be collected. These steps are therefore considered to be outside the scope of this thesis. For more information regarding the third phase please see Appendix 1.
1.5 Key terms
’Efficiency focus’ and ’Responsiveness focus’ are two important terms that are used throughout this thesis. These terms are hereunder defined, by the researchers, in order to clarify for the readers.
1.5.1 Efficiency focus
In relation to purchasing situations and this thesis, the term ’efficiency focus’ is referred to as:
Purchasing items with the minimum amount of manual intervention as possible, and/or by the most cost
ef-fective order quantities as well as similar efforts. This is done with the purpose of reducing the total cost.2
1.5.2 Responsiveness focus
In relation to purchasing situations and this thesis, the term ’responsiveness focus’ is re-ferred to as:
Purchasing items with a short supply lead-time for replenishment, enabled through long-term supplier rela-tions and/or aggressive investments as well as similar efforts. This is done with the purpose of being able to
respond quickly and be flexible to customer demand.3
1.6 Disposition
Chapter 1: The Introduction chapter presents the background to the research and why
this area is important to study. Here are also the purpose and key terms stated.
Chapter 2: Methodology explains and clarifies how the research has been conducted.
This chapter describes how and what information that has been collected as well as the process of analyzing the data. The chapter is ended with a discussion around the trustwor-thiness of the research and the ethical considerations that’s been taken in mind.
Chapter 3: The Theoretical framework accounts for the theories that have been used
within this research. Here under are phase 1 and 2 of the CDP-method presented as well as the theories thats been used for development of the method.
2 This definition is based on Fisher (1997), Gerlderman and Semeijn (2006), Kraljic (1983) and Olsen and
Ellram (1997).
3 This definition is based on Christopher et al. (2006), Fisher (1997), Gerlderman and Semeijn (2006), Kraljic
(1983) and Olsen and Ellram (1997).
Chapter 4: Presentation of empirical data starts off by presenting the four case
compa-nies where the empirical data where gathered. The collected data are then presented for each and every company in the same order as the companies where presented.
Chapter 5: Refinement of the CDP-method presents the analyze that’s been made
re-garding the research purpose. The analysis is presented as a discussion, connecting the the-ories presented under chapter 3 with the empirical findings in chapter 4. The analysis and discussion are presented as three improvements, each under their own subheading. Each of the three discussions is ended with a summarization, presenting one part of the fulfillment to the research purpose.
Chapter 6: Conclusion and discussion is the final chapter of this thesis. Here under are
theoretical and managerial implications discussed. A discussion regarding fulfillment of the research purpose is also conducted. The chapter is ended with final reflections from the re-searchers as well as suggestions for further research.
2 Methodology
In this chapter is the research methodology presented. Firstly, a brief overlook of the research process is pre-sented. The following part has a structure based on Saunders, Lewis and Thornhills (2012) research ‘on-ion’ approach and starts by presenting the undertaken research approach. Next, the research design is pre-sented, followed by the methods and techniques used for data collect and data analysis. A discussion regard-ing the quality of the research and the ethical considerations finalizes the chapter.
2.1 Research process
The research process started when the authors found an interesting topic and formulated the research’s purpose. This was then transformed into a research proposal as presented in Figure 2.1. The right side of the figure also reveals the progress of how the thesis was writ-ten. Theory behind the CDP-method and its surrounding theories were studied parallel during this process. However, the researchers studied scientific research theory at an early stage in order to decide how the research should be conducted.
Figure 2.1 Research process.
Studies of the CDP-method and the surrounding theories resulted in the theoretical framework and were used to analyze the data. Before visiting the case companies a work-shop was conducted together with all the companies within this research. The empirical
da-ta gathered in this sda-tage was then analyzed in order to see which areas of the method that the companies thought could be further developed. The next step in the process was to vis-it the case companies in order to gather more detailed empirical data. Analysis of both em-pirical and theoretical data started simultaneously as the emem-pirical data were collected from the first case company. This analysis then formed the conclusions of the research.
2.2 Research approach
The purpose with this research was to analyze the CDP-method, by Bäckstrand (2012). Its theories and surrounding theories was studied before empirical data were collected and analyzed. The result of the theoretical study of the CDP-method and its surrounding theo-ries resulted in theoretical concepts of how the method could be refined, the concept of development of conceptual analytical models is described by Wacker (1998). This approach was therefore characterized by tests of general principles and existing theories, which is de-scribed as deductive by O’Leary (2010) and Saunders et al. (2012). The initial concepts where then discussed with the case companies, at a workshop, regarding viability before going to the case companies for data collection.
2.2.1 Methodological choice
During this approach a number of data collection techniques were used, (i.e. observations, document studies and interviews). These techniques allowed the researchers to interpret spoken and written words in depth and the chosen methodology can therefore be de-scribed as a qualitative multi-method design (Saunders et al., 2012). This choice is, accord-ing to Saunders et al. (2012), favored over mono-method due to the richer data collection, analysis and interpretation.
Ellram (1996) state that quantitative research is the norm for research within this field, but that qualitative research is gaining in acceptance and is seen as a valuable alternative to quantitative research, especially within fields such as: purchasing, logistics and operations management, which where the fields in focus for this research.
2.2.2 Case Study
The researchers have deployed a case study to collect empirical data. The case study in-volved both joint workshops and case company visits. the purpose with the case study was to collect empirical data in order to refine the study conducted by Bäckstrand (2012). This is a common application for a case study (Ellram, 1996) together with extension of theory (Voss, Tsikriktsis & Frohlich, 2002).
The same issues were treated at the four case companies, which can be seen as a multiple case study design, according to Yin´s (2009) definition. The benefits of using a multiple-case design, compared to a single-multiple-case study, are the analytical benefits and the robustness (Yin, 2009). Näslund (2002) states that quantitative surveys yield limited benefits for tioners. Hence a qualitative case study would provide more useful knowledge for practi-tioners.
Four companies were selected for this research. These companies were used in the study by Bäckstrand (2012), which influenced the selection as these companies have implemented the CDP-method. The selected companies were: Ericsson AB in Borås, Fagerhult Bely-sning AB in Habo, Parker Hannifin AB in Trollhättan and Siemens Industrial Tur-bomachinery AB in Finspång. Worth mentioning is that these companies constitutes the total population of companies that have adopted the CDP-method, to the researchers
knowledge. Therefore no sampling were required since the total population (the census) could be researched (Saunders et al., 2012).
2.3 Data collection
The information needed to answer the research objectives where gathered through inter-views, document studies and observations. In addition, in situations were something had to be clarified after the company visit were completed, e-mails have been used between the respondents and researchers. All these data collection techniques are qualitative according to Saunders et al., (2012). Multiple sources of evidence and techniques are typically used within a case study due to the fact that no single source or technique has the complete ad-vantage over all the others (Yin, 2009).
The aim of the data collection was to gather data about how the case companies used the CDP-method, their thought about it as well as to test the viability of the suggested refine-ments of the method. The techniques to achieve this were influenced by the research pur-pose, which is recommended by Creswell (2003).
2.3.1 Observations
Observations where conducted at all the case companies in order to gain richer infor-mation and better understanding of the companies business as well as the way they have used the CDP-method. The data sought were therefore of more qualitative nature, meaning that the researcher were more interested in what was happening rather than how often it happened. According to Saunders et al. (2012) this is what describes a participant observa-tion, which can be compared to what Yin (2009) refers to as direct observations. All obser-vations where conducted in form of, what Saunders et al. (2012) and Williamson (2002) call, ‘observer-as-participant’.
2.3.2 Interviews
The material sought was sensitive and the questions where open ended, all in line with Gillhams (2000) description of when interviews are appropriate to use. All interviews where conducted face-to-face due to the fact that the information given is more likely to be of higher importance (Saunders et al., 2012) and the respondent is more likely to disclose information during a face-to-face interview (Gillham, 2000). Furthermore, all interviews have been audio-recorded and notes have been taken as backup, if the recording equipment where to fail. These recordings have then been compressed into short summaries and can be seen as what Saunders et al. (2012) refers to ‘transcript summaries’. In order to minimize the risk of losing information, the transcript summaries have been written shortly after re-spective interview, as suggested by Saunders et al. (2012).
Figure 2.2 The dimensions of interviews and the one used in this research (Gillham, 2000, p. 60)4. 4 The figure is modified by the researchers.
The interview techniques used during this research can be described as unstructured to semi-structured, according to Gilliam’s (2000) definitions. The four different techniques used were verbal observations, ‘natural’ conversations, open-ended interviews as well as semi-structured interviews. The use of the different techniques is described more thor-oughly below and more information about them can be seen within the dashed marking in Figure 2.2.
The researchers used verbal observations as well as ‘natural conversation’ to get a better understanding of the topic during the workshops conducted within this study. The reason for the use of this technique was to ask questions when the opportunity naturally arose as well as to get to know the settings, the people and to establish credibility, all in line with Gillham (2000). During the company visits a mix of open-ended and semi-structured inter-views where conducted. The researchers had a few open questions together with a couple of closed questions. The open-ended interviews (elite interviews) where used to get a better and more comprehensive grasp of what was researched. The semi-structured interviews yielded the richest single source of data during the case study, which is normal within a case study (Gillham, 2000). The researchers had a short list of open-ended key questions to be answered and used probing questions to follow up on leads provided by the respondent (Creswell, 2003; Stake, 2010; Williamson, 2002). The questions used where based on in-formation from both the CDP-method and the opening workshop. For more inin-formation regarding the questions used, see Appendix 2.
Table 2.1 Summery of interviews, duration and type
All interviews were conducted at the premises of the case companies and with employees within the areas of purchasing, production and logistics. The duration of all the interviews as well as the place and title of the respondents can be se in Table 2.1.
2.3.3 Documentation studies
The documents used, in this research, consisted of internal information regarding the com-panies businesses as well as their webpages. As suggested by Yin (2009), prior to the field visits, Internet searches where made regarding the companies’ background, products and organizational structure. This information gave the researchers a better background to the case companies and helped to establish credibility during the interviews.
With some exceptions, documentary information is likely to be used in every case study (Yin, 2009). This type of data can take many forms (Yin, 2009), especially due to the tech-nological developments that have been made, such as the Internet (Patel & Davidson, 2011).
2.4 Analysis of data
The aim of the data analysis is to describe, explain and then interpret the studied subject (Denscombe, 2010) in order to enable the researchers to answer their research purpose (Merriam, 2009).
Figure 2.3 Analyze of empirical data and theoretical data (Based on Stjärnström & Sundqvist, 2013, p. 10)5.
To be able to make the analysis needed to fulfill the purpose, both the empirical data and theoretical data have been used. The two types of data was first analyzed separately and then compered to each other, as can be seen in Figure 2.3. The empirical data has been analyzed alongside the collection, which is a common practice within qualitative research (Denscombe, 2010). In fact, Merriam (2009) says that this is a way of gaining more trust-worthy data. The cases have been analyzed individually and then compered to each other, which can be seen as what Merriam (2009) defines as ‘within-case analysis’ respectively ‘cross-case analysis’.
The researchers intended to use the analysis to find out how the method can be refined. This means that the refinement is based on theoretical data that also is supported by empir-ical data
2.4.1 Triangulation
The collected empirical data has been triangulated, both between different collection meth-ods but also between different companies and respondents. The data collected, through different data collection techniques, have therefore been compared with the data from the other data collection techniques within the same case company e.g. that statements from respondent is in line with documentation or if the facts provided by documentations could be observed in reality. The data from the different case companies have also been com-pared to each other in order to check for consistency between the different companies. The reason for doing this is to distinguish between company specific answers and answers that applies for all companies.
5 The figure is modified by the researchers.
These are the two major types of triangulation according to Williamson (2002), method tri-angulation and source tritri-angulation. The former type checks the consistency in the findings between methods, uniform results reveals a ‘true picture’ (Gillham, 2000). The latter type involves testing the consistency in information given by different people and/or on differ-ent occasions (Williamson, 2002).
2.4.2 Pattern matching
This research started by studying the CDP-method as well as literature on topics related to the method. These studies resulted in analytically developed conceptual models as de-scribed by Wacker (1998). The models are then compered to how the case companies worked with issues tied to the concept in order to illustrate them with empirical data. Therefore, the concepts can be seen as an expected outcome, a pattern, of how the case companies should work according to theory and empirical data as a mean to prove the concepts as observable or not.
This can be compered to the deductive pattern matching technique, according to the de-scription from Saunders et al. (2012) and is one of the most desired data analysis tech-niques in a case study research, according to Yin (2009).
2.5 Trustworthiness
To measure the quality of the conducted research it should be evaluated against certain cri-teria’s. Saunders et al. (2012) say that qualitative researchers can use the criteria dependabil-ity instead of reliabildependabil-ity, credibildependabil-ity instead of internal validdependabil-ity and transferabildependabil-ity instead of external validity.
The employed research design is described in this chapter, this is, together with an assess-ment the research designs effectiveness two ways to increase dependability according to Shenton (2004). The effectiveness of the design is not discussed in this part of the thesis, but instead this is discussed in the conclusion and discussion chapter of the thesis. Merriam (2009) states that a qualitative study conducted twice will not lead to the same results. De-pendability is therefore not a measurement on whether the study can be replicated by oth-ers, but rather a measurement on whether others can see that the results makes sense given the data collected (Merriam, 2009). To facilitate this, the researchers present the collected data and the questions asked during the interview, Appendix 2, to enable the reader to un-derstand how and why the empirical data was interpreted in the way it is. In order for the research to be credible and taken seriously it should fulfill the criteria of dependability (O’Leary, 2010).
During the research the description of case companies and the presented empirical data was sent to the corresponding respondent in order for them to provide comments. This was also done with results from the data analysis as well as the results. This helps to reduce the risk of researchers bias and misunderstandings and can be seen as an example of mem-ber checking in accordance to the definition from Carlson (2010). Guba and Lincoln (1989) describe this as the most important way of achieving credibility. The researchers have au-dio-recorded the interviews and made transcript summaries so that the data can be re-viewed several times, which according to Saunders et al. (2012) helps to reduce bias. Trian-gulation, both between method and sources, and pattern matching were used as previously described. These data analysis technique ensures credibility (Merriam, 2009; Shenton, 2004), even tough results from triangulation can be overestimated (Denscombe, 2010) and non-existing patterns claimed (Yin, 2009). Furthermore, the respondents were enlightened
that participating was voluntarily, which helps to ensure credibility (Shanton, 2004). The criteria of credibility therefore regards whether the researchers have “accurately recorded the phenomena under scrutiny” (Shenton, 2004, p. 64).
To enable the reader to see whether the presented result is applicable in their situation, an extensive description of both the methods used, and the context of the investigation is pre-sented. This is in line with suggestions from Guba and Lincoln (1989). They state that it is up to the reader to decide if the results are applicable to other contexts or not, in other words, the transferability of the research (Shenton, 2004). Furthermore, by using a multiple case study design the transferability of the research are enhanced (Ellram, 1996).
2.6 Ethical considerations
The researchers consider it important to discuss ethical considerations in a qualitative re-search, an opinion shared by Creswell (2003).
The researchers have no former experience or connection to the companies or the re-spondents within this research. However, the researchers have connection to Bäckstrand, author of Bäckstrand (2012) and developer of the CDP-method, in the sense that they are former students to her. This situation was a concern in early parts of the research since the presented result might point out flaws in the CDP-method. This has afterwards been seen as less of a problem as Bäckstrand welcomes critics and appreciates every chance to strengthen the method.
All respondents have been informed that they can be anonymous if they prefer and that participation is voluntary. The respondents have given the researchers their permission to use company specific information. However, some respondents have requested not to be referred to by name and therefore the company’s names are stated, but the respondents are referred to their title within the company. Furthermore, all interviews have been audio-recorded in consent with the respondent. Afterwards has the respondents been given a chance to edit out information before the publishing of this thesis, which is in line with Saunders et al. (2012) definition of informed consent.
3 Theoretical framework
This chapter begins with a short presentation of how the theoretical framework was constructed. This is fol-lowed by a description of the CDP-method. The reason is to offer the reader a chance to grasp and get a bet-ter understanding of the method, since it constitutes the core of this thesis. For a full description, the readers are referred to Bäckstrand (2012). This is followed by theories that are related to the CDP-method or will be used in the development of the CDP-method. These theories help the readers to understand the theories that the CDP-method derives from and how the method can be further developed.
3.1 Literature review
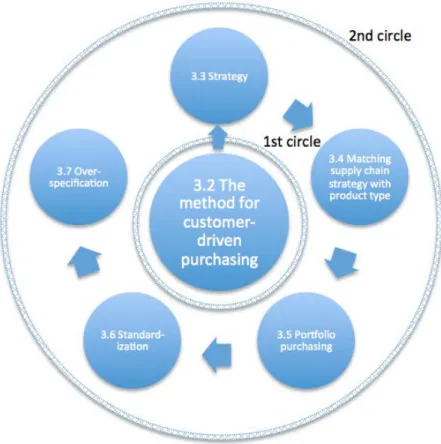
The literature review helped the research to make sure that the proposed research purpose had not been answered already, which is one of the goals with a literature review according to Knopf (2006). The search for literature has furthermore followed the suggestion by Knopf (2006), where the conducted literature review can be seen as two circles, illustrated in Figure 3.1.
Figure 3.1 The theoretical framework and its structure.
In the first circle there are studies and sources that directly address the research purpose, namely the CDP-method, presented by Bäckstrand (2012). The second circle is broader and considers studies and sources that are relevant or overlap with the research purpose. The second circle in this research where used to build up the understanding and argumen-tation for the presented conclusions. As can be seen in Figure 3.1 the second circle consist of theories regarding strategy, how to match strategies with different types of products, portfolio purchasing, standardization and over-specification.
3.2 The method for customer-driven purchasing
Figure 3.2 Flowchart of the CDP-method, with delimitation (Bäckstrand, 2012, p. 218)6.
The CDP-method, by Bäckstrand (2012) consists of twelve steps divided into three phases. In line with the research purpose and delimitation, only the two first phases will be de-clared here, as can be seen by the square in Figure 3.2. For more information regarding phase three (step 10-12), see Appendix 1.
The first phase consists of five steps and focuses on identifying and mapping the current situation for a product or product family. The first four steps focuses on the product and the items that it consist of while the supplier is included in the fifth step. The second phase consists of four steps and focuses on analyzing the information gathered throughout phase one. The purpose of the second phase is to identify supplier relationships to focus on and further analyze in phase three (Bäckstrand, 2012).
3.2.1 Step 1 – Identifying product structure and ‘Bill of material’
In this step a product family or product group is identified and selected for analyze (Bäck-strand et al., 2013). The product selected should be purchased continually and also be cus-tomizable in order to best benefit from the CDP-method (Bäckstrand, 2012).
Table 3.1 Example of layout of the BOM table (Bäckstrand, 2012, p. 221)7
Furthermore the product structure should be identified to reveal the order of manufactur-ing or assemblmanufactur-ing. The main purpose of the product structure is to provide a comprehen-sive illustration of the product. Here it is recommended to use the ‘Bill of material’ (BOM)8
6 The figure is modified by the researchers. 7 The figure is modified by the researchers.
8’Bill of material’ is another word for product structure (Mattsson, 2004) and specifies how a product is built
from raw materials and components, through manufacturing parts and semi-finished products to final manu-facture or assembly of a product (Jonsson & Mattsson, 2005).
since it can provide more detailed information regarding the product. As indicated by the example of a BOM in Table 3.1 the last level of the BOM indicates a purchased item. Ob-serve that an item can be sourced from multiple suppliers and that all suppliers should be listed (Bäckstrand, 2012).
3.2.2 Step 2 – Identify Supply lead-time for each item
The purpose of this step is to identify the lead-times for sourcing and manufacturing for the different items in the product (Bäckstrand, 2012). The BOM table from step one is now complemented with the manufacturing lead-time or purchasing lead-time, depending on whether the item is a make or buy item (Bäckstrand et al., 2013). This is made on item level for all the items that makes up the product (Bäckstrand, 2012). As can be seen in Ta-ble 3.2 four new columns are added from the first step.
Table 3.2 Example of layout of the lead-time table (Bäckstrand, 2012, p. 222)9
Regarding supply lead-time, the time used for planning is the one that should be employed. If there is any safety lead-time or time for quality control etc., this should be included un-der the column ‘additional lead-time’ (Bäckstrand, 2012).
Table 3.3 Example of the layout for the supply lead-time compilation table (Bäckstrand, 2012, p. 223)10
The items lead-times are then calculated by adding up the internal and external lead-time throughout the product structure. To increase the understanding a time phased product structure can be created. This step ends by creating a ‘supply lead-time compilation table’, where all the items are compiled and sorted in consecutive order based on their total lead-time (Bäckstrand, 2012). An example of a layout for the supply lead-lead-time compilation table can be seen in Table 3.3.
3.2.3 Step 3 – Differentiate forecast- from customer-order-driven items
In the beginning of this step the demand lead-time is identified. The demand lead-time might not been fixed, so in order to determine the lead-time historical data regarding cus-tomer’s required delivery times should be gathered (Bäckstrand, 2012).
9 The figure is modified by the researchers.
Table 3.4 Example of the supply lead-time compilation table, with the CODP (Bäckstrand, 2012, p. 224)11
The supply lead-time compilation table can than be updated with the CODP that divides forecast driven from customer order driven items (Bäckstrand, 2012), as exemplified in Ta-ble 3.4.
3.2.4 Step 4 – Differentiate generic from unique items
All items in the product structure, from a focal actors perspective, are now separated into customer-generics (CG), customer-unique (CU) and customer-order-unique (CoU) items. An CG item is included in products sold to several different customers whereas an CU item are included in products sold to one customer but quite frequently. Item used for a specific customer order are denoted CoU, these are considered to be used only in this par-ticularly customer order. This means that the concept of uniqueness derives from a cus-tomer perspective in the sense that a product can range from a generic (standard) to a spe-cialized product, unique for a particular customer order (Wikner & Bäckstrand, 2012).
Table 3.5 Example of supply lead-time compilation table, with CU and CoU (Bäckstrand, 2012, p. 226)12
The product structure from step one and the supply lead-time compilation table from step three are used once again and updated by highlighting CU and CoU items (Bäckstrand, 2012). An example of this can be seen in Table 3.5.
3.2.5 Step 5 – Differentiate make from buy items
Next step is to identify the purchased items, i.e. where there is an interaction with a suppli-er or not. Pure make items will be excluded from furthsuppli-er analysis in the CDP-method due to the lack of supplier interaction. Before there is any purchasing at all, the companies must decide on whether to make or buy the items. In this analysis all sub-assemblies and items that there is an opportunity to purchase or manufacture in-house is included. This infor-mation is then gathered in a make-or-buy table (Bäckstrand, 2012). Thereby is phase 1 of the CDP-method completed. The step presented next will start the second phase of the method.
3.2.6 Step 6 – Analyze items in the customization-perspective framework
In this step the supplier’s level of customization is taken into consideration, which already were done in step four for the focal firm. With this information in mind, all the purchased items can be positioned within the customization-perspective framework, see Figure 3.3. By doing this the items can be classified as having a logic or counter-logic flow for level of customization. A counter-logic flow is when the supplier has a higher level of
customiza-11 The figure is modified by the researchers. 12 The figure is modified by the researchers.
tion compared to the focal firm. On the other hand, in a logic flow, the uniqueness should increase, or be the same, from the beginning to the end of the supply chain (Wikner & Bäckstrand, 2012). A counter-logic flow thus implies that the supplier is exposed to a high-er degree of risk, regarding speculation. This risk is most likely to impact the price of the item as well as the supplier´s willingness of keeping the item in safety stock (Bäckstrand, 2012). The indication is therefore that, when there is a difference in the perception of uniqueness, the actor who experiences the lowest level of customization should be the one keeping the item in stock (Bäckstrand et al., 2013).
Figure 3.3 The customization-perspective framework (Bäckstrand, 2012, p. 228)13.
CG items are marked by green in the framework, CU items by yellow and the CoU by red. The level of customization at the supplier actor is marked on the left part of the cell, fol-lowed by the focal actors level of customization on the right part of the cell. The three cells with a counter-logic flow are positioned up in the left corner of the framework (Bäckstrand 2012). To increase the readability these scenario have been referred to as 1:1, 1:2 and 2:1 and are marked by a thick black line in Figure 3.3.
3.2.7 Step 7 – Analyze items in the certainty-customization framework
In this step all the purchased items are positioned in the certainty-customization frame-work. The purpose is to identify the level of certainty and the level of customization, from the focal actors perspective. The lead-times (identified in step 2) as well as the demand lead-time (identified in step 3) are used in this step. This information helps positioning the CODP in order to differentiate forecast driven items from customer-order driven items. Furthermore, information regarding the focal actors level of customization (identified in step 4) is used to identify the level of customization, i.e. CG, CU and CoU (Bäckstrand, 2012). The certainty-customization framework can be seen in Figure 3.4.
Figure 3.4 The certainty-customization framework (Bäckstrand, 2012, p. 229).
13 The figure is modified by the researchers.
3.2.8 Step 8 – Analyzing items in the CAP matrix
After the classification of level of customization (i.e. CG, CU and CoU) and level of cer-tainty (i.e. forecast or customer order driven) in step seven, the analysis is extended in step 8. In this step of the CDP-method, different order winners are assumed to appear pre-CODP and post-pre-CODP. Items purchased on forecast (pre-pre-CODP) are analyzed with effi-ciency focus in order to reduce cost, comparable to Kraljic (1983), according to Bäckstrand (2012). Items purchased on an customer order (post-CODP) should instead be analyzed with responsiveness focus (Bäckstrand, 2012). The presumed order winners impact on effi-ciency and responsiveness focus are illustrated in Figure 3.5.
Figure 3.5 Focus in the CAP matrix (Bäckstrand, 2012, p. 125).
This analysis is done in the ‘Competitive advantage based purchasing matrix’ (the CAP
ma-trix). The CDP-method only regards FD-CG, as can be seen in Figure 3.6, other scenarios are not investigated in the CDP-method.
Figure 3.6 Appropriate CAP matrix in different positions in the certainty-customization framework (Bäckstrand, 2012, p. 230).
3.2.9 Step 9 – Select supplier relationships to analyze
In this step a more qualitative approach is needed in order to select suppliers and supplier relations to further analyze. This step combine the data collected throughout the previous steps with expert knowledge regarding the supplier and the items. Aspects to consider are for example order volume, order frequency and current supplier performance (Bäckstrand, 2012).
If an item has been found in a counter-logic scenario, in the customization-perspective framework (step 6), the supplier of that item should be considered as a candidate for fur-ther analysis (Bäckstrand, 2012).
Based on the certainty-customization framework (step 7), if an item is positioned within the forecast driven CoU area, this supplier need immediate attention. If items are found in the forecast driven CU area and have a leveled demand pattern, these can be treated as a forecast driven CG items. If the demand pattern fluctuates they should be treated as a forecast driven CoU items, in other words in need of immediate attention. If there are any items with exceptional long lead-time (e.g. long supply lead-time in contrast to short de-mand lead-time) within the forecast driven CG area, the corresponding suppliers should be selected for further analyze. Furthermore a qualitative assessment needs to be carried out for suppliers of strategic items or bottleneck items that are purchased on forecast. Within the two customer order driven areas where unique items are located (i.e. CoD-CU and CoD-CoU), the suppliers of items with a exceptional long lead-time can be selected for analysis. These items have a risk of becoming forecast driven if the supply lead-times are enlarged which constitutes a risk since CoU and CU items should not be purchased on forecast. Furthermore, if there are items in the CoD-CG area that currently have a safety stock, investigations can be made if safety time would be more beneficial (Bäckstrand, 2012).
The suppliers selected for further analysis are then compiled in a supplier selection table. If the suppliers selected also supply other items to the focal firm, these are noted in the table as well (Bäckstrand, 2012).
3.3 Strategy
Strategies can have either internal or external focus (Mazzucato, 2002), were external de-scribes what services the organization can perform compered to competitors or which they can perform in a more efficient way. Internal focus brings out another perspective, namely information flow within the own organization and how new knowledge is created (Maz-zucato, 2002; Hines, 2004). The definition of strategy is, according to Gattorna and Walters (1996, p. 165), “a formula or a plan to compete efficiently in a marketplace”. This can be seen as
in-cluding both internal and external focus.
3.3.1 Levels of strategy
There are three principal levels of strategy (Lyons et al., 2012; Lysons & Farrington, 2012; Saunders, 1997), which are; ‘corporate’, ‘business’ and ‘functional’ strategies.
The corporate strategy is often formulated through vision and mission statements with the aim of addressing the long-term direction of the organization (Barnes, 2008). For organiza-tions with one business unit, the corporate strategy will be the same as the business strategy (Barnes, 2008; Lyons et al., 2012; Lysons & Farrington, 2012).
The business strategy derives from the corporate strategy and should be developed to ap-propriate business-level before implemented on the different business units (Hines, 2004). Porters view on business strategy is that companies can compete with cost leadership, dif-ferentiation or focus (Porter, 1985). If a focus strategy is used and a niche market identi-fied, cost leadership or differentiation strategies are probably used within this niche market (Hines, 2004; Porter, 1985).
Functional strategies derive from the business strategy and tend to focus on products and markets. They constitute of broad policies and plans for supporting of the long-term com-petitive strategy (Hines, 2004).
Figure 3.7 Framework for strategic alignment (Based on Lambert, 2006; Lyons et al., 2012, p. 5; Lysons and Farrington, 2012)14.
Many supply chain strategies falls into the category of functional strategies (Hines, 2004). Given modern definitions of supply chain management (e.g. Mentzer, DeWitt, Keebler, Min, Nix, Smith & Zacharia, 2001) one can comprehend that the supply chain strategy has influence on functions within the organization, such as purchasing, manufacturing and lo-gistics. A visual framework for the different levels of strategy as well as how they should be aligned is presented in Figure 3.7.
3.3.2 Alignment of strategies
Several scholars highlight the importance of aligning the companies overall business strate-gy to the functional strategies (e.g. Gattorna & Walters, 1996; Shavarini, Salimian, Nazemi & Alborzi, 2013). Porter (1996) also highlights this by stating that alignment of strategies protects the competitiveness of the companies’ capabilities. Alignment makes all functions work in the same directions and towards the same objectives. This makes it harder for
ri-14 The figure is modified by the researchers.
vals to copy the strategy and thereby makes it more sustainable, which ultimately brings success for the company. Teece, Pisano and Shuen (1997) share Porters view and sees complementing activities as one way of protecting activities and routines form being repli-cated or imitated.
Hines (2004) presents an example of misalignment of strategies. He says that a company can pursue a sourcing strategy that focuses on global sourcing and at the same time have a corporate strategy that focus on local sourcing. This can provide problems since infrastruc-ture is built for local sourcing and that carrying out global sourcing on the operational level might be hard to accomplish. Kaplan and Norton (2004) provide an explanation of why misalignment occurs. They state that managers often look at their own function in isolation to other functions in the organization, this lack of a holistic view may lead to misalignment between strategies.
Gattorna and Walters (1996) produce yet another reason for the importance of strategic alignment. They start their argumentation by a top-down approach, by aligning the busi-ness strategy to customer requirement. This strategy needs to be broken down to function-al strategies in accordance to the business strategy. If this function-alignment fails, the functionfunction-al strategy that drives organizational behavior would not provide the output that customer’s want.
To summarize where strategic alignment must exist is; between customer requirements and corporate/business level strategy (Gattorna & Walters, 1996; Hines 2004; Lysons et al., 2012), corporate/business level and functional level (Hines 2004; Porter 1996), between, and among, the functional level strategies as well as between organization and strategy (Gattorna & Walters, 1996; Lysons et al., 2012).
3.4 Matching supply chain strategies with product type
The first step, according to Fisher (1997), in formulating a supply chain strategy is to con-sider the nature of the demand for the products supplied by the company. The products can be classified as either primarily functional or primarily innovative. Functional products satisfy basic needs, have a stable demand and long life cycles. The margins are low and therefore it is important to minimize costs. In comparison innovative products satisfy a higher need, have an unstable demand and a short life cycle. The margins are high and therefore companies should focus on maximizing its profits. Because of the unstable de-mand it is important to respond quickly to unpredictable changes in dede-mand in order to minimize stock outs, markdowns or obsolete inventory (Fisher, 1997).
Having determined the nature of the demand, for the company’s products, the next step is to decide whether or not company’s supply chain is physically efficient or market respon-sive. The main purpose for an efficient supply chain is to achieve lowest possible cost through efficiency, whereas the main purpose for a responsive supply chain is to respond quickly to avoid stockouts (Fisher, 1997). The lead-time focus for an efficient supply chain is to reduce them as long as it doesn’t increase costs. For a responsive supply chain, lead-times should be reduces through aggressive investments. Supplier selection in a efficient supply chain should be based on cost and quality criteria’s. However, for an responsive supply chain speed, flexibility and quality should be the criteria’s. If the products are func-tional the company’s supply chain should be efficient. In contrary, if the products are inno-vative, the supply chain should be responsive (Fisher, 1997).
Chopra and Meindl (2007) gives two rules regarding supply chain strategies, where the first is that there is no right supply chain strategy for all situations. However, the other rule says that there is a right supply chain strategy for any given business strategy. Hines (2004) states that Porter´s (1985) cost leadership strategy includes Lean purchasing and Lean pro-duction to achieve efficiency. Differentiation, another of Porters business strategies, would include agile production to enhance flexibility. This reveal a connection between Porters (1996) view on business strategy and Fischer’s (1997) view on supply chain strategy.
Figure 3.8 Finding the Zone of Strategic fit (Chopra & Meindl, 2007, p. 32).
Borgström and Hertz (2011) state that the conclusion that can be drawn from Fisher’s (1997) model is that a strategy is only right for the supply chain if it matches the product characteristics. One criticism that’s been made about Fisher’s model is that most products cannot be classified as either innovative or functional (Borgström & Hertz, 2011). Chopra and Meindl (2007) instead see these two as extremes of a continuum where the demand is more or less easy to predict. If the uncertainty from customer demand increases, then the responsiveness of the supply chain needs to increase as well. This is done in order to stay in the zone of strategic fit, illustrated in Figure 3.8.
3.4.1 Impact of the customer order decoupling point
A frequently used concept for capturing the operations strategy is the CODP that divides the supply chain operations into two parts (Wikner & Rudberg, 2005a). The positioning of the CODP is vital for to the decision when designing a supply chain (Yang & Burns, 2003) and should be used strategically since operations upstream and downstream of the CODP shows different characteristics (Olhager, 2003).
Figure 3.9 The CODP (Based on Bäckstrand, 2012; Rudberg & Wikner, 2004; Wikner & Rudberg, 2005a).
Hoekstra and Romme (1992) defines the CODP as the separation of the part of the supply chain focused on satisfying the customer and the part of the supply chain based on plan-ning. Another common definition of the CODP is the point in the flow of goods that
sep-arates forecast driven production (speculation) from customer order driven production (Giesberts & van den Tang, 1992), as can be seen in Figure 3.9. The further upstream the CODP is positioned, in the supply chain, the more activities can be carried out against cus-tomer orders (higher certainty). Vice versa the further downstream the CODP is positioned the more activates have to be carried out under forecast (uncertainty) (Rudberg & Wikner, 2004; Wikner & Rudberg, 2005a). By moving the CODP downstream, closer to the cus-tomer, the risk of both stock-outs and holding excess stock is reduced (Davies, 1993). The CODP is mainly used as a tool for analyzing the material flows as well as the activities associated with production (Wikner & Rudberg, 2005a). One of the reasons for the CODPs important is that the upstream activities can be optimized, based on the forecast, and are therefore independent of the irregularities in demand. Another reason for the CODPs importance is its positioned at the main stock point, from which deliveries to cus-tomers are made (van Donk, 2001; Mason-Jones, Naylor & Towill, 2000a). In line with this, Wikner and Rudberg (2005b) state that the CODP can only be positioned at a buffer be-tween processes or activities.
3.4.2 Supply chain strategy paradigms
Lean and agile strategies are often referred to as two opposite paradigms. However, they share the common objective of meeting the customers demand at the least total cost (Goldsby, Griffis & Roath, 2006). Combining leanness (efficient) and agility (effective) in a supply chain via the strategic use of a decoupling point has been termed leagility (Naylor, Naim & Berry, 1999), and is a hybrid supply chain strategy (Christopher, 2000; Christopher & Towill, 2000; Huang, Uppal & Shi, 2002).
As mentioned earlier the CODP divides the supply chain into two parts (Wikner & Rud-berg, 2005a). The downstream part of the CODP shows highly variable demand with a large variety of products, whilst the upstream part is smoothed with a reduced variety. It can therefore be argued that a lean paradigm can be applied to the upstream supply chain as products are standard and the demand is more predictable. After the CODP an agile paradigm should be used due to the fact that the product variety have increased and the demand is unpredictable (Huang et al., 2002; Mason-Jones et al., 2000a; Naylor et al., 1999). The CODP acts as a buffer between the fluctuating demand for a wide variety of products and the leveled production schedule for a smaller variety of components (Naylor et al., 1999). A firm should therefore try to postpone the point of product differentiation until the last possible moment in the supply chain (Huang et al., 2002).
The leagile supply chain strategy enables a company to have a cost-effective supply chain upstream of the CODP and a high service level, providing exactly what the customer de-mands, downstream the CODP (Mason-Jones, Naylor & Towill, 2000b). In that sense, the leagile paradigm helps companies leverage the powers of each paradigm (Mason-Jones et al., 2000b), thus bringing together the best of both paradigms (Christopher & Towill, 2000).
Christopher et al. (2006) states that companies replenishment lead-times have a critical im-pact on their responsiveness to demand. Moreover the products (standard or special) and the demand (stable or volatile) are important dimensions. The two latter dimensions will tend to be related and are therefor merge together as one dimension. The two axis of the matrix are therefore; ‘supply characteristics’ (Short or long lead-time) and ‘Demand Charac-teristics’ (Predictable or Unpredictable). The matrix proposed by Christopher et al. (2006) is illustrated in Figure 3.10 and defines four suggested supply chain strategies.
Figure 3.10 How demand and supply characteristics determines supply chain strategy (Christopher et al., 2006, p. 283).
The models presented by Fisher (1997), Mason-Jones et al. (2000a) and Christopher et al. (2006) emphasizes that one should select a supply chain strategy that best matches both the supply characteristics (Efficiency, responsiveness and lead-time) as well as the demand characteristics (type of product, volume, variety, variability and requested lead-time) (Hil-letofth, 2012).
3.5 Portfolio purchasing
All the items and material purchased by a company are not the same. Some are more im-portant and critical to the firm’s survival than others. Hence different procurement strate-gies, tactics and resources are to be used for different items (Coyle, Langley, Novack & Gibson, 2013). The quadrant techniques, matrix or portfolio model’s in purchasing pro-vides useful inputs for supply management decision makers. There has been much pub-lished research on portfolio models within purchasing (e.g. Bensaou, 1999; Olsen & Ellram, 1997 and Turnbull, 1990) (Nellore & Söderquist, 2000). However, the model by Kraljic (1983) is considered to be the first description of strategic purchasing (Beer, 2006) and a major part of the development of purchasing and supply chain management (Gel-derman & van Weele, 2002).
In 1983 Kraljic (1983) published a simple but yet effective framework for collecting mar-keting and corporate data, forecasting future supply scenarios and identifying available pur-chasing options as well as for developing individual supply chain strategies for critical items and materials. This purchasing model aims at minimizing the supply risk and to make the most out of the company’s buying power (Kraljic, 1983).
According to Kraljic (1983) a company’s need for supply chain strategy depends on two factors; Importance of purchasing and complexity of supply market. By using both these factors a matrix can be formed, as illustrated in Figure 3.11. The aim of this matrix is to identify which suppliers to develop a long-term relation with and which suppliers to keep at arm’s length (Beer, 2006).
The profit impact of a given item is defined in terms of the volume purchased, percentage of the total purchase cost, impact on product quality or impact on business growth. Supply risks is than assessed by availability, number of suppliers, competitive demand,
make-or-buy opportunities, storage risk and substitution possibilities. By using these criteria, a com-pany can sort all their purchased items into four categories; leverage, strategic, non-critical and bottleneck, as can be seen in Figure 3.11. Each of these categories needs a distinct pur-chasing approach. All these approaches differ regarding decision level as well as infor-mation required and main tasks assigned to them (Kraljic, 1983). Olsen and Ellram (1997) as well as Gelderman and Semeijn (2006) has investigated the same type of classification and provides information on how companies should handle the items.
Figure 3.11 The Kraljic-matrix (Kraljic, 1983, p. 111).
Leverage items should be purchased by optimized order volume, companies should strive to exploit their full purchasing power for these kind of items (Kraljic, 1983). The focus, ac-cording to Olsen and Ellram (1997) should be to consolidate the volumes over several product families and obtain a good price for these items. Gelderman and Semeijn (2006) state that cost savings is perused for this kind of item and that suppliers should be evaluat-ed against this criteria.
Strategic items and their suppliers should be given higher attention and the aim is to build long-term relationships with these suppliers (Kraljic, 1983; Olsen & Ellram, 1997). Howev-er, Gelderman and Semeijn (2006) mentions that is can be hard to accomplish a strategic partnership with these suppliers given the suppliers often prevailing upper hand in the power balance.
Non-critical items should be purchased through efficient buying and optimized order vol-ume. This is done to find the most economic order quantity (Kraljic, 1983). For non-critical items Olsen and Ellram (1997) state that the buying company should strive towards supplier relationships that basically handle themselves. Gelderman and Semeijn (2006) has a similar suggestion, namely to implement e-procurement for these types of items. Olsen and Ellram (1997) as well as Gelderman and Semeijn (2006) state that the companies should use these examples to reduce administrative costs.
Bottleneck items should be handled with the main focus of securing supply of material, gaining a lower price for these items is not the focus in purchasing situations (Gerlderman & Semeijn, 2006; Kraljic, 1983). These items are described by low strategic value and are at the same time difficult to manage (Olsen & Ellram, 1997). This is not a favorable situation and should therefore be avoided. An example of how to move from this situation is to work towards standardization (Geldermann & van Weele, 2002; Olsen & Ellram, 1997).