TVE 14 017 maj
Examensarbete 15 hp
Juni 2014
Passive houses in Uppsala
A study of a new passive solar designed
residential area at Ulleråker in Uppsala
Jonas Alenius
Erik Arons
Teknisk- naturvetenskaplig fakultet UTH-enheten Besöksadress: Ångströmlaboratoriet Lägerhyddsvägen 1 Hus 4, Plan 0 Postadress: Box 536 751 21 Uppsala Telefon: 018 – 471 30 03 Telefax: 018 – 471 30 00 Hemsida: http://www.teknat.uu.se/student
Abstract
Passive houses in Uppsala
Jonas Alenius, Erik Arons, Alexander Jonsson
Uppsala kommun has acquired the land at Ulleråker and the plan is that it should be the starting point for the new southeast district. The area is supposed to include 8000 new homes. The idea is also that the area should be a new modern energy-efficient district. This report examines how much energy that could be saved by using a passive house integrated design instead of todays standard. Simulations in Matlab regarding local energy utilization has also been done. Calculations show that the passive house integrated design generates in a total energy saving of 49 per cent compared to the standard house. The local electrical production comes from solar cell panels placed on the roofs and facades and the installed power is 19.8 MW. The production covers 80.3 per cent of the total energy demand or 91.4 per cent of the electrical demand per year. But the systems production is mismatched to the local demand for electricity.
ISSN: 1650-8319, UPTEC STS14 017 Examinator: Joakim Widén
Ämnesgranskare: Magnus Åberg Handledare: Anders Hollinder
Acknowledgment
We would like to express our most sincere gratitude to our supervisor Magnus Åberg for the support and technical assistance during this project. Furthermore a special thanks to our lead designer Anna Alenius who has spent a lot of hours and extra work in
assisting us with the creation of the building images in this thesis. Thirdly we would like to express our gratitude towards Joakim Widén for his aid concerning the solar energy calculations. Also, we would like to thank Anders Hollinder at Uppsala kommun who provided us with the vital information which was the base for this project.
List of terms
Standard house - Is defined by BBR’s, the National board of building and housing,
recommendations for new and rebuild apartment buildings
Passive House - Is a standard form of a house that consume as little energy and
electricity as possible, in an environmental perspective
Zero-energy house - The same as a passive house but also that the sum of the
delivered energy to the building should be equal to the sum of the delivered energy from the building in a year
U-value - Is a measure of heat loss in building elements Wh - Watt-hour, is a term for energy
Solar Panel - Is a panel with solar cells that absorb the energy generated from the sun
Heat Load - Heat produced by humans, electrical appliances etc. COP - Coefficient of Performance is a ratio of cooling or heating
Table of contents
1. Introduction ___________________________________________________________ 5
1.1 Aim ________________________________________________________________ 5 1.2 Limitations __________________________________________________________ 6
2. Background ___________________________________________________________ 7
2.1 Uppsala kommun, goals and visions _______________________________________ 7 2.1.1 The new Southeast district __________________________________________ 8 2.2 Passive house _______________________________________________________ 8 2.2.1 Swedish specifications for passive houses _____________________________ 9 2.2.2 Zero-energy house _______________________________________________ 10 2.3 Solar cell and solar panels _____________________________________________ 10 2.4 Internal heat gains ___________________________________________________ 11 2.4.1 Humans _______________________________________________________ 11 2.4.2 Lamps _________________________________________________________ 11 2.4.3 Household appliances ____________________________________________ 12 2.5 District heating ______________________________________________________ 12 2.6 Geothermal heating __________________________________________________ 12 3. Methodology __________________________________________________________ 13 3.1 Model Layout _______________________________________________________ 13 3.2 Data ______________________________________________________________ 13 3.2.1 Building layouts _________________________________________________ 13 3.3 Energy demand calculations ___________________________________________ 16 3.3.1 Hot water demand _______________________________________________ 16 3.3.2 Heat demand and U-values ________________________________________ 17 3.3.3 Household electricity _____________________________________________ 18 3.3.4 Solar cell panel simulations ________________________________________ 19 3.3.5 The capacity for the solar panels ____________________________________ 24 3.4 Sensitivity analysis ___________________________________________________ 24
4. Results ______________________________________________________________ 25
4.1 Differences between standard and passive houses __________________________ 25 4.2 Yearly analysis ______________________________________________________ 27 4.3 Monthly analysis _____________________________________________________ 28 4.4 Daily analysis _______________________________________________________ 29 4.5 Sensitivity analysis ___________________________________________________ 30 4.5.1 U-values _______________________________________________________ 30 4.5.2 Heat recycling or not regarding the ventilation losses ____________________ 30 4.5.3 Angle of the solar cell panels _______________________________________ 31
4.5.4 Orientation of the solar cell panels ___________________________________ 31 4.6 Summarizing discussion _______________________________________________ 31
5. Conclusion ___________________________________________________________ 32
References ________________________________________________________________ 33 Appendix A ________________________________________________________________ 37
5
1. Introduction
Most cities in Sweden are growing rapidly and build new residential areas or rebuild existing areas. Uppsala is no exception as the city continues to grow and more people move to the city every year and the demand for housing increases. The county
administrative board believes that in the forthcoming 5 years there will be a need of 15,000 new homes in the municipality. Therefore, they have now begun several construction projects in the city to satisfy these requirements.[1]
As we are expanding our cities, problems concerning our energy and climate become a more important issue across the globe for each day. We have to become more energy efficient and implement an effective energy consumption in our communities. Uppsala kommun has set a number of environmental goals to be accomplished in order to reduce the city's emissions and energy needs to achieve the vision of a sustainable community. To fulfill these environmental goals, a number of residential areas, planned in
accordance with these goals, will be built.[2]
The European Parliament has stated a directive that all new buildings shall be nearly zero-energy buildings by 31 December 2020 and 31 December 2018 for buildings owned by public authorities.[3]
One starting point for this is the ongoing project at the rural area around Dag Hammarskjölds väg where it will be built approximately 15,000 new residences. Uppsala kommun now has the chance to set new directive that Uppsala will follow in the future and hopefully also be a guide and road model for other cities in Sweden.
1.1 Aim
The aim of the project is to estimate to what extent the new residential areas at Dag Hammarskjölds väg could become climate neutral. This is possible by calculating the energy that will be needed, both for heating and electricity, and compare with the
potential electricity that can be produced locally. The hot water and heat demand will be supplied by a geothermal heat pump. In order to examine which parameters that can be improved, a sensitivity analysis will be done regarding the electrical production and the energy consumption in the planned construction area.
The following questions will be discussed in the project report:
How much can the energy consumption be reduced by using passive house design instead of todays standard?
In what extent can the solar energy utilization match the consumption annually, monthly and daily? Can the passive houses fulfill the requirements for zero-energy houses?
6
1.2 Limitations
The project is focused on the energy consumption after construction and does not present any figures for the energy needed during construction. No aspects considering the local ecosystem and any eventual harm to local wilderness or wildlife which can occur during construction will be made. Neither will there be any economic aspects in our analysis. Furthermore the project does not include any calculations on emissions from material production of e.g. solar cells.
7
2. Background
2.1
Uppsala kommun, goals and visions
In 2011 Uppsala kommun made a strategy plan to transform the municipality to a climate neutral area in the forthcoming 40 years. To achieve that they have set a couple of long-term goals that hopefully will end up to reduce the average amount of carbon dioxide emissions per capita. In 2050 that average amount should be lower than 0.5 tonne per capita, compared with the value 2012 which was 6.2 tonne.
In the time plan shown in Figure 1 there are milestones for every decade until 2050, when the goal should be reached. As displayed in the graph, the emissions from energy
and transport shall be almost absent.[4]
Figure 1: Emissions of greenhouse gases per citizen in the municipality of Uppsala (Carbon dioxide equivalents, CDE) [4]
In 2014, as a follow-through to the strategy plan from 2011, Uppsala kommun set eight new milestones to achieve before 2023. These will work as guidelines towards the main goal in 2050. Three of these goals concerns the energy consumption and utilization for the households in the municipality. The first one is that the heat demand shall be satisfied with energy that come from renewable and climate neutral sources. Vattenfall AB will be a main participator in this given that they have a huge role in the heat supply for Uppsala.
Next milestone for Uppsala is that they have set the goal for 2020 that solar energy shall reach an effect of 30 MW. That number will later increase to 100 MW ten years later. To achieve that, 10 per cent of the total roof area in Uppsala has to be covered with solar cell panels. However, that is just if all the solar cell panels are located on the roof and not on any other places. But so far there are none such plans known.
8
The third milestone is to promote a sustainable construction and management of new buildings. The fact that the number of citizens and demand for new households
increases in Uppsala this is an important part of the solution to reach the final goal. [5]
2.1.1 The new Southeast district
Uppsala kommun are now planning a new district located along Dag Hammarskjölds väg, the district is located as shown in Figure 2. The total number of new residential buildings in the area will be approximately 15,000 and in Ulleråker and Malma backe, also marked in Figure 2, that number are 8,000. Ulleråker is the first area to be built and the planning has begun. The aim of this new area is to build a energy efficient and environmentally sustainable district.[6]
Figure 2: The planned residential area along Dag hammarskjöld väg
2.2 Passive house
Today the construction sector improve every year. The building techniques are better than they were before and the houses are much more energy efficient. A well known standard are now passive houses. [7] The idea about passive houses started in Germany in the 1990s where they thought it would be able to build houses without radiator systems if the thermal insulation was good enough.[8 ] Now there are houses fulfilling
9
the passive houses standard all around the world. But many locations has different specification to follow due to the differences on the climate.[9]
The main characteristics of passive houses are the low U-values which is a measure of heat loss in different building elements, such as roof, floor and wall. The U-value for the element are often expressed in a maximum value where a lower value representing a more energy effective construction.[10]
So the philosophy for passive houses is about minimizing the heat loss through the elements, building an air-tight construction that are primarily heated by passive solar gain and internal heating from people and electrical equipment. Another important part in the passive house design is the ventilation. With mechanical ventilation, which is an old system, the air exchange thru an air flow and there are huge energy losses. Instead passive houses uses a system called FTX, explained in Figure 3, where the air flows thru a heat exchanger before it leaves the system. These kind of systems often has an heat recovery efficiency at 80 per cent minimum. [11]
Figure 3: FTX ventilation system[12 ]
With this system the house can get a good indoor air quality and a low heat demand without the need to recirculate the air or modify the thermal comfort.[13]
2.2.1 Swedish specifications for passive houses
The Swedish model for passive houses follow the specifications set by the Swedish center of energy effective buildings. They have now published a revised documentation called Feby12 with definitions and requirements for passive houses.
10
Requirements for the municipality of Uppsala: A maximum heat loss coefficient of 15 W/m2
Maximum energy consumption (heat and water) of 25 kWh/m2
for houses with electrical heating and 50 kWh/m2 for non electrically heated.
The air leak thru the building elements shall not exceed 0.3 l/s m2
at a pressure difference of 50 Pa.
The maximum U-value for the total area of windows and doors shall not exceed 0.8 W/m2 K.
[14]
2.2.2 Zero-energy house
The main difference between a zero energy house design and a passive house design, is that a zero energy house also has the attribute that the sum of the delivered balanced energy to the building should be less or equal to the sum of the delivered balanced energy from the building in a year, equation (1). The zero-energy house is not to be mistaken for the nearly zero-energy building which is a directive from the European Union and only takes the annual energy production and consumption into account. The concept of a zero-energy house, in a comparison to a nearly zero-energy building, can be applied at a monthly and even daily basis.[15]
(1)
District heating
Delivered energy, spare energy as biofuel, natural gas and so forth, to or from the building
Produced electricity delivered from the building Electricity delivered to the building
2.3 Solar cell and solar panels
Solar cell panels are made of solar cells and produce electricity, they are usually fixed on the building’s roof together with a power inverter. Solar cells convert the energy from the sun to pure electricity, its convert from DC to AC and connecting the
electricity to the grid. In a building with solar cells the solar energy system is connected to the electrical system but the buildings electrical system is also connected to the main grid. This means that unless the electricity from the solar cells is not used it
automatically ejects to the main grid and can be used by other electricity customers.[16] This extra electricity can be sold to a power company and, although this is not an easy task, more and more power companies are willing to buy or use this extra electricity [17]. It is not possible to cover the whole building’s electricity needs with just solar cells, therefore it is also vital to have a substitute when the sun is not shining. Most of
11
the solar cell panels have an efficiency of 10-15 per cent but Vattenfall AB have solar cell panels with an efficiency of 17 per cent.[16]
What requirements are significant for a house to make it appropriate for solar cells? At least 13 m2
free space on the roof of a house or a garage The roof surface should face south, southwest or southeast The surface is free of shadows
The surface has a angle between 0 - 60 degrees. Others angles could work but the assembly and the effect is little different
Location of an power inverter close to the system [16]
When comparing solar cells and panels with solar heating the latter has a better efficiency. The big difference is that it is not necessary to convert the energy to
electricity in the same way. Instead a solar thermal system is used which heats the water with the sun and solar cell panels. The hot water can be used for domestic hot water or as an addition to the heating in the house. [18]
2.4 Internal heat gains
The heating in a house does not only derive from the internal heating system, i.e.
radiators. Other factors also contributes to the heating in residences e.g. the internal heat delivered from living beings, for example humans and dogs but also household
appliances. An example of how much heat that can be delivered from both living beings and household appliances can be viewed below.
2.4.1 Humans
In Uppsala the average index of persons per household is 2,22 and [19] the internal heat gained from human presence is about 1 W/kg. This means that if we assume the average weight of an average adult to be 75 kg it leads to a emission of 75 W ,resulting in 270 kWh heat.[20] However since an adult is not likely to spend all their time inside their house, the calculated contribution of an adult is 47 W, with respect to how many hours a human spends at home, resulting in 169.2 kWh heat. [21]
2.4.2 Lamps
An average living room in Sweden has around six to eight lamps spread around the room, and a bedroom can be assumed to have around two to five. This leads to the calculation of a regular sized apartment ,1½ ROK to 2 ROK, to have around eight to 13 lamps in their home. By taking the mean value of that, we have an average energy consumption of (a normal lamp = 40 W): W_el = 10*40 W = 400 W.[22]
12
2.4.3 Household appliances
Below follows the heat value from different ordinary households appliances that can be found in a regular Swedish home.
Refrigerator: A standard new refrigerator: 100 W Freezer: A standard new freezer: 120 W
dishwashing machine: 2000 W Microwave: 1500 W Coffee machine: 800 W Stove: 1500 W Vacuum Cleaner: 1000 W Oven: 3000 W
In our calculations and simulations an average value of 3.5 W/m2 is used where all the different heat loads are taken into consideration. This value represent the alternating time which e.g. different appliances are turned on, or the amount of time a human or animal spends in the simulated buildings.[23]
2.5 District heating
More than half of the heat demand in Swedish homes and buildings is covered by district heating and it is also the most common form of heating in Sweden. [24] In Uppsala almost 95 per cent of all multi-dwelling houses heat demand is covered by district heating. [25] In many ways district heating is good for the environment. In the production they use waste from woods, households and also heat loss from the sewage treatment plant in Uppsala, this waste should in other cases get lost. The air have been much cleaner since cities started to use district heating instead of households and other buildings use their own boiler. [26]
Vattenfall AB and their district heating plant in Uppsala is not in this moment involved in the project in the area of Dag Hammarskjöld, but Vattenfall AB says that they have made an offer. New buildings and apartments in Uppsala are normally connected to the district heating system.[27]
2.6 Geothermal heating
A geothermal heat pump uses solar energy stored in the ground. The system collects the energy via boreholes that are between 59 to 200 meters deep and 20 meters apart. In these boreholes a refrigerant fluid circulates within the tubing and absorbs heat. The fluid is then compressed and the temperature are raising. The heat is then removed from the fluid and it recirculate into the ground. [28]
Most geothermal heat pumps have a COP (coefficient of performance) about 3 to 6, which means that the pump requires 1 kWh of electricity to produce 3 to 6 kWh of heat.
13
The amount of energy that can be produced depends on the area but the most systems has an effect about 30 to 50 watt per meter borehole. [29]
3. Methodology
Before executing the simulations, calculations were done regarding how to optimize the number of different houses which will be constructed and how many apartments in each house in order to meet the goals from Uppsala kommun. Calculations and some
assumptions regarding the internal heat load for every house were also made and the simulations concerning the energy and electricity demand were made regarding those calculations.
3.1 Model Layout
The purpose of the model can be divided into three separate parts. The first part
calculates the energy- consumption and difference of a house built with the construction norm of today with a house built with the norm of a passive house. The second part of the model is to evaluate the possible solar energy utilization capability from both the roof and the walls of the different kind of houses. The third part is to visualize the hot water demand of the entire district.
In order to solve and simulate the adopted theories the technical computing program Matlab has been used for the calculations and simulations. In order to get an overview regarding the different types of houses that will be build, a model for every type of house in the area has been constructed and the u-values for the construction material, for example the windows, wall, doors etc, have been calculated. The respective area for the roofs of the different kinds of complexes have also been taken into consideration in the equations. The calculations about how much space that can be optimized for the roof and walls and used for solar cells and panels have also been done. A singular model has been established on every type of house, four storey, six storey and townhouse, and the assumption that these houses will look the same and have the same u-values and so on, has been made.
3.2 Data
The data used for Matlab and the simulation runs are presented in this section.
3.2.1 Building layouts
When this report was constructed no specific guideline was yet regarding the visual and technical specifics concerning the houses that will be built, although an idea had been formed. For the simulations several assumptions were made regarding the compositions of different building types, as stated before in the previous section, and three different
14
versions were made: A townhouse, a four storey building and a six storey building. Two of these three versions, the four and six storey buildings, also had a alternating version where solar cells and panels were placed on the walls as well as on the roof.
The townhouses were simulated with a length of 30 meters, a width of 15 meters and a height of 6 meters at its lowest point. The roof is tilted with a 15 degree angle. The townhouses all have 22 windows at each floor and a area of 1.44 m2 for each window. 8 doors have been placed on the bottom floor with an area of 2.2 m2 each. All townhouses have solar cell panels placed on its roof and more information concerning the solar cell panels will be introduced in section 3.1.4.
Figure 4: Sketch showing how the townhouses with solar panels on the roof might look [30]
The four and six storey buildings were simulated with a length of 60 meters and a width of 15 meters. 36 windows were placed on every floor and each floor have a height of 3 meters. Every building have 6 doors on the bottom floor and the doors and windows will have the same area as the doors and windows of the townhouse. The roof is tilted with a 15 degree angle. There are two versions for the four and six storey buildings. The first version, which is the same for both the four and six storey building, have solar cell panels placed on the roof and the technical specifics will be introduced in section 3.1.4.
Figure 5: Sketch showing how the four storey building with solar panels on the roof might look [30]
15
The second version has not only solar cell panels on the roof but on the long wall as well. The big difference in this version is the height of the four storey building and the six storey building where the latter have a larger area on the walls. The technical specifics will be introduced in section 3.1.4
Figure 6: Sketch showing how the six storey building with solar panels on the walls and roof might look [30]
The overall adoption concerning the different type of houses is that they are all supplied by geothermal heating using a heat pump with a COP coefficient of 4. The geothermal heat pumps are calculated to cover the whole areas heat and hot water demand.
Table 1: The calculated building plan over the area
Type of house Number of houses Apartment per building Average apartment area (m2) Apartments Six storey building 35 90 60 3150 Four storey building 77 60 60 4620 Townhouse 30 8 90 240
This give a number of 8010 apartments and around 17780 inhabitants, considering that the average index in Uppsala is 2,22 people per household. [31]
16
3.3 Energy demand calculations
3.3.1 Hot water demandFigure 7: The daily average hot water demand during a year.
This graph, figure 7, is a simulation over the variation of the total hot water consumption in the area of Dag Hammarskjöld, it describes the whole areas consumption during a day for all houses. [32]
Table 3: Consumed hot water and the electric demand of heating up the water
Type of house Consumed hot water per house and day (liters)
Energy demand of heating up the water per house and day (kWh)
Energy demand of heating up the water per square meter of a house and year (kWh/m2, year)
Six storey building 4976 273.7 18.5 four storey building 3318 182.5 18.5
Townhouse 442.3 24.33 12.33
Calculations present in table 3 is based on that a person consume 9.09 m3 hot water per year, that means that the average household in the area consume 20.18 m3 hot water per year. The total energy demand for heating up the hot water in the area is 8.89
17
3.3.2 Heat demand and U-values
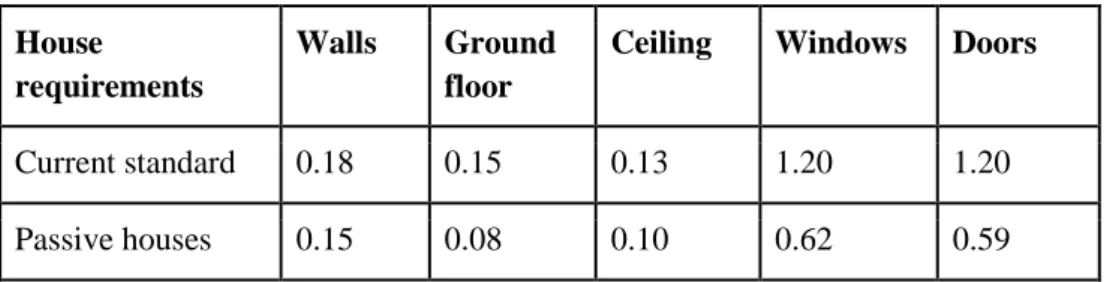
The specific U-values for the different type of houses are presented in Table 2. The values for the standard houses are based on the recommendations of today from the Swedish National Board of Housing, Building and Planning. [35]
The values for the passive houses are lower than the requirements in all building elements except the walls. As the plan is to build houses of concrete the optimal value for the walls are 0.15, depending on that the thickness of the walls are about 50
centimeters and leaves a limited space for insulation. All values for the passive houses are from different retailers in Sweden.[36-40]
Table 2: The U-values for standard houses and passive houses
House requirements
Walls Ground floor
Ceiling Windows Doors
Current standard 0.18 0.15 0.13 1.20 1.20 Passive houses 0.15 0.08 0.10 0.62 0.59
Internal heat gains
When combining the information in section 2.5 and taking into consideration what kind of impact these heat loads will have it is important to acknowledge the time which these appliances, humans and animals are in the house. The resulting average heating power in combination with the size of the houses that this report will process sums up to 3,5 W/m2. This average value is an assumption with respect to energy efficient
appliances.[32]
Ventilations losses
The ventilation losses is an important factor when calculating the heat loss or gain and the equations can be viewed below. The efficiency of the FTX system for the passive houses is 85 per cent, equation 2, and for the standard house it is 60 per cent, equation 3. The reason there are different efficiency between the passive houses and the standard houses is that the air leakage in a standard house is higher than that of a more isolated house, a passive house, thus the efficiency is lower for a standard house.
Ventilation losses with heat recycling for the passive house (W/K) Ventilation losses with heat recycling for the standard house (W/K)
18
Air change per hour constant for the central which is 0.425 (oms/h) Internal air change per hour constant which is 0.075 (oms/h) Volume for the specific house (m3)
density times air density constant Cp
The difference between the constant and the constant in the equations above is that represent the fresh air ventilation in the houses while is the ventilation loss through extract ventilation e.g. bathroom and kitchen fans.
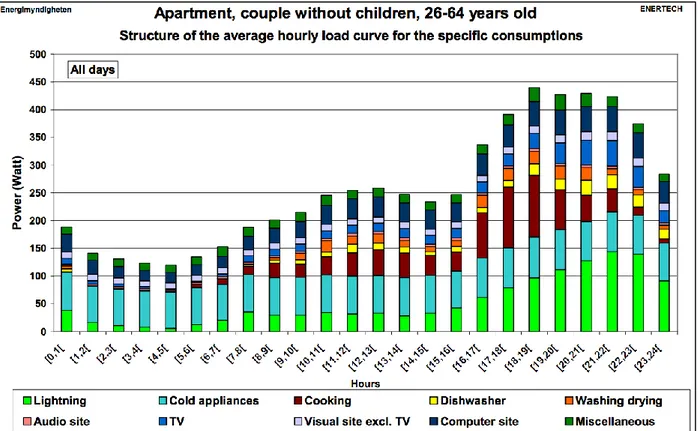
3.3.3 Household electricity
For the calculations on the total household electricity demand for the area, simulations have been done to reflect the consumption during a day. The simulations are based on the data from figure 9 that presents the variation during a day and the specific
consumptions for different appliances for a two-person household.
Figure 8: Average electricity demand on a hourly basis during a day
Although the data is based on a two-person household, and the planned district at Dag Hammarskjölds väg are calculated for households with 2.22, the electricity demand stays the same. That depends on the fact that there can be no assumption that e.g. more lamps will be lit.
The average electrical power demand per household is 277.74 watt per hour, resulting in a total electrical power demand of 19.49 GWh per year for household appliances. [41]
19
3.3.4 Solar cell panel simulations
All the simulations of the solar cell panels is made with Matlab and based on the Meteonorm database and formulas from the book Solar engineering of thermal Processes of J.A. Duffie and W.A. Beckman[42].
The Meteonorm database Version 5.0 at meteonorm.com includes weather and geological conditions that have been used in the simulations.[43]
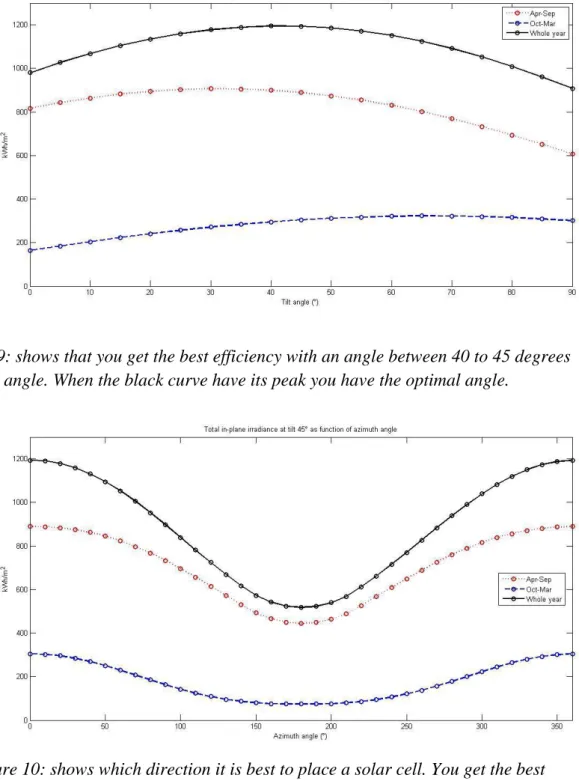
Figure 9: shows that you get the best efficiency with an angle between 40 to 45 degrees angle. When the black curve have its peak you have the optimal angle.
Figure 10: shows which direction it is best to place a solar cell. You get the best efficiency when placing the solar cells to the south, because the azimuth angle 0 and
20
As a result from our calculations, presented in figure 9 and 10, the buildings should face to the south and the solar cell should have an angle of 45 degrees. But this kind of big buildings cannot have roof with 45 degrees angle, instead they will have roof similar to figure 5 with 15 degrees angle. It is possible to tilt the panels to 45 degrees but
considering that shadows make it impossible to utilize all the area it is better to place all the panels directly on the roof. To get the maximal effect for the solar cell panels it is better to use as much space as possible.
To calculate the effect that the solar cell panels can generate, considerations must be taken concerning the direction and angle that is optimal for the location. Another important factor are the solar ground-reflectance towards the panel. In order to get a median value of the ground-reflectance we have calculated the ground-reflectance value of 0.35 from the assumption that it is snow three months over a year. When the ground is covered in snow the ground-reflectance value is 0.8 and when it is grass the value is 0.2.
21
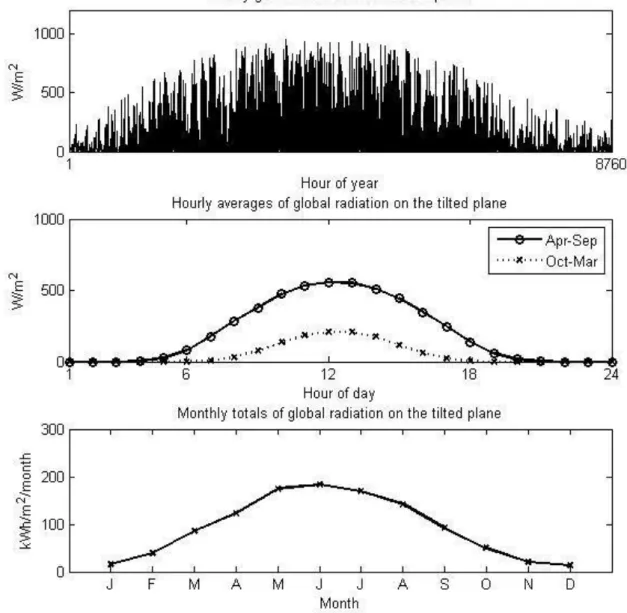
Figure 11: shows how much kWh you get per square meters every hour and also every year for a solar cells with an angle of 15 degrees, faces south and have a
ground-reflectance value of 0.35
Both the four and six storey buildings have a roof angle of 15 degrees and a capacity to have 745.4 m2 solar cell panels on every roof. The whole roof area is 931,75 m2 but 20 per cent of the area have been removed from the calculations assuming space for e.g. ventilation, roof racks and accessibility to the roof. Considering the total in-plane irradiance of 1107 kWh/m2/year presented in figure 11 and a solar cell efficiency of 17 per cent it i possible to produce 140277 kWh every year on every roof that face to the south.
22
Figure 12: shows how much kWh you get per square meters every hour and also every year for a solar cells with an angle of 90 degrees, faces south and have a
ground-reflectance value of 0.35
The results presented in figure 11 and 12 is quite same, the difference is that the in-plane irradiance is better for the simulation in figure 11 but the effect peak is on the afternoon in figure 13.
23
Figure 13: shows how much kWh you get per square meters every hour and also every year for a solar cells with an angle of 90 degrees, faces southwest and have a
ground-reflectance value of 0.35
A building with solar cells on their facade get a better effect and a peak at the afternoon if it faces to the southeast. But the total capacity is better when placing solar cell panels with a 90 degrees angle to the south. Consider that the electric demand is higher on the afternoon it is more optimal to place the houses with solar cell panels on their facade to southeast. So 17 of the four storey apartments and eight of the six storey buildings will also have an facade with solar cell panels at southeast.
All of the townhouse will only have panels on their roofs, so to get the maximal effect of all these houses they will face to the south. Here have the solar cell panels a area of 332.9 m2 and the roof angle is 15 degrees which mean that the total irradiance is 1107 kWh/m2. This give a capacity to produce 62.65 MWh per year and house.[40]
24
3.3.5 The capacity for the solar panels
Table 4: Description over all solar cell panels and the capacity of the total solar cell panels
Type of house Direction Solar cell panels on the roof ( m2 ) Solar cell panels on the facade ( m2 ) Number of buildings Total capacity (MWh/year) six storey building South 745.4 --- 23 3 227 six storey building South 745.4 830.0 4 1 115 six storey building Southwest 745.4 830.0 8 2 127 four storey building South 745.4 --- 52 7 294 four storey building South 745.4 513,6 8 1 807 four storey building Southwest 745.4 513,6 17 3 674 Townhouse South 332.9 --- 30 1 879
This table, table 4, describes all buildings and in which direction they will face, it also present were the solar cell panels will be placed on the buildings. The solar cells on the roofs will have angle of 15 degrees and the solar cell panels on the facade will have a 90 degree angle. To get the total capacity it is important to consider the different in-plane irradiance for every angle and direction of the panels, but also the efficiency factor of 17 per cent. The total capacity for all solar cell panels is 17.82 GWh/year.
3.4 Sensitivity analysis
The factors that may and can have a significant impact on the result from the model have been studied in order to determine which parameters can be improved or reduced. Since the heat demand, hot water demand and electricity demand is closely entwined from a energy utilization and consumption perspective it is important to consider this when analyzing the input parameters to the simulations. The parameters are as follows:
U-values
Heat recycling or not regarding the ventilation losses Angle of the solar cell panels
25 Orientation of the solar cell panels
The sensitivity analysis was in other words executed in order to determine the reliability of the study and visualize any eventual key parameters.
4. Results
4.1 Differences between standard and passive houses
The simulations in Matlab provided detailed data of the different house designs. The aim to find out if the passive house design was the better one and how much energy that could be saved resulted in the figures in Table 5. The numbers in the table are the difference between the standard house and the passive house where positive numbers are a result of a higher heat demand for standard houses.
Table 5. Max heat output, total heat, and relative heat demand for the different kind of houses
--- Normal house Passive house Difference Max heat output
demand, six storey building (W/m2)
20.88 12.71 8.17
Max heat output demand, four storey building (W/m2)
22.52 13.65 8.88
Max heat output demand, townhouse (W/m2)
29.6 17.98 11.62
Relative heat demand, six storey
(kWh/m2, year)
40.34 20.49 19.85
Relative heat demand, four storey
(kWh/m2, year)
44.36 22.74 21.62
Relative heat demand, townhouse
(kWh/m2, year)
56.2 28.09 28.15
Total heat demand of the area (MWh/year)
26
This table, table 5, present the difference in heat demand between a standard house and a passive house. It is also a simulations over the heat demand considering if the
buildings in the area will be built as the requirements of a passive house or as a standard house.
The max heat output demand in the table above visualizes the heat demand per square meter for each type of house during the coldest time of the year in our simulations. The
relative heat demand shows the hot water and heat demand per square meter over a year
for the different kinds of buildings.
In all the presented aspects the passive house design is better than the standard house design. The maximal heat output demand and the relative heat demand are lower and leads to energy saving. The total savings for the whole district are also presented in Table 5. The figures proves that the total heat demand for the district are much lower with the passive house design than the standard house design.
With an total energy saving of 10.35 GWh per year the district reduces the total heat demand around 50 per cent. That number illustrates the great advantage with the passive house design.
The townhouse with a passive house design though, does not fulfill the requirements for passive houses. The max heat output demand is too high. This shows that it is easier to build energy efficient buildings the bigger they are. But the value can also be lowered by using a wooden frame instead of a concrete frame, since the thickness of the insulation then can be increased.
In Figure 14 the upper graph provides information over the heat demand per m2 for the different sort of buildings for both the passive house design and the standard house design. With a lower outdoor temperature the gap between the two designs increases. The differences are also smaller for the larger buildings than the smaller according to the mean U-value that are lower for larger building with the same building elements. The solution for that are the fact that the amount of doors are the same for the four and six storey building. For the townhouse the mean U-value are higher due to a bigger building envelope compared with the conditioned area.
27
Figure 14: The total heat demand during a year
The total heat demand for the whole district are also shown as a simulation over a year in the lower graph in Figure 14. The simulation provide the specific demand for every hour of the whole year to generate a more detailed picture over the changes of the heat demand. The curve for the standard houses are not only higher during the cold season but also lower during the warm season. The explanation is that the worse insulation not only let the cold air pass thru but also the warm air during the summer. So a building with better insulation are not only better during the winter but also the summer. So the passive houses are not only more efficient in the perspective of the heat demand but also more efficient in the summer when the buildings need cooling.
4.2 Yearly analysis
To evaluate in what extend the houses fulfill the requirements for zero-energy houses a comparison between the solar capacity and the total electrical demand has been done. The total amount of solar energy in the district are 17.82 GWh per year, the number are calculated in section 3.3.5. The total electrical demand for the district are calculated by adding up the hot water demand, heat demand and household electricity demand to one combined amount. This was done by adding up the hot water demand and the heat demand and then dividing them with the COP factor of the heat pump to get the electrical demand. After these calculation the total electrical demand ends up to 22.19 GWh per year. So the passive houses cannot fulfill the requirements for zero-energy houses due to the fact that only 80.3 per cent of the consumption can be produced by the solar cell panels.
In Figure 15 the upper graph shows the total electrical demand and the electrical production from the solar cell panels on a hourly basis for a whole year. The lower graph sum up the consumption and production to a monthly basis to portray the total demand and production more comprehensible.
28
Figure 15: Total electrical production and energy consumption during a year in a hourly and monthly basis.
By evaluating Figure 15 the result is that it is almost possible to cover the whole demand on an annual basis with just solar cell panels. But the production are higher during the summer and the need is biggest in the winter. So the problem is to spread this out over the whole year. This is possible to do by placing the solar cell panels in
different angles or making them face at a different direction. An alternative can be to place more solar cell panels on the facade. If this is done the production peak is reduced and the production increases during the spring or the autumn. But then the annual production will decrease.
4.3 Monthly analysis
By comparing the production and demand on a daily basis for a winter and a summer month the result will seem to be different. While the heat demand in June, illustrated in the left graph in Figure 16, are lower than the heat demand for December, illustrated in the right graph in Figure 16, the electrical production are higher. For December it is the other way round.
29
Figure 16: Mean value of production and consumption daily during June and December
The result of these two month indicates that it might be better to reduce the production from solar energy to streamline the ratio between production and consumption. The overproduction in June will then decrease and the production in December will not change significant as the total production for the whole month is not very large. But this will also lead to a decreased production the whole year and the amount of days when the district are self-supporting over a seasonal basis will be shorter.
4.4 Daily analysis
To streamline the production in a daily perspective the solar cell panels need to produce more energy in the evenings than during daytime. As shown in Figure 17 the production peak are now at midday and the consumption are higher in the afternoon and evening. The graphs for the daily production and consumption is a mean value for June and December. In December the production from the solar cell panels never reach the demand which means that a second energy source are constantly needed. During June the production is more than double the size of the demand at midday. Therefore it would be desirable to have a wider spread production over the day. This can be done by facing the solar cell panels towards southwest to capture the solar energy in the evening.
30
Figure 17: Mean value of hourly production and consumption during June and December
As presented in section 3.3.4 and figure 13 it is possible to get the peak of production on the afternoon instead of the middle of the day. In this case it is important to face as many buildings and panels as possible towards southwest to get a significantly result. But it is also important that these panels have an angle of 90 degrees as the result for panels with 15 degrees presented in Appendix A and figure 19 does not generate the same result.
4.5 Sensitivity analysis
In this section the sensitivity analysis will be processed concerning the results presented in the rapport.
4.5.1 U-values
The most essential part of the construction of a passive house is its U-value and when it is compared to a so called standard house the difference is noted immediately. Therefore it is important when construction a new house or building to take these values into consideration since these values represent the isolation capability, heat transfer, and although the standard is quite clear when it comes to passive houses the regulation for a standard is a blur. This can result in secondary faults in the calculations done by the model and are worth noting.
4.5.2 Heat recycling or not regarding the ventilation losses
The ventilation losses every house and building suffer from cannot be completely eliminated but it can be greatly reduced by using heat recycling in the ventilation system as visualized in section 2.2. This is important to take into the calculations
31
regarding both passive houses and standard houses since it saves such tremendous amount of energy compared to a system which does not utilize recycling. Different brands also play a large part due to the efficiency of their machines since a disparity of just five per cent result in notable change even when just discussing a single house.
4.5.3 Angle of the solar cell panels
The angle of the solar cell panels have the largest impact regarding the electrical
production and the different production values depending on the angle can be viewed in
Appendix A. The different amount of produced energy, considering the angle, will have
an impact on the result and how much energy the area will be able to sustain. Therefore it may be more prudent to place more solar cells in a more optimal angle in order to produce more solar energy. However, as far as this report has calculated, the total electrical production will be more optimal with the angles which has been mentioned previously considering the placement of the panels. A way of improving the total produced solar energy may be to not place the solar cells on the roof and walls but instead assemble them on the ground with the optimal angle of 40-45 degrees. This may be more sufficient in the aspect of producing more energy but, when considering
making the houses energy neutral and not requiring the room on the ground, it is still worth placing them on the houses.
4.5.4 Orientation of the solar cell panels
The orientation of the solar cell panels have the most influence considering at what time of the day the energy is most needed. In the simulations of the model the panels are faced either to the south or the southwest. The reason the model only simulate facing south and southwest is because the need for energy and electricity is at its peak on the latter half of the day. However, the amount of panels facing southwest may be increased and perhaps even placing a few in the direction to the southeast will prove prudent. This is only important when discussing the hourly demand of the day therefore if only the total amount of produced energy is important then the most optimal orientation is to the south, as viewed in Appendix A. Hence a change in the orientation of the panels will deliver a different amount of energy
4.6 Summarizing discussion
It is quite likely that the district is going to be connected to the district heating system in Uppsala. That will result in a lower electric demand and the solar energy will then cover 91.4 per cent. But the problems concerning the time of the day for production and consumption remains. So whether the system are fitted for the district or not are questionable. But Uppsala kommun has still planned to expand the production from solar energy to 30 MW in 2020. The solar energy system simulated for the area has an installed power of 19.8 MW. So this is still a good opportunity to expand the production from solar energy and link the system to the main grid.
32
If the system is not linked to the main grid there will be a quite large amount of energy that are wasted. With a local grid it would then be more beneficial with a smaller system adapted to the hourly demand without any overproduction.
Another way of dealing with the overproduction during the summer months could be to arrange for a charging location for electric cars. In this way the overproduced electricity from the solar cell panels would not go to waste as they would if nobody would buy and consume that power and could instead serve a good purpose of creating a green and environmentally friendly charging location.
5. Conclusion
The heat demand for the standard houses are 21.14 GWh per year and for the passive houses 10.78 GWh per year. Resulting in a total energy saving of 10.35 GWh per year. So the energy consumption can be reduced with 49 per cent by using passive house design instead of todays standard.
The solar energy system produce 17.82 GWh per year and the total demand is 22.19 GWh per year. So the electrical production covers 80.3 per cent of the annual energy demand. On a monthly basis the amount solar cell panels generates in an
overproduction during the summer and an underproduction in the winter. In a daily basis the production are not streamlined to the consumption due to the fact that the production is highest during daytime and the consumption in the afternoon and evening. So the calculated electrical production are misfitted for a local grid in the district and does not match the consumption in a desired extent.
As the electrical production only covers 80.3 per cent of the total energy demand the passive houses does not fulfill the requirements for zero-energy houses without any additional local energy utilization.
33
References
[1] Länsstyrelsen, (2014), “Bostadsmarknadsenkäten 2014”,
http://www.lansstyrelsen.se/uppsala/SiteCollectionDocuments/Sv/publikationer/ 2014/Bostadsmarknadsenk%C3%A4ten%202014.pdf, fetched 2014-04-15 [2] Uppsala kommun, (2014), “Miljö- och klimatprogram 2014-2023”,
http://www.uppsala.se/Upload/Dokumentarkiv/Externt/Dokument/Miljo_klimat/ miljo_klimatprogram_2014_2023.pdf, fetched 2014-04-15
[3] European Union, (2010), “Directive 2010/31/EU, Official Journal of the European Union”
http://www.eceee.org/policy-areas/buildings/EPBD_Recast/EPBD_recast_19May2010.pdf fetched 2014-06-02
[4] Sandström, R., Sigurdson, B., Uppsala kommun, (2011), “Strategi för Energieffektivisering 2011 med mål 2014 & 2020”,
http://www.uppsala.se/Upload/Dokumentarkiv/Externt/Dokument/Bostad_o_by ggande/Energi/Uppsala_kommun_Strategi_for_energieffektivisering%202011.p d, fetched 2014-04-14
[5] Uppsala kommun, (2014), “Miljö- och klimatprogram 2014-2023”,
http://www.uppsala.se/Upload/Dokumentarkiv/Externt/Dokument/Miljo_klimat/ miljo_klimatprogram_2014_2023.pdf, fetched 2014-04-14
[6] Holinder, A., Energy strategist at Uppsala kommun, interview in Uppsala 2014-03-31
[7] Certified European Passive House Desinger, (2014), “Project (CEPH)” http://eu.passivehousedesigner.de/, fetched 2014-04-27
[8] Passivhuscentrum, (2014), “Om passivhus”
http://www.passivhuscentrum.se/om-passivhus fetched 2014-04-27 [9] Passive House Institute US, (2011), “What is a Passive House?”
http://www.passivehouse.us/passiveHouse/PassiveHouseInfo.html fetched 2014-05-04
[10] Royal Institute of British Architects, (2014), “Substanability Hub, U-values” http://www.architecture.com/SustainabilityHub/Designstrategies/Earth/1-1-1-10-Uvalues(INCOMPLETE).aspx fetched 2014-05-04
[11] Isover Saint-Gobain, (2008), “Isover Multi-Comfort House, Nordiskt klimat ” http://ipaper.ipapercms.dk/SaintGobainConstruction/Isover/Byggisolering/MCH Nordisktklimat/, fetched 2014-05-05
[12] REC Indovent, (2013), “Luftbehandlingsagregat”
http://www.rec-indovent.se/wp-content/uploads/Temovex_RT250S-EC-RS.pdf fetched 2014-05-09
34
[13] Thyrens, (2014), “Vad är ett passivhus? Definitionen av passivhus” http://www.tyrens.se/sv/Tjanster/Energi--byggfysik/Passivhus/Vad-ar-ett-passivhus/, fetched 2014-09-04
[14] Sveriges centrum för Nollenergihus, (2012), “Kravspecifikation för nollenergihus, passivhus och nollenergihus”
http://www.nollhus.se/dokument/Kravspecifikation%20FEBY12%20-%20bostader%20sept.pdf fetched 2014-05-10
[15] Sveriges centrum för Nollenergihus, (2012), “Kravspecifikation för nollenergihus, passivhus och nollenergihus”
http://www.nollhus.se/dokument/Kravspecifikation%20FEBY12%20-%20bostader%20sept.pdf fetched 2014-04-08
[16] Vattenfall, (2014), “Vanliga frågor och svar”
http://www.vattenfall.se/sv/file/FAQ_Solceller_Privat_52325255.pdf) fetched 2014-04-07
[17] Trove AB, (2014), “Sälja överskottsel”,
http://www.el.se/artiklar/salja_overskottsel/ fetched 2014-05-30 [18] Energimyndigheten, (2013), “Solvärme”
http://www.energimyndigheten.se/sv/Hushall/Din-uppvarmning/Solvarme/, fetched 2014-04-07
[19] Statistics Sweden, (2013) , “Befolkningsstatistik” http://scb.se/sv_/Hitta-
statistik/Statistik-efter-amne/Befolkning/Befolkningens- sammansattning/Befolkningsstatistik/25788/25795/Helarsstatistik---Kommun-lan-och-riket/367830/, fetched 2014-05-08
[20] Ny teknik, (2014), “En effektiv människa?”
http://www.nyteknik.se/popular_teknik/article256453.ece, fetched 2014-04-10 [21] Sveriges centrum för Nollenergihus, (2012), “Kravspecifikation för
nollenergihus, passivhus och nollenergihus”
http://www.nollhus.se/dokument/Kravspecifikation%20FEBY12%20-%20bostader%20sept.pdf, fetched 2014-05-18
[22] IKEA, (2011), “Hur många lampor har du i ditt vardagsrum?”
http://livethemma.ikea.se/inspiration/hur-manga-lampor-har-du-i-ditt-vardagsrum, fetched 2014-04-10
[23] Markaryds kommun, (2010), “Energiförbrukning”
http://www.markaryd.se/innehall/miljo/boende/energifragor/energiradgivning/en ergiforbrukning/energiforbrukning, fetched 2014-04-10
[24] Svensk Fjärrvärme, (2014), “Om fjärrvärme”
http://www.svenskfjarrvarme.se/fjarrvarme/, fetched 2014-05-15
[25] Vattenfall, (2014), “Vi värmer Uppsala” http://www.vattenfall.se/sv/fjarrvarme-uppsala-privat.htm, fetched 2014-05-15
35
[26] Svensk Fjärrvärme, (2014), “Om fjärrvärme”
http://www.svenskfjarrvarme.se/fjarrvarme/, fetched 2014-05-15 [27] Vestman, E., Engineering at Vattenfall in Uppsala, email 2014-04-08 [28] ETA, (2006), “How Geothermal Heating and Cooling Works”
http://www.earthtoair.com/how-geothermal-heating-and-cooling-works.php, fetched 2014-05-20
[29] Energimyndigheten, (2014), “Bergvärme”
http://www.energimyndigheten.se/Hushall/Din-uppvarmning/Varmepump/Bergvarme/, fetched 2014-05-20 [30] Alenius, A., Illustrator, Copyright Anna Alenius 2014
[31] Statistic Sweden, (2013), “Befolkningsstatistik” http://scb.se/sv_/Hitta-
statistik/Statistik-efter-amne/Befolkning/Befolkningens- sammansattning/Befolkningsstatistik/25788/25795/Helarsstatistik---Kommun-lan-och-riket/367830/, fetched 2014-05-07
[32] Åberg M., (2013), “Development, validation and application of a fixed district heating model” structure that requires small amounts of input data”, Department of Engineering Sciences, Uppsala University
[33] Energimyndigheten, (2014), “Kallt och varmt vatten”
http://www.energimyndigheten.se/Hushall/Varmvatten-och-ventilation/Vatten-och-varmvattenberedare/, fetched 2014-05-13
[34] Energimyndigheten, (2007), “Mätningar av varm- och kallvattenförbrukning” http://www.energimyndigheten.se/Statistik/FESTIS/Matningar-av-varm--och-kallvattenforbrukning/ , fetched 2014-05-13
[35] Boverkets byggregler, (2013), “Föreskrifter och allmänna råd, BBR”
http://www.boverket.se/Global/Lag_o_ratt/Dokument/Boverkets-Forfattningssamling/BBR-konsoliderad-BFS2011-6-tom-BFS2013-14.pdf, fetched 2014-05-14
[36] EQ Window, (2014), “Glasklart med energimärkta fönster”
http://www.velfac.se/velfac-se/download.nsf/web_all/9B7EF77527445F7FC12575C1003EB7A3/$file/V200i _0.62_Energy-Clear-Energy+tillaggsbage.pdf, fetched 2014-05-14
[37] SWEDOOR, (2013), “Stoppa energitjuven vid dörren!”, http://www.jeld-wen.se/produkter/ytterdoerrar/passivhusdoerrar-laagenergidoerrar/, 2014-05-14 [38] Isover Saint-Gobain, (2009), “IsoverBoken, Guide för arkitekter, konstruktörer
och entrepenörer”
http://ipaper.ipapercms.dk/SaintGobainConstruction/Isover/Byggisolering/Isover Boken/, fetched 2014-05-14
36
[39] Isover Saint-Gobain, (2014), “Produktguide Tak 2014”
http://ipaper.ipapercms.dk/SaintGobainConstruction/Isover/Byggisolering/Produ ktguideTak2014/, fetched 2014-05-14
[40] Isover Saint-Gobain, (2009), “IsoverBoken, Guide för arkitekter, konstruktörer och entrepenörer”
http://ipaper.ipapercms.dk/SaintGobainConstruction/Isover/Byggisolering/Isover Boken/, fetched 2014-05-14
[41] Zimmermann, J., P., (2009, Enertech, “End-use matering campaign 400 household In Sweden”
http://www.energimyndigheten.se/Global/Statistik/F%C3%B6rb%C3%A4ttrad %20energistatistik/Festis/Final_report.pdf, fetched 2014-04-26
[42] Duffie, J.A., Beckman, W.A. (2006), “Solar engineering of thermal Processes”, Hoboken, NJ:Wiley, fetched 2014-04-26
[43] Meteonorm, (2003), “Database meteonorm version 5.0” meteonorm.com, fetched 2014-04-26
Appendix A
Solar cell simulations with respect to different angles and positioning on the roofs and facades.
Figure 18. Solar cell simulation for a panel with an angle of 15 degrees that faces southwest and have a ground-reflectance value of 0.35.
Figure 19. Solar cell simulation for a panel with an angle of 15 degrees that faces southeast and have a ground-reflectance value of 0.35.
Figure 20. Solar cell simulation for a panel with an angle of 90 degrees that faces southeast and have a ground-reflectance value of 0.35.
Figure 21. Solar cell simulation for a panel with an angle of 45 degrees that faces south and have a ground-reflectance value of 0.35.
![Figure 1: Emissions of greenhouse gases per citizen in the municipality of Uppsala (Carbon dioxide equivalents, CDE) [4]](https://thumb-eu.123doks.com/thumbv2/5dokorg/5550638.144720/9.892.133.832.431.763/figure-emissions-greenhouse-citizen-municipality-uppsala-carbon-equivalents.webp)

![Figure 3: FTX ventilation system[12 ]](https://thumb-eu.123doks.com/thumbv2/5dokorg/5550638.144720/11.892.356.513.506.881/figure-ftx-ventilation-system.webp)
![Figure 4: Sketch showing how the townhouses with solar panels on the roof might look [30]](https://thumb-eu.123doks.com/thumbv2/5dokorg/5550638.144720/16.892.131.767.344.519/figure-sketch-showing-townhouses-solar-panels-roof-look.webp)
![Figure 6: Sketch showing how the six storey building with solar panels on the walls and roof might look [30]](https://thumb-eu.123doks.com/thumbv2/5dokorg/5550638.144720/17.892.130.768.219.436/figure-sketch-showing-storey-building-solar-panels-walls.webp)