Department of Wildlife, Fish, and Environmental Studies
Spatial and temporal variability in grassland
structure associated with different densities
of the white rhinoceros (Ceratotherium
simum) in a South African savanna
Emilia Malmström
Spatial and temporal variability in grassland structure
associated with different densities of the white rhinoceros
(Ceratotherium simum) in a South African savanna
Emilia Malmström
Supervisor: Joris Cromsigt, Swedish University of Agricultural Sciences, Department of Wildlife, Fish, and Environmental Studies
Assistant supervisor: Elizabeth le Roux, Nelson Mandela University, Department of Zoology Examiner: Therese Löfroth, Swedish University of Agricultural Sciences,
Department of Wildlife, Fish, and Environmental Studies
Credits: 60 credits
Level: Second cycle, A2E
Course title: Master Thesis in Biology, A2E – Management of Fish and Wildlife Populations – Master’s Programme
Course code: EX0935
Course coordinating department: Department of Wildlife, Fish, and Environmental Studies Place of publication: Year of publication: Cover picture: Title of series: Part number: Online publication: Keywords: Umeå 2019 Emilia Malmström Examensarbete/Master's thesis 2019:20 https://stud.epsilon.slu.se
White rhinoceros, African savanna, keystone species, herbivory, cascading effects, poaching
Swedish University of Agricultural Sciences Faculty of Forest Sciences
Abstract
The direct and indirect relationships between species in different trophic levels are referred to as trophic dynamics and are important in maintaining the function of ecosystems.
Megaherbivores may have effects both directly and indirectly on other species since their impact may be disproportionately large relative to their population size. Megaherbivores are therefore often considered as keystone species. The white rhinoceros in Africa
(Ceratotherium simum) has previously been described as a keystone species and ecological engineer as a mega grazer in the African savanna. This study investigated the role of white rhino and the indirect effect of white rhino poaching on savanna grassland structure. I measured the proportion of lawn grass cover and grass biomass across gradients of white rhino density and poaching intensity on 30 different sites in Hluhluwe-iMfolozi Park in the province of Kwa-Zulu Natal in South Africa. Grass biomass decreased and lawn grass cover increased with increasing white rhino presence (rhino local use), suggesting that white rhino
act as an important driver in creating and maintaining grazing lawns and grassland structural heterogeneity. All models also suggest that grass biomass and lawn grass cover were more strongly correlated with presence of other herbivores than with white rhinos, which might indicate that white rhinos are not the main creators of grazing lawns and that other herbivores also play an important role in maintaining lawns. Grass biomass decreased and lawn grass cover increased as poaching of white rhinos increased which may indicate that poaching intensity is high where white rhino density is high. However, these results may suggest that white rhinos increase grassland heterogeneity and the disruption of this function through poaching could have far-reaching consequences for the availability of grassland habitat for other species.
Keywords: White rhinoceros, African savanna, keystone species, herbivory, cascading effects, poaching
Table of Contents
1. Introduction 1
2. Materials & Methods 4
2.1. Study site 4
2.2. Estimation of rhino density and poaching intensity 4
2.3. Estimation of grassland structure 5
2.3.1. Quantifying grassland structure 5
2.3.2. Repeated measure of grassland structure 6 2.4. Statistical analysis 7
3. Results 9
3.1. Poaching intensity as indicator of rhino density 9
3.2. Relationship between rhino density (from aerial census count data of rhinos) and 10
rhino local use (from dung count data) 3.3. Effects of spatial variation in rhino density and poaching intensity on grassland 11
structure 3.3.1. Grass biomass 11
3.3.1.A. The impact of rhino density on grass biomass: aerial census count data of rhino 11
3.3.1.B. The impact of rhino local use by rhinos on grass biomass: white rhino dung counts 3.3.1.C. The impact of poaching intensity on grass biomass 14
3.3.2. Grazing lawn proportion 3.3.2.A. The impact of rhino density on lawn grass proportion: aerial census count data of rhino 15
3.3.2.B. The impact of rhino local use by rhinos on lawn grass proportion: white rhino dung counts 15
3.3.2.C. The impact of poaching intensity on lawn grass proportion 16
3.4. The impact of rhino density on grass biomass within lawn and bunch grass sites 18
3.4.1. Lawn grass dominated sites 18
3.4.2. Bunch grass dominated sites 18
3.5. Effect of poaching intensity on the change in grassland structure over time 20
4. Discussion 21
4.1. The relationship between rhino density, poaching intensity and rhino local use 21
4.2. The effect of rhino on grassland structure 21 4.3. The effect of poaching intensity on grassland structure 23 4.4. The effect of temporal difference in poaching intensity on grassland 24
structure 5. Conclusion 25 6. Acknowledgements 26 7. References 27
The mechanisms of trophic dynamics operate across three different trophic levels in
ecosystems: predators, herbivores and primary producers (plants), where a herbivore species can be regulated by its predators through top down control, or by its resources (plant
productivity) through bottom up control (Oksanen & Oksanen 2000). Trophic dynamics i.e. the direct and indirect relationships between species in different trophic levels are important in maintaining the function of ecosystems (Oksanen & Oksanen 2000). Disruption to trophic dynamics could lead to cascading effects within ecosystems such as when populations of species are reduced or become extinct. Examples of these scenarios have been found in many ecosystems around the world (Estes et al. 2011), e.g. the recovery of riparian plant species (and recovery of many other species) in Yellowstone National Park following the
reintroduction of wolves suggests that the removal of a top-down regulation on elk
populations had cross-trophic level consequences (Ripple & Beschta 2003). Keystone species are organisms whose ecological effect is disproportionately large relative to its population size in an area, and they often have a strong impact on other trophic levels both directly and indirectly (Power et al. 1996). Keystone species have previously been described mainly as apex predators, but the role of herbivores (particularly large herbivores) is in many cases as important (Western 1989; Waller & Alverson 1997; Waldram et al. 2008). African elephants (Loxodonta africana) and the black and white rhinoceros (Diceros bicornis,
Ceratotherium simum), are the largest terrestrial animals existing today. Species with an adult body mass of >1,000 kg (such as elephants and rhinoceros) are defined as "megaherbivores" (Owen Smith 1988). These species are usually avoided by predators as adults and are thus basically immune to predation (Owen Smith 1988). Hence their populations are not primarily regulated by top down control but constrained by food availability. Therefore, it has been hypothesized that both elephants and rhinoceros have a disproportionately large impact on vegetation abundance and structure (Owen Smith 1988; Pringle 2008). Megaherbivores can also be considered as ecosystem engineers - species that directly and/or indirectly modulates the availability of resources to other species by creating, modifying and maintaining habitats are referred to as ecosystem engineers (Lawton & Jones 1995). Cascading effects could be particularly pronounced if the disruption to trophic dynamics is caused by the extinction of a keystone species and/ecosystem engineer (Lawton & Jones 1995).
Rhinoceros and elephants (and many other species) have declined significantly over the past 30 years and these declines have been largely due to human exploitation such as poaching (Douglas-Hamilton 2009; Biggs et al. 2013). Poaching of elephants and rhinoceros has mainly been driven by the demand for ivory and rhino horn in especially Southeast Asia, and without conservation efforts they might go extinct within a near future
Pleistocene resulted in changes in the vegetation structure, which in turn had cascading effects on other species that was dependent on the landscape created by the megaherbivores (Owen-Smith 1987). This suggests that there might be great consequences when megaherbivores are removed, and it stresses the importance of understanding the ecological patterns induced by the megaherbivores existing in contemporary time.
Previous studies investigating the ecological role of megaherbivores have mainly focused on the African elephant (Western 1989; Pringle 2008; Nasseri et al. 2009), and few have looked at the impact of white rhinoceros (but see Waldram et al. 2008; Cromsigt & te Beest 2014; Van der Plas et al. 2016). As a megagrazer, white rhinoceros may have large impacts on the structure and composition of the grass layer, and their heavy grazing may stimulate the formation of grazing lawns (Waldram et al. 2008; Cromsigt & te Beest 2014). Savanna grasslands consist of a mix of grazing lawns, which are dominated by the short growing stoloniferous and prostrate growing grass species, andbunch grasslands, which are dominated by tall grasses growing in tussocks (Van der Plas et al. 2013). Grazing lawns are maintained by high intensity of grazing that decreases the biomass of taller grass species and reduces the competition for sunlight for stoloniferous and prostrate grass species, allowing the
populations of lawn grass species to expand (Craig 2010; Hempson et al. 2014). Grazing lawns respond to grazing by compensating in growth, which provides fresh and nutritious regrowth that attracts herbivores back to the lawn and thereby maintain heavy grazing pressure (McNaughton 1983; Coughenour 1985; Hempson et al. 2014). The growth form of stoloniferous and prostrate grass species provides physical refuge from grazing by keeping the costly tissue, such as stolons and meristems, below the level where grazers can reach, and they are not as vulnerable to trampling as upright and taller grasses (Hempson et al. 2014). In summary, grazing can indirectly give a competitive advantage to competitively inferior grass species by reducing competition between species, and thus create variation in savanna grass community composition. Grazing lawns are also more resistant to fire than areas with taller bunch grasses, and therefore grazing lawns act as firebreaks on the savanna where grazing can indirectly control the intensity and spread of fire by reducing the fuel load (grass biomass) and maintaining the grazing lawns (Waldram et al. 2008).
Other factors such as soil nutrients and water availability may also influence grassland structure. Areas with high soil nutrient may attract herbivores which in turn could shape grassland structure through grazing. However, Stock et al. (2010) found no evidence that soil nutrients determine where grazers concentrate their feeding and therefore do not necessarily influence grassland structure. Grazing and trampling can also change the soil water balance and induce higher evaporation rates in the soil, which results in dryer top soils where drought tolerant grass species have an advantage over other competitive grass species (Veldhuis et al. 2014). The grassland productivity is also dependent on rainfall which facilitates for faster grass growth rate and more grazing is thus needed to keep the tall grass from invading grazing lawns (Archibald 2008; Waldram et al. 2008). Therefore, grazing and trampling from white rhinoceros (rhinos from here on) and other herbivores might be most important in areas with higher rainfall and during the wet season in order to maintain grazing lawns.
Many previous studies have investigated grazing effects by more than one grazing species, but cannot discern the relative impact of white rhinos (McNaughton 1983;
Coughenour 1985; Craig 2010; Hempson et al. 2014). Waldram et al. (2008) found that grass sward height was significantly higher in areas where rhinos had been removed, only in high rainfall areas. This indicates that, under high rainfall conditions, meso-herbivores, such as impala (Aepycerus melampus), wildebeest (Connochaetes sp.), zebra (Equus quagga) and buffalo (Syncerus caffer), cannot replace the grazing effect of rhinos (Waldram et al. 2008). Cromsigt & te Beest (2014) investigated the impact of rhinos in Kruger National Park in
South Africa, where rhinos were reintroduced in the 1960's. Grazing lawns were nearly absent in areas where rhinos had not yet recolonised, and grassland heterogeneity increased as rhino density increased (Cromsigt & te Beest 2014). Another study by Van der Plas (2016)
questions the impact of rhinos on vegetation structure. They investigated the effects by grazers of different sizes, and found that rhinos´ effect on grassland composition and grass height was not as strong as that of impalas and zebras. However, the authors admit that the result may be due to the small scale of their study and the widely differing habitats that the study looked at (Van der Plas et al. 2016). Regardless, the studies investigating the singular effect of rhino on grassland structure are still very few and the relative role of white rhinos in shaping grassland structure remains uncertain.
In this study I investigated how different densities of rhinos correlate with grassland structure and how grass structure change over time following the removal of rhino in a protected area called iMfolozi Park in South Africa. The grassland of Hluhluwe-iMfolozi Park in South Africa has changed over the past decade. The cover of grazing lawns has declined and bunch grassland has increased (Cromsigt et al. 2017). There has also been an increase in density of woody plants such as Acacia karroo (Walters et al. 2004). The
abundance of grazing lawns have been higher in this park compared to other areas in Africa, which might be due to its rhino population that has remained high for the past 60 years and has never gone locally extinct, as they did in other areas and rhinos also occur in higher densities in this park than elsewhere (Cromsigt et al. 2017). This makes Hluhluwe-iMfolozi Park a well suited area to study rhinos, compared to other areas where their ecological effects have been removed completely. The park is exposed to heavy poaching, and this study also look at how poaching intensity indirectly affect grassland structure by changing the rhino density. The purpose of this study is to investigate to what extent white rhinos as a megagrazer are shaping grassland structure. I made the following predictions:
Spatial scale
Average grass biomass is lower in areas with high density of rhinos and with low poaching intensity.
The proportion of lawn cover is higher in areas with high rhino density and with low poaching intensity.
Temporal scale
Grass biomass is expected to have decreased since 2018 because those measurements were taken during the wet season when grass biomass was higher. The difference in grass biomass between the study of 2018 and 2019 will be lower in sites where poaching intensity is high which in turn is expected to indicate less grazing pressure from rhinos. High poaching areas are expected to have higher grass biomass and therefore the difference between 2018 and 2019 is expected to be lower.
Lawn cover is expected to have decreased since 2018 in sites where poaching intensity is high and the difference in the proportion of lawn cover between the study of 2018 and 2019 is expected to be higher where poaching intensity is high.
2.1. Study site
Hluhluwe-iMfolozi Park (HiP) is situated in the KwaZulu-Natal Province of South Africa between S 28.0000-28.4300, E 31.7160-32.015. Altitude ranges between approximately 45-750 meters above sea level (Howison et al. 2017). The annual rainfall in the park ranges from 990 mm in the northern part of the park (Hluhluwe) to less than 635 mm in the southern part (iMfolozi) and rainfall is highest during the wet summer season from November to April and lowest during the dry winter season from May to September (Balfour and Howison 2002). The vegetation in the park varies from grasslands to woodlands of many different species, such as Acacia species, and thicket communities consisting of dense shrubs (Whateley and Porter 1983). The area consists of 96000 hectares and is fenced with a national road crossing between the Hluhluwe and iMfolozi sections (Figure 1). The rhino population in HiP declined to very low numbers by the early 1900's due to hunting, but active protection has since helped the population to recover to a 2014 estimate of 2.6 individuals/km2 (le Roux et al. 2017).
2.2. Estimation of rhino density and poaching intensity
I calculated and mapped density of observed rhinos (rhino per km2) per sample site (see section 3.1) in QGIS 3.6 using data from aerial census counts in the park which are available annually from 2008 and twice per year from 2014,one census in the wet season (Oktober-March) and one in the dry season (April-September). Parkwide, full-coverage rhino counts are done from a fixed-wing aircraft that fly parallel and adjacent transects at 250 ft (76.2 meters) above the ground and with a constant speed. The transects are spaced 1 km apart and rhinos are counted 500 meters on either side of the aircraft. The census counting lasts for
approximately 3 days, so double counting of the same individuals is a possibility, although it is avoided to some extent by keeping track of the location on a map, and if a rhino is observed 500 meters in on the left side on one transect and then approximately 500 meters in on the right side on the same location on the next transect, it is considered to be the same individual. These counts are only made in the iMfolozi section, meaning that rhino density data is only available in iMfolozi and not in Hluhluwe (Fig. 1). I used maps of spatial variation in rhino density that were calculated using kernel density smoothing and with bandwith of 0.03 with the function density.ppp, which is implemented in the spatstat package. The density.ppp function displays the spatial variation of the point pattern using kernel smoothing. I then used these density maps to calculate an average rhino density within a buffer of 2 km around each sample site using QGIS 3.6. I only used the sites in iMfolozi in this analysis (n=18), due to the lack of rhino density data in Hluhluwe.
To calculate poaching intensity I mapped locations of poaching events and summed them within grid cells of 1 km. The monitoring of poaching is managed intensively where
2 Materials & Methods
dates and locations are recorded for each poaching event. I created a 4 km buffer zone around each sample site and averaged the number of poaching events of the overlapping gridcells. The reason for the larger buffer zone for poaching intensity is because the scattered
distribution of the poaching events caused the results to be zero-inflated. Each sample site was categorised as low, medium or high rhino density and poaching intensity. The categories were used based on the density numbers instead of using the density numbers as a numerical factor because the range between these numbers fluctuate without an ecological reason.
I calculated four different rhino densities: a long- and short-term wet season density and a long- and short-term dry season density. The reason for this is firstly because rhino impact and/or our ability to count them may vary seasonally. Secondly, South Africa was suffering from a long drought (2 years) that ended in 2016, during which the grassland structure was "reset" since much of the vegetation died and then started to grow again when the drought ended. Therefore, the impact from rhinos before the drought (long term -2008 to 2018) may no longer be reflected in the grass layer compared to the impact since the drought (short term – 2014 to 2018).
I also used the rhino dung counts recorded at each sample site (see section 3.1) as a proxy for intensity of local use from rhinos. I averaged the counts per transect across each site and then categorised the value to low (0-1), medium (2-6) and high (7-10). I did this to obtain a rhino density estimate for the sites in Hluhluwe for which census counts were unavailable. All 30 sites, from both Hluhluwe and iMfolozi, were then used in further analyses.
2.3. Estimation of grassland structure
2.3.1 Quantifying grassland structure
I conducted the study from April to August 2019 during the dry season and collected data along 210 transects in 30 sites each consisting of 7 transects. Each transect was 300 meters in length and spaced 50 meters apart. I selected site locations based on site
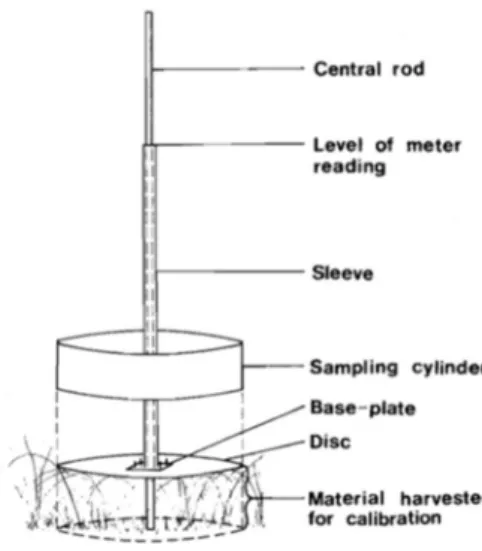
accessibility. The sites were selected to cover the spatial gradients in rhino density and rhino poaching intensity and to allow for even site distribution across the park (Fig. 1). I took measurements every fifth step along each transect. I estimated grass biomass using a Disc Pasture Meter (DPM) (Fig. 2). A DPM consists of a central rod calibrated in cm increments. This rod is put inside a sleeve with a disc attached at the bottom, and the sleeve with the disc is dropped on the grass biomass to be measured. The height level on which the grass biomass stopped the disc is read off the central rod and serves as proxy for grass biomass. In addition, I categorized surface cover as bunch grass, lawn grass, bare soil, shrub, forbs or rock. Cover type was determined by a minimum of 70 % of the surface cover underneath the DPM disc, e.g. 70 % lawn and 30 % bunch were considered as lawn. I differentiated between lawn and bunch grass cover by identifying the grass to species level (following the classification of lawn grass species set out in Hempson et al 2014) and looking for the presence of stolons. I only recorded a DPM value in the case of grass cover (lawn or bunch). I estimated woody cover every 50 meters by counting the number of shrubs and trees in a radius of 10 meters around the each measuring point. I divided this measurement into 5 categories (0-15, 15-30, 30-45, 45-60, >60). I estimated the relative abundance of other herbivores by recording the dung of other species as either present or absent within a radius of 1 meter around each measuring point. I used a GPS to record the start and the end coordinates of each transect.
Figure 1. Study site. The park is separated by a national road that goes through the middle of the
park, where Hluhluwe is the northern part of the park and iMfolozi the southern.
Figure 2. Illustration of the Disc Pasture Meter (Bransby & Tainton 1977). The sleeve with its disc is
dropped and settles on the top of the grass and compresses the grass beneath it. The height at which the disc remains may be read off the calibrated central rod (in cm) and provides a proxy for grass biomass in cm.
2.3.2 Repeated measure of grassland structure
Similar data on grassland structure was measured during January and February 2018 by another study (Vu 2018). Six of these 30 sites mentioned above were located on these reviously measured sites so that I could re-measure the grassland structure that was quantified more than a year before and evaluate if poaching on rhinos resulted in changes in grassland structure over time. These 6 sites are situated in Hluhluwe where only poaching intensity and no rhino density data was available. I used poaching data from one year prior to the study of 2018 and one year prior to my study in 2019, and these poaching intensities was used as
explanatory variable to see if it is correlated with the changes in grassland structure. The previous study took measurements (grass biomass and lawn proportion) across 3 transects of 300 meters which were separated by 150 meters, and therefore I only used average estimates of the measurements from 3 of the 7 transects walked in this study (the first, the middle and the last transect) in comparison.
2.4. Statistical analysis
When recording the relative abundance of other herbivores, I scored dung counts from all species other than rhino as present or absent regardless of the amount of dung found within the 1 meter radius. If two piles of buffalo dung was within the 1 m radius, it was noted as presence (1) of buffalo and not 2 individuals of buffalo. The counts were summed per transect where I did not differentiate between different species. I calculated rainfallwithin each site (300x350 meter) by using Zonal Statistics in QGIS 3.6. I used an elevation-weighted interpolation map to estimate spatial variation in rainfall (since rainfall varies spatially as elevation changes in HiP (Balfour and Howison 2002)) between the sample sites. The interpolation was produced at a 250 meter resolution using monthly rainfall which was recorded between 2001 and 2007 at 17 rainfall stations across the park. I used the
predominant woody cover category recorded at each transect as the transect-specific woody cover value in the analysis.
A spearman rank correlation test was done to see whether poaching intensity was correlated with rhino density (using all 4 types of rhino densities), and the same test was done to see if there is a correlation between poaching intensity with the proxy of rhino local use based on rhino dung counts. A regression test was done to see if there is any relationship between the rhino dung counts (proxy of rhino local use) in Imfolozi and the rhino density data based on aerial census counts of rhinos in Imfolozi.
I used linear mixed effects modelling to model grass biomass (using lme function from the nlme package) and lawn grass proportion (using glmer function from the lme4 package with the binomial family) as a function of the 4 different rhino density estimates (alternating between different rhino density measures i.e. not included simultaneously in the same model), the presence of other herbivores, woody cover and rainfall. Site was used as random effect. The linear mixed effects model and multiple comparison tests (using glht function from the multcomp package) were performed in R Studio 3.6.1. I used Akaike's information criterion (AIC) to see if the short term or long term density data was best suited to use (for wet season and dry season). All the variables were transect-averaged. Similar models as described above were run replacing the rhino density explanatory variable with poaching intensity and rhino dung counts as proxy for rhino local use. I simplified the models using backward step selection where non-significant variables were taken out according to ANOVA results of the model. In cases where the data was not normally distributed, I used logarithm and sqrt-function of the response variable to make the residuals normally
distributed.
In the temporal analysis, the difference in grass biomass and proportion of lawn between 2018 and 2019 surveys were used as the response variables in two separate models. Poaching intensity for the two surveys (poaching intensity from 2018 and 2019 combined) was used as explanatory variable. This was done to investigate any changes in grassland structure between 2018 and 2019, and if those changes could be explained by poaching intensity.
An additional analysis was done where I seperated sites between predominantly lawn grass site and predominantly bunch grass sites. Rhinos may actively select sites because of their grassland qualities and I did this analysis to differentiate between rhino's role in creating grassland structure from their selection for certain grassland types. If grass biomass still tends to be lower in sites with high rhino density within lawn sites and bunch sites separately, this analysis might provide a stronger indication that rhino grazing does lower grass biomass. I classified sites with ≥65% lawn cover as lawn sites and ≥65% bunch grass as bunch sites. The mixed grass sites were excluded from this analysis. This resulted in a sample size of 7 lawn sites and 8 bunch grass sites when using rhino density based on the aerial census counts of rhinos (sites in iMfolozi only). For the rhino dung count analysis, I used 8 sites as lawn sites and 17 bunch grass sites when using rhino dung counts (proxy for rhino local use) based on dung counts (sites in Hluhluwe and iMfolozi).
3.1. Poaching intensity as an indicator of rhino density
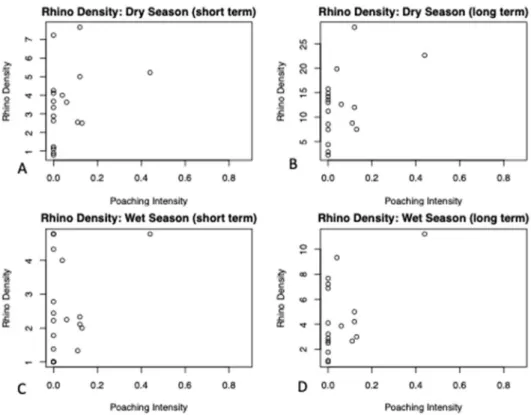
There was no significant correlation between poaching intensity and either of the four
different rhino densities (p-value= 0.15 (dry season short term), 0.19 (dry season long term), 0.65 (wet season short term) and 0.13 (wet season long term)) (Fig. 3). In addition, there was no correlation between the proxy of rhino local use based on rhino dung counts and poaching intensity (p-value=0.81) (Fig. 4).
Figure 3. The relationship between rhino density and poaching intensity: A) Dry season (short term), B) Dry season (long term), C) Wet season (short term and D) Wet season (long term) (n=18). There is no significant relationship.
Figure 4. The relationship between the proxy for rhino local use and poaching intensity (n=30). There is no significant relationship.
3.2. Relationship between rhino density (from aerial census count data of rhinos)
and rhino local use (from dung count data)
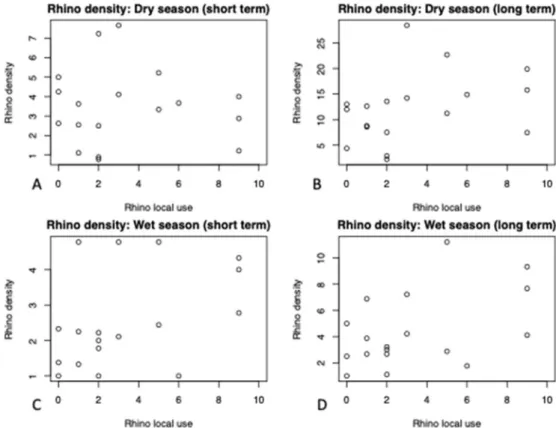
There was no significant relationship between the proxy for rhino local use and either of the 4 rhino densities: Dry season (short term) (estimate=-0.03465, Std. Error=0.15722,
value=0.828, t-value=-0.22), dry season (long term) (estimate=0.7447, Std. Error=0.5083, p-value=0.162, t-value=1.465), wet season (short term) (estimate=0.1857, Std. Error=0.0988, p-value=0.078, t-value=1.879) and wet season (long term) (estimate=0.4279, Std. Error= 0.2039, p-value=0.052, t-value=2.099) (Fig. 5).
Figure 5. The relationship between rhino density and the proxy for rhino local use: A) Dry season (short term), B) Dry season (long term), C) Wet season (short term and D) Wet season (long term) (n=18). There is no significant relationship.
3.3. Effects of spatial variation in rhino density and poaching intensity on
grassland structure
3.3.1. Grass biomass
3.3.1.A. The impact of rhino density on grass biomass: aerial census count data
of rhinos
The AIC estimation showed that the models including rhino density data over short term fit the grass biomass response better than the long term for both dry season and wet season. I used backward step selection in all following models in the results where non-significant variables were taken out to create a final model
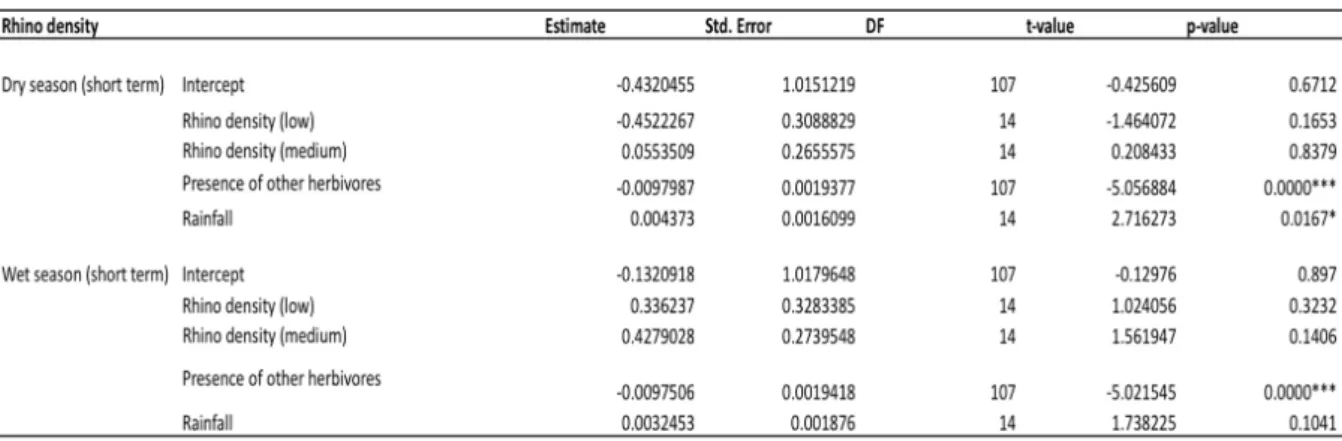
The presence of other herbivores was the main factor explaining the variation in grass biomass where grass biomass significantly decreased with increasing presence of other herbivores regardless of which rhino density variable was used (wet season or dry season) (Table 1). In the model using rhino dry season density, grass biomass increased with
increasing rainfall in the rhino density for dry season, but not in wet season (Table 1) (Fig. 6). There was no significant difference in grass biomass between areas with low, medium or high rhino density using either the wet season or the dry season density (Fig. 7).
Table 1: The different factors affecting grass biomass from the linear mixed effect model testing the effect of rhino density on grass biomass. The logarithm of the grass biomass data was used (response variable) to make the residuals normally distributed (Shapiro Wilk test: p-value=0.7103). The high rhino density category is within the intercept for each model (and all models shown in following results).
Figure 6. The relationship between rainfall and grass biomass in the model using dry season rhino density (p-value=0.0167*).
Figure 7. The relationship between rhino density and grass biomass: Dry season (left) and wet season (right).
3.3.1.B. The impact of rhino local use on grass biomass: white rhino dung
counts
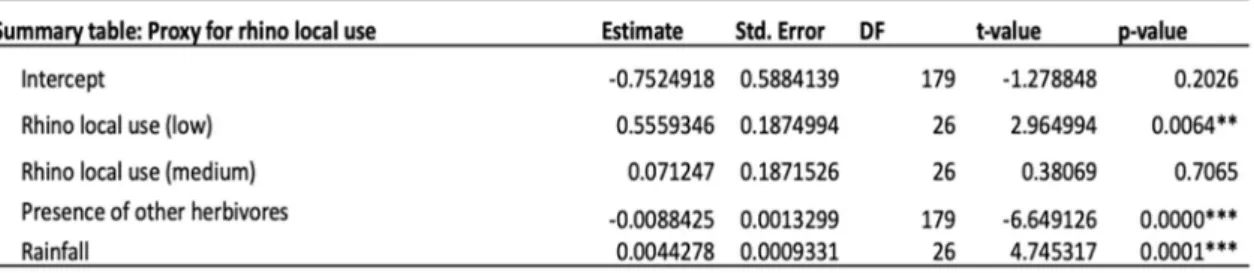
This model also shows that grass biomass significantly decreased with increasing presence of other herbivores and grass biomass increased with increasing rainfall (Table 3). Grass biomass was significantly higher in areas where rhino local use was low compared to areas with medium to high rhino local use (Table 2 & 3, Fig. 8).
Table 2.The different factors affecting grass biomass from the linear mixed effect model, with rhino dung as proxy for intensity of local use from rhinos. I log transformed grass biomass to make the residuals of the model normally distributed (Shapiro Wilk test: p-value=0.2128).
Table 3.Post hoc test showing the differences in grass biomass between the rhino local use categories, L=low, M=medium and H=high
3.3.1.C. The impact of poaching intensity on grass biomass
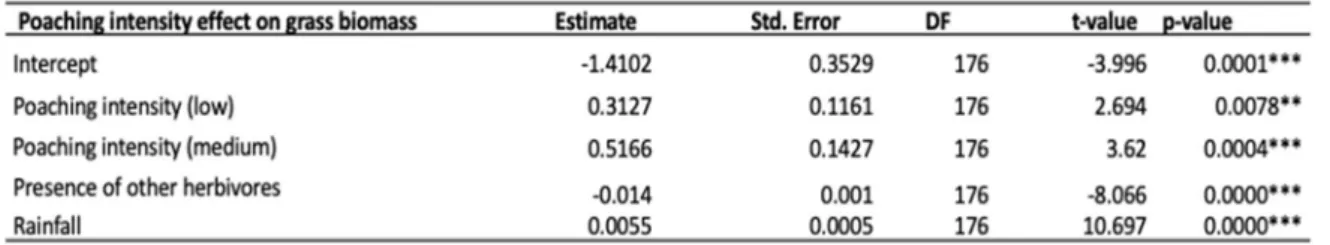
As in the previous model, grass biomass decreased with increased presence of other herbivores and increased as rainfall increased (Table 4). There was a significant difference in grass biomass between all poaching intensity categories. Medium poaching intensity had higher grass biomass than low poaching intensity (Post-hoc test: estimate=0.20392, Std. Error=0.085, p-value=0.0179*, t-value=2.39) and both medium and low poaching intensity had higher grass biomass compared to high poaching intensity (Table 4, Fig. 9).
Table 4. Poaching intensity and the different factors affecting grass biomass from the linear mixed effect model. The high poaching category is within the intercept.
Figure 9.The relationship between grass biomass and poaching intensity. There is a significant difference between all 3 groups (n=30).
3.3.2. Grazing lawn proportion
3.3.2.A. The impact of rhino density on lawn grass proportion: aerial census
count data of rhinos
The AIC estimation showed that the models including rhino density data over short term was again a better fit to the lawn proportion response variable for both dry season and wet season rhino density estimates. Areas with high presence of other herbivores was correlated with higher lawn grass proportion regardless of which rhino density variable was used (dry season or wet season; Table 5). Lawn proportion decreased significantly with increased woody cover (Table 5). When using the dry season rhino density variable, medium rhino density were associated with significantly lower lawn proportion than low and high rhino density (Table 6). There was no significant difference in lawn proportion between the rhino density categories when using the wet season rhino density (Table 6).
Table 5: The different factors affecting lawn proportion from the linear mixed effect model.
Table 6. Post hoc test showing the differences in lawn proportion between the rhino density categories, L=low, M=medium and H=high. Dry season (left) and wet season (right).
3.3.2.B.
The impact of rhino local use on lawn grass proportion: white rhino
dung counts
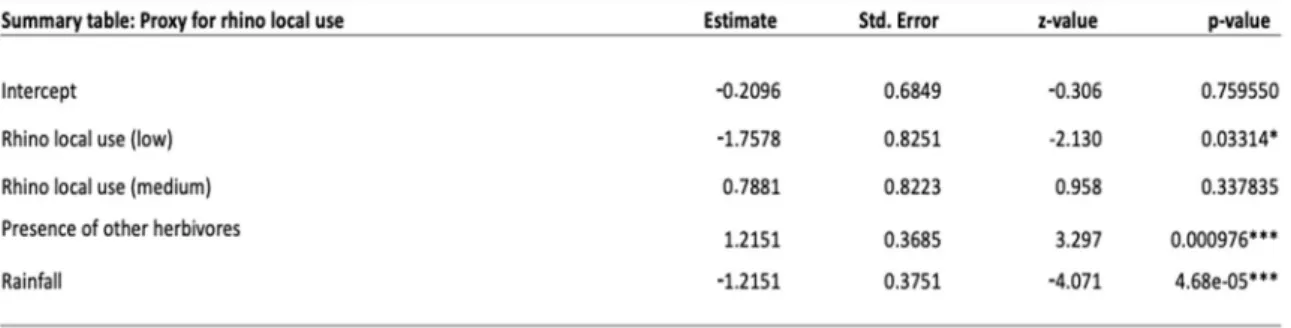
Lawn proportion decreased with increased rainfall and increased with increased presence of other herbivores (Table 7). There was a significant difference in lawn proportion between low and high rhino local use, where low rhino use had lower proportion of lawn than high rhino local use (Table 7 & 9, Fig. 10). Low rhino local use had also significantly lower lawn proportion than medium rhino local use but there was no significant difference between medium and high rhino local use (Table 8, Fig. 10).
Table 7.The different factors affecting lawn grass proportion from the linear mixed effect model, with rhino dung as proxy for intensity of local use from rhinos.I used sqrt-function on lawn grass proportion to make the residuals normally distributed (Shapiro Wilk test: p-value=0.072).
Table 8.Post hoc test showing the differences in lawn grass proportion between the rhino categories, L=low, M=medium and H=high.
Figure 10.The relationship between lawn grass proportion and the proxy for intensity of local use from rhinos (n=30).
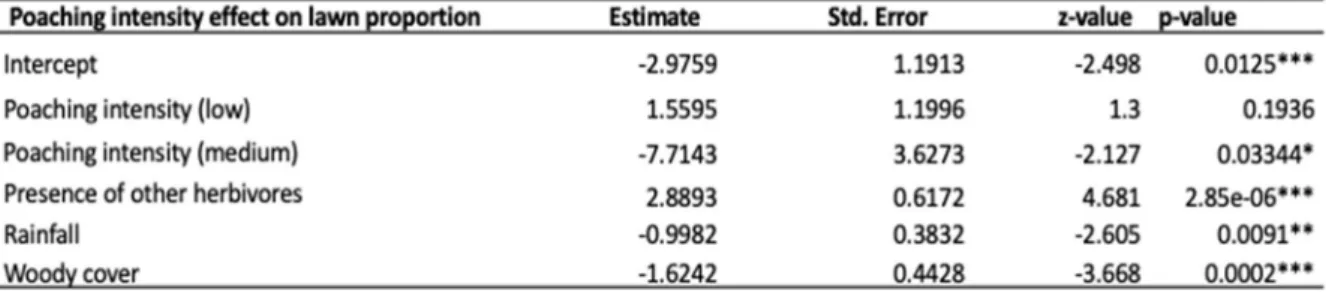
3.3.2.C. The impact of poaching intensity on lawn grass proportion: poaching
intensity
Lawn proportion increased as the presence of herbivores other than rhino increased and lawn proportion decreased with increased woody cover and increased rainfall (Table 9). Areas with medium poaching intensity had a lower proportion of lawn cover compared to areas with high poaching intensity but there was no significant difference between areas with low and high poaching intensity (Table 9 & 10). Areas with medium poaching intensity also had lower lawn proportion compared to areas with low poaching intensity (Table 10).
Table 9. Poaching intensity and the different factors affecting lawn grass proportion from the linear mixed model analysis. The high poaching category is within the intercept.
Table 10. Post hoc test showing the differences in lawn grass proportion between the poaching intensity categories, L=low, M=medium and H=high.
3.4. The impact of rhino density on grass biomass within lawn and bunch grass
sites
3.4.1 Lawn grass dominated sites
Grass biomass decreased with increased presence of other herbivores regardless of whether the wet season and dry season rhino density variable was used, or whether the rhino local use variable was used (Table 11). Rhino density or the degree of rhino local use did not influence grass biomass within lawn grass dominated sites (Table 11).
Table 11.The different factors affecting grass biomass within the lawn sites from the linear mixed effect model, with the dry season and wet season rhino densities and rhino dung as proxy for intensity of local use from rhinos as explanatory factors.
3.4.2
Bunch grass dominated sites
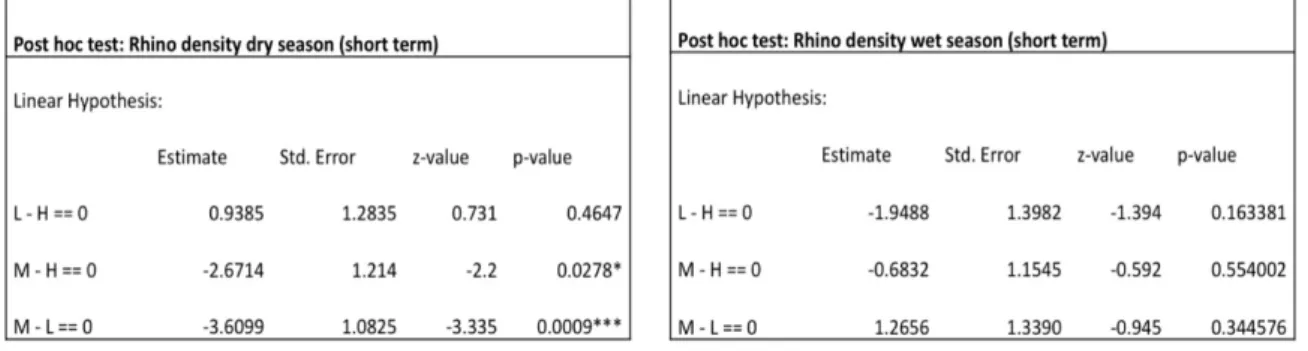
As with lawn grass dominated sites, grass biomass decreased with increased presence of other herbivores regardless of which rhino variable was used (Table 12). Grass biomass significantly increased as rainfall increased in the model using wet season rhino density (Table 12). Areas where rhino density was low during the dry season had significantly lower grass biomass than areas where rhino density was high during the dry season but there was no significant difference in grass biomass between areas where dry season rhino density was medium and areas where dry season rhino density was high or between areas where dry season rhino density was medium and areas where dry season rhino density was low (Table 12, Table 13). Wet season rhino density did not influence grass biomass (Table 15).
Areas where rhino local use was low had higher grass biomass than areas where rhino local use was high (Table 14). There was also a significant difference in grass biomass between areas where rhino local use was medium and areas where rhino local use was low where grass biomass was lower in areas with medium rhino local use. There was no
significant difference in grass biomass between areas with medium rhino local use and high rhino local use (Table 14, Fig. 12).
Table 12.The different factors affecting grass biomass in the lawn sites from the linear mixed effect model, with the wet season and dry season rhino densities and rhino dung as proxy for intensity for local use from rhinos.
Table 13. The difference in grass biomass between high, medium and low rhino density for dry season.
Figure 12.The relationship between grass biomass and the proxy for intensity of local use from rhinos in the bunch sites. There is a significant difference between low and high and low and medium, but no difference between medium and high.
3.5. Effect of poaching intensity on the change in grassland structure over time
Poaching intensity (poaching data from 2018 and 2019 combined) did not explain any change in the average grass biomass over time (estimate=-2.3968, Std. Error=1.8494,
p-value=0.3533, t-value=-1.0492). The same results was shown for lawn proportion, where poaching intensity did not significantly affect the average change in lawn proportion over time (estimate=0.0181, Std. Error=0.07904, p-value=0.8320, t-value=0.2296).
4.1. The relationship between rhino density, poaching intensity and rhino
local use
The reason for lack of correlation between rhino density and poaching intensity may be that rhino movement is too dynamic in such a small park since they move over large areas. Perhaps two aerial census counts per year is not enough to quantify rhino density, and more counts per year would provide with a more accurate result. At some stage, poaching intensity should influence rhino density but perhaps not at this small scale. Local densities of rhino may not necessarily change by poaching if new rhinos colonize high poaching areas, and poaching could therefore act as an ecological trap. If a study would be conducted
investigating this on a bigger scale, for example between different parks instead of within one park, it is logical to expect that rhino density is low in areas where poaching intensity is high. This study showed no relationship between poaching intensity and the rhino dung counts, and the reason for this could be that the scales between the two measurements differ too much. Poaching intensity measured over an area of 4 kmmay be too broad to correlate with the small scale of rhino dung counts that has been measured within 300x350 meters. Repeated studies in multiple parks with different poaching intensities, and also repeated measurements over time, would be a useful addition to our understanding of this issue.
There was no significant relationship between the dung counts of rhinos (proxy of rhino local use) and neither of the wet season and dry season rhino densities, but almost with the wet season density (p-value=0.078). This might be due to that the aerial census counts does not fit the small scale of my plots since it is measured in larger spatial scale, whilst the dung counts measure "rhino local use" more extensively. These results call for development of a more fine-tuned methodology to accurately fine scale rhino density in future studies.
4.2. The effect of rhino on grassland structure
I found mixed support for whether white rhinos reduce grass biomass and increase lawn grass proportion. Rhino density (measured through the census counts) did not have any significant effect on grass biomass. In the case with lawn grass proportion as response, medium dry season rhino density had significantly lower lawn proportion than low dry season rhino density. This is contradictory to my hypothesis which predicts that increasing rhino density would have higher lawn proportion. In the case with rhino local use as explanatory variable,
4 Discussion
and with the results found by Waldram et al. (2008) and Cromsigt & te Beest (2016). The rhino dung counts may fit the scale of my sites (300x350 meters) more accurately than the rhino density layers. More sites would be needed in order to make proper categories of the rhino density, and larger area where rhino density contrasts actually exists. Perhaps spatial variation in rhino density would be more accurately reflected in this park if more census counts per year would be done. There is also a risk that not all rhinos are detected from the aircraft when the aerial census counts are done due to a lack of visibility of rhinos in areas with a large number of woody encroachment. This might lead to an observation bias which may result in an inaccurate estimation of rhino density.
A possible explanation to why there is a trend for lower grass biomass and higher lawn proportion where the local use of rhinos is high, might be that rhinos actively select sites with these qualities. High rhino local use might be a result of the characteristics of grassland and not the other way around where grassland structure is the result of many rhinos. Rhinos choose quantity rather than quality during the dry season because the lawn areas are depleted in this time of year (Shrader et al. 2006). This might be the reason why the dry season rhino density layers showed higher lawn proportion in sites with low rhino density, since rhinos change their feeding sites to taller bunch grass sites during the dry season. To avoid this rhino selection, the sites were tested separately for lawn and bunch grass.
Neither of the rhino densities or rhino local use had any significant impact on grass biomass within the lawn sites. This might be because I measured grass biomass during the dry season when the lawns are not growing. The different sites might not differ in grass growth or grazing intensity as much as in the wet season, since the growth of grass is reduced and grazers seek out other grasslands during the dry season. It would be interesting to measure grass biomass within lawn sites during the wet season, when rhinos (and other herbivores) actively feed on lawn sites this time of year.
The wet season rhino density did not have any impact on grass biomass within the bunch grass sites. Perhaps the density data, as mentioned before, simply does not fit the small scale of my sites. The park might also be too small for rhino density contrasts to actually exist, there would have to be a larger area where rhino density differ more between different areas within one park, or more aerial census counts of rhinos than just two per year would be needed to map rhino density accurately. Low dry season rhino density had lower grass
biomass than high dry season rhino density within the bunch sites. This is contradictory to my hypothesis which predicts that increasing rhino density would result in lower grass biomass.
The model with rhino local use as explanatory factor showed the opposite from what the dry season rhino density showed within the bunch grass sites. Sites with low rhino local use had higher grass biomass compared to sites with high rhino local use. Grass biomass was also higher in sites with low rhino local use compared to sites with medium rhino local use. This finding is consistent with my hypothesis, and suggests that rhinos indeed reduce grass biomass.
Rainfall was increasing grass biomass significantly in all models (dry season rhino density, wet season rhino density and rhino local use) which was as predicted. Differences in rainfall did not predict spatial variation in lawn grass cover. Rainfall was expected to reduce the proportion of lawn cover as bunch grass easily invade lawns in wet conditions (Archibald 2008; Waldram et al. 2008). This unexpected result (where rainfall did not predict lawn cover) may be a side-effect of study design because I selected almost equal amount of lawn sites and bunch grass sites. Rainfall may have been a stronger predictor of lawn cover if I had sampled more randomly across the whole park. Woody cover was associated with lower lawn proportion. Perhaps grazing intensity is lower in these areas due to the landscape that is more
dense which makes it harder for herbivores to detect predators and they therefore select more open areas to minimize the predation risk. Thaker et al. (2011) found that herbivores select and avoid certain habitats rather than avoiding predator activity, indicating that they avoid risky habitats based on characteristics such as woody encroachment.
The presence of other herbivores was the key factor where grass biomass decreased and where lawn proportion increased which could mean that they have bigger impact on grass biomass than rhinos, just as the result of the study by Van der Plas et al. (2016) suggested. These results seem to contradict the results found by Waldram et al. (2008) where smaller herbivores could not replace the effect of rhino grazing under wet conditions. Although, I did not test the importance of other herbivores under different rainfall conditions.
However, it is hard to determine whether presence of other herbivores are drawn to areas with shorter grass and higher lawn proportion due to those grassland characteristics, and that herbivores therefore are higher in those areas. These areas might be created and
maintained by rhinos that are used by other herbivores and they therefore are more abundant on these areas. When counting dung of other herbivores at sites where grass height was very high (i.e. bunch grass sites), it was difficult to detect all dung piles due to the challenge of searching in high grass. Although effort was expended to ensure that all dung piles were located, there is a risk that some dung piles remained undetected and might have caused inaccuracy in the estimation of other herbivores. Rhino dung is on the other hand easier to detect even in areas with tall grass, and therefore the proxy for rhino local use is likely to be more accurate.
4.3. The effect of poaching intensity on grassland structure
I found mixed support for whether poaching intensity indirectly disrupt the function of rhino grazing. This type of analysis has, from what I have found in the literature, never been done before, where detailed poaching intensity data on rhinos are used to measure indirect effects in the ecosystem. The results showed that sites with medium poaching intensity had higher grass biomass and lower lawn proportion compared with sites with high poaching intensity. Sites with low poaching intensity was related with higher grass biomass than sites with high poaching intensity. These findings are contradictory to my hypothesis which predicts that high poaching intensity would increase biomass and reduce lawn proportion as high poaching would result in fewer rhinos. Although, sites with medium poaching intensity was related to higher grass biomass and lower lawn proportion compared with sites with low poaching intensity. This is on the other hand consistent with my hypothesis. The reason for this mixed results remain unclear.
However, since there was no significant relationship between poaching intensity and rhino density or rhino local use, there is no certainty whether poaching intensity represents many or few rhinos. Since there was such a strong significance in the relationship between grass biomass and the different poaching intensities, this result is worth mentioning even though there was no relationship between poaching and rhinos. Poaching intensity might not match the scale of the rhino density or the local use of rhinos. The result may indicate that high poaching intensity represents high rhino density since poachers could be attracted to sites where rhinos are more abundant, and more poaching events occur on these sites and vice versa. But as mentioned before, at some stage high poaching should result in fewer rhinos. Further studies would be needed in bigger parks, and also comparing between different parks, in order to find a relationship between poaching intensity and rhino density.
4.4. Effect of temporal difference in poaching intensity on grassland structure
Since there was no rhino density data available for the sites in Hluhluwe (except for the dung counts that was done in this study but was not available from 2018) poaching intensity was used as an indicator of rhino density in this temporal comparison. Since poaching intensity did show such a significant effect on grass biomass and lawn proportion in the spatial analysis, it is not impossible to expect that it could have an impact on grassland structure in this analysis as well. Although, there were presumably too few sites that were included in this analysis (6 sites) and there was not much spatial independence between them. Hence, it was not surprising there was no significant relationship due to the lack of a proper sample size. Further studies would be needed where more sites with larger spatial variationin order to make a proper comparison. Also, larger temporal variation could strengthen such a study, where more time difference could provide with a more appropriate temporal comparison.According to these results, rhino local use seems to be a fundamental factor increasing grazing lawns as it strongly correlates negatively with grass biomass and positively with the proportion of lawn grass. There was no statistical evidence that rhino density would be an important factor affecting grassland structure. However, I suggest that the methodology used here to quantify rhino density (biannual counts) may not have accurately reflected the
dynamic nature of rhino space use and more clear contrasts in small scale rhino density would be needed in order to estimate rhino impact on grassland structure. Additional studies in larger parks with more spatial variation in rhino density would be needed to achieve a reliable result. There are questions whether rhinos are the main driver in creating grazing lawns and if their impact is greater than that of other herbivores. However, rhino local use showed a
significant effect on grassland structure when analysing lawn and bunch grass sites separately, and the effect of other herbivores was less significant in that analysis compared with the previous analyses (with bunch and lawn sites combined). This may indicate that other herbivores might increase with low grass biomass and high lawn proportion due to this grassland attractiveness as a result from grazing by rhinos and that other herbivores in turn play an important role in maintaining the lawns. If the association between other herbivore presence and lawn abundance is a result of their selection of these sites, it suggests that rhino act as ecological engineers and keystone species if they create and maintain this important habitat for other species. Poaching intensity did not predict rhino density in this study,
although the results may indicate that high poaching represents high rhino density since grass biomass is lower and lawn proportion is higher in high poaching areas. However, if poaching continues to increase, high poaching will most likely at a future stage result in lower rhino density. It may be worthwhile to investigate this on a bigger scale and also to repeat this measurement in the future to investigate how the continuation of a park wide poaching trend may change grassland structure over time.
I would like to thank Joris Cromsigt for being my main supervisor, and for giving me the opportunity to be a part of this project, where discussions with him were very helpful. Many thanks to Phumlani Mangethe as the field technician and good company out in the field, where his knowledge about not only grass, but also the bush in general, was essential for me to conduct this field work. I also want to thank the rangers Falake Dlamini and Erick
Khumalo for looking after me out in the field and for sharing their knowledge about the bush and its animals. I am also grateful to the park ecologist Dave Druce together with Ezemvelo KZN Wildlife for letting me conduct the study in Hluhluwe-iMfolozi Park. I want to
especially thank my second supervisor Elizabeth le Roux, whose supervision during my stay in South Africa has been of greatest help and support. Thank you for your patience and all helpful discussions that have allowed me to grow as an ecologist.
Archibald S. (2008) African grazing lawns ‐ how fire, rainfall, and grazer numbers interact to affect grass community states. Journal of wildlife management, 72(2): 492‐501 Balfour D.A. & Howison O.E. (2002) Spatial and temporal variation in a mesic savanna fire regime: responses to variation in annual rainfall. African Journal of Range & Forage Science, 19: 45‐53 Biggs D., Courchamp F., Martin R. & Possingham H.P. (2013) Legal trade of Africa's rhino horns. Science, 339: 1038‐1039 Bransby D.J. & N.M. Tainton (1977) The disc pasture meter: possible applications in grazing management. Proceedings of the Annual Congresses of the Grassland Society of Southern Africa, 12(1): 115‐118 Coughenour M.B. (1985) Graminoid responses to grazing by large herbivores: adaptations, exaptations, and interacting processes. Annals of the Missouri Botanical Garden, 72(4): 852‐863 Craig T.P. (2010) The resource regulation hypothesis and positive feedback loops in plant‐ herbivore interactions. Population Ecology, 52: 461‐473 Cromsigt J.P.G.M. & te Beest M. (2014) Restoration of a megaherbivore: landscape‐level impacts of white rhinoceros in Kruger National Park, South Africa. Journal of Ecology, 102(3): 566‐575 Cromsigt J.P.G.M, Veldhius P.M., Stock D.W., Le Roux E., Gosling C.M. & Archibald. S. (2017) The functional ecology of grazing lawns: how grazers, termites, people, and fire shape HiP's savanna grassland mosaic. Conserving Africa's Mega‐Diversity in the Antrhopocene: The Hluhluwe ‐iMfolozi Park Story (eds. J.P.G.M. Cromsigt, S. Archibald, N. Owen‐Smith), Cambridge Univeristy Press, p. 135‐160 Douglas‐Hamilton I. (2009) The current elephant poaching trend. Pachyderm, 45: 154‐157 Estes J.D, Terborgh J., Brashares J.S., Power M. E., Berger J., Bond W.J., Carpenter S.R., Essington T.E., Holt R.D, Jackson J.B.C., Marquis R. J., Oksanen L., Oksanen T., Paine R.T., Pikitch E.K., Ripple W.J., Sandin S. A, Scheffer M., Schoener T.W., Shurin J.B., Sinclair A.R.E., Soulé M.E., Virtanen R. & Wardle D.A. (2011) Trophic Downgrading of Planet Earth. Science, Vol. 333 Lawton J.H. & Jones C.G. (1995) Linking species and ecosystems: organisms as ecosystem engineers. In: Jones C.G. & Lawton J.H. (eds) Linking species & ecosystems. Springer, Boston, MA, p. 141‐150 le Roux E., Clinning G., Druce D.J., Owen‐Smith N., Graf J.A. & Cromsigt J.P.G.M. Temporal
7 References
Story (eds. J.P.G.M. Cromsigt, S. Archibald, N. Owen‐Smith), Cambridge Univeristy Press, p. 135‐160 Hempson G.P., Archibald S., Bond W.J., Ellis R.P., Grant C.C., Kruger F.J., Kruger L.M., Moxley C., Owen‐Smith N., Peel M.J.S., Smit I.P.J. & Vickers K.J. (2014) Ecology of grazing lawns in Africa. Biological Reviews, 90: 979‐994 Howison, R.A., Olff, H., Owen‐Smith, N.O.R.M.A.N., Cromsigt, J.P. & Archibald, S. (2017) 2 r The Abiotic Template for the Hluhluwe‐iMfolozi Park’s Landscape Heterogeneity. Conserving Africa's Mega‐Diversity in the Anthropocene: The Hluhluwe‐iMfolozi Park Story, p.33. McNaughton S.J. (1983) Compensatory plant growth as a response to herbivory. Oikos, 40: 329‐336 Nasseri N.A., McBrayer L.D. & Schulte B.A. (2009) The impact of tree modification by African elephant (Loxodonta africana) on herpetofaunal species richness in northern Tanzania. African Journal of Ecology, 49: 133‐140 Oksanen L. & Oksanen T. (2000) The logic and realism of the hypothesis of exploitation ecosystems. The American Naturalist, 155(6): 703‐723 Owen‐Smith N. (1987) Pleistocene extinctions: The pivotal role of megaherbivores. Paleobiology, 13(3): 351‐362 Owen‐Smith N. (1988) Megaherbivores: the influence of very large body size on ecology. Cambridge University Press, Cambridge. Power M. E., Tilman D., Estes J.A., Menge B.A., Bond W.J., Mills L.S., Daily G., Castilla J.C., Lubchenzo J. & Paine R.T. (1996) Challenges in the quest for keystones. BioScience, 46(8): 609‐620 Pringle R.M. (2008) Elephants as agents of habitat creation for small vertebrates at the patch scale. Ecology, 89(1): 26‐33 Ripple W.J. & Beschta R.L. (2003) Wolf reintroduction, predation risk, and cottonwood recovery in Yellowstone National Park. Forest Ecology and Management, 184(1‐3): 299‐313 Shrader A.M., Owen‐Smith N. & Ogutu O. (2006) How a mega‐grazer copes with the dry season: food and nutrient intake rates by white rhinoceros in the wild. Functional Ecology, 20: 376‐384 Stock W.D., Bond W.J. & Van de Vijver C.A.D.M. (2010) Herbivore and nutrient control of lawn and bunch grass distributions in a southern African savanna. Plant Ecology, 206(1): 15‐27 Thaker M., Vanak A.T., Owen C.R., Ogden M.B., Niemann S.M. & Slotow R. (2011) Minimizing predation risk in a landscape of multipple predators: effects of on the spatial distribution of African ungulates. Ecology, 92(2): 398‐407 Van der Plas F., Howison R.A., N. Mpanza., Cromsigt J.P.G.M. & Olff H. (2016) Different‐ sized grazers have distinctive effects on plant functional composition of an African savannah. Journal of Ecology, 104: 864‐875 Van der Plas F., Zeinstra P., Veldhuis M., Fokkema R., Tielens E., Howison R. & Olff H. (2013) Responses of savanna lawn and bunch grasses to water limitation. Plant Ecology, 214: 1157‐1168 Veldhuis M.P., Howison R.A., Fokkema R.W., Tielens E. & Olff H. (2014) A novel mechanism for grazing lawn formation: large herbivore‐induced modification of the plant‐soil water balance. Oecologia, 182: 841‐853
Waldram M.S., Bond W.J & Stock W.D. (2008) Ecological engineering by a mega‐grazer: White rhino impacts on a South African savanna. Ecosystems, 11: 101‐112 Waller D.M. & Alverson W.S. (1997) The white‐tailed deer: A keystone herbivore. Wildlife Society Bulletin, 25(2): 217‐226 Walters M., Midgley J. J. & Somers M.J. (2004) Effects of fire and fire intensity on the germination and establishment of Acacia karroo, Acacia nilotica, Acacia luederitzii and Dichrostachys cinera in the field. BMC Ecology, 4:3 Whateley A. & Porter R.N. (1983) The woody vegetation communities of the Hluhluwe‐ corridor‐Umfolozi Game Reserve complex. Bothalia, 14(3/4): 745‐758 Western D. (1989) The ecological role of elephants in Africa. Pachyderm, 12: 42‐46
Latest issue number in our series Examensarbete/Master's thesis 2019:7 The role of predation in mass mortality of wood lemmings (Myopus schisticolor) Predationens roll i massdöd av skogslämlar (Myopus schisticolor) Author: Björn Wallgren 2019:8 An investigation into whether poaching creates an ecological trap for white rhinoceros in Hluhluwe‐iMfolozi Park, South Africa Author: Alice Michel 2019:9 Evaluating effects of preventive actions to reduce wild boar damage in the agricultural landscape Author: Matilda Söderqvist 2019:10 Fire effects in a landscape of fear ‐ food availability and predation risk as determining factors in microhabitat utilization prey in a heterogeneous landscape Author: David Kymmell 2019:11 Effect of variant ovarian fluid on sperm performance and egg fertilization rates of Arctic charr (Salvelinus alpinus L.) Author: Lwabanya Mabo 2019:12 Pedigree reconstruction reveals large scale movement patterns and population dynamics of wolverines (Gulo gulo) across Fennoscandia Author: Stephanie Higgins 2019:13 Community structure of polyporous fungi after wildfire in boreal forest Author: Isak Vahlström 2019:14 Population ecology of golden eagles (Aquila chrysaetos) using remote cameras Author: Andressa L. A. Dahlén 2019:15 Variations in nutritional content of key ungulate browse species in Sweden Author: Leonardo Capoani 2019:16 Assessing trust in the Swedish survey system for large carnivores among stakeholders Author: Philip Öhrman 2019:17 Beavers and environmental flow – the contribution of beaver dams to flood and drought prevention Author: Wali Uz Zaman 2019:18 Using camera traps to identify the influence of seasonal climate variations on the passage rates of a multi‐species ungulate community in Öster Malma, Sweden Author: Nicholas Varley 2019:19 Habitat selection in moose and roe deer – A third order comparison Habitatval hos älg och rådjur – En jämförelse av tredje Author: Irene Hjort