Faculty of Technology and Society Department of Computer Science
Master Thesis Project, 15 ECTS, DA613A, Spring 2015
Identifying Single and Stacked News Triangles
in Online News Articles
- an Analysis of 31 Danish Online News Articles Annotated by 68 Journalists
By Miklas Njor
Supervisor: Daniel Spikol Examiner: Bengt Nilsson Contact Information: Author: Miklas Njor miklas@miklasnjor.com Supervisor: Daniel Spikol daniel.spikol@mah.se Examiner: Bengt Nilsson bengt.nilsson.ts@mah.seAbstract: While news articles for print use one News Triangle, where important information is at the top of the
article, online news articles are supposed to use a series of Stacked News Triangles, due to online readers text-skimming habits[1]. To identify Stacked News Triangles presence, we analyse how 68 Danish journalists annotate 31 articles. We use keyword frequency as the measure of popularity. To explore if Named Entities influence News Triangle presence, we analyse Named Entities found in the articles and keywords.
We find the presence of an overall News Triangle in 30 of 31 articles, while, for the presence of Stacked News Triangles, 14 of the 31 articles have Stacked News Triangles. For Named Entities in News Triangles we cannot see what their influences is. Nonetheless, we find difference in Named Entity Types in each category (Culture, Domestic, Economy, Sports).
Popular Science Summary
The Internet forced the media to be more streamlined. It also resulted in a huge decline in circulation and revenue for newspapers, which further led to layoff of staff. The staff that are left are pressed for time, both when it comes to producing news, and putting the articles online and adding metadata to the content.
With the shift from reading news in a physical newspaper, to reading news online on computers or mobile phones, there has also been a change in reading habits, where readers now skim text when reading news online. To serve the reader the most important information first, when journalists write a news article for print, they use an overall News Triangle, that is, the most important information is at the beginning of the story. But for online news articles, the new idiom is to use a series of stacked News Triangles, so that each section is a News Triangle in itself, as this allows the reader to skim and understand the text more easily.
From a text-mining perspective this is interesting, because knowing how a piece of text is supposed to be structured, will make it more straightforward to teach a computer how to read and learn from the text, for instance to automatically add keywords and taxonomies. Dividing the text into even smaller more manageable chunks, could allow for even better output. However, one thing is planning how things should be, another thing is how reality actually plays out.
This paper finds, with the help of 68 journalists, that although the News Triangle does exist, the idea of dividing the text into smaller News Triangles is not so clear-cut and is problematic to identify. Only half of the articles we look at, consist of smaller News Triangles throughout the article, and exactly what influences whether or not there is a series of News Triangles still remains unclear. Thus more research has to be done to understand the complexity of how online news articles are structured.
Extended Abstract
ABSTRACT: The concept of a News Triangle is to place the most important information at the
top of the story. This is how news articles for print traditionally have been written. Due to online readers text-skimming habits and to make it easier for readers to understand the text, online news articles supposedly use a series of Stacked News Triangles, [1].
To identify and test if this pattern is meaningful for an automated process of annotating articles, we analyse how 68 Danish journalists annotate 31 articles and analyse where these keywords appear in each article. We use annotation keyword frequency as a measure of popularity. To see if Named Entities (Persons, Places, Organisations) influence News Triangle presence, we analyse Named Entities found in the articles and keywords. We also analyse Named Entities (NE) across article subject categories.
Motivation: Each day numerous articles are published on online newspapers. To make search
retrieval and recommendation of related articles easier, each article is manually annotated with relevant keywords, taxonomies and a category. This process is tedious and subjective, and over time keywords and taxonomies can become stale.
Automatically annotating articles with relevant keywords and taxonomies could help organise content better and ensure that keywords are always relevant. Furthermore, it could prevent high bounce rates, by suggesting more relevant articles to readers who enter the site via external links, such as social media[2], which in turn could lead to more page-views and revenue from online advertising.
Problem statement: While counting names in the text, or counting word frequencies,
concluding that names or most common words are what the article is about, the reality is more complex. Our intuition is that structuring online news articles by stacking News Triangles upon each other, will form an even more semi-structured document, and ease automated annotation, since algorithms will easier identify pivoting points. It is however unknown if News Triangles or Stacked News Triangles exist, are measurable or useful to identify.
Methodology: Sixty-eight Danish journalist annotate 8 articles from a set of 31 articles. From
the annotation data-set, the popular keywords in the 3rd quartile from each article are used to
measure keyword popularity across the articles content.
Each article is divided into partitions (Headpiece, Intro and subsequent Section blocks according to the original HTML markup) and the placement of keywords are mapped. The position and popularity count for each keyword is used to create a graph, showing the distribution of keyword popularity in each section block.
presence of one overall News Triangle and Stacked News Triangles. We also extract Named Entities from the articles and annotations, and analyse their presence, position and Named Entity Type.
Results: For the presence of an overall News Triangle in articles we find that this is true for 30 of
31 articles. For the presence of a series of stacked News Triangles within the content, we find that 14 of the 31 articles have stacked News Triangles in all sections. However, its is not clear what influences this behaviour. For Named Entities in annotations we cannot see what influences them either. We find difference in Named Entity Types in each category.
Conclusion: To our knowledge, this is the first time that News Triangles and stacked News
Triangles have been identified within Computer Science. Looking at the block level, it is however difficult to see what influence the News Triangle presence. We find that annotations quickly group around the same words. We also find that there is a difference in Types of Named Entities used for each category and that Named Entities mentions follow a Pareto power-law distribution as that of Zipf's law. We identify future work that needs to be done within this area of mining online news.
In the name of transparency and reproducibility we have uploaded much of the data and illustrations to http://plot.ly. Where possible, we will link from within the captions of the tables and illustrations. The raw data (annotations and participant data) can be found here:
Table of Contents
1 Introduction ... 8
1.1 Background ...8
1.2 The News Triangle ...9
1.3 Related Work ...11
1.4 Research Questions ...14
1.4.1 Research Question 1 – News Triangles ... 14
1.4.2 Research Question 2 and 3 – Named Entities ... 16
2 Methodology ...17
2.1 Articles - criteria and selection methods ...18
2.2 Preprocessing of articles ...18
2.3 Participants - criteria and selection methods ...19
2.4 Collecting keywords via a web questionnaire ...19
2.5 Analysis of collected tags ...21
2.6 Identifying News Triangles. ...22
3 Results ... 22
3.1 Participants ...23
3.2 Articles and Annotations ...25
3.3 Keyword Distribution ...28
3.4 Named Entities in Detail ...39
3.5 Named Entity Occurrence in Articles ...40
3.6 Named Entities in Keywords ...42
4 Analysis ...45
4.1 Analysis of Keyword Distribution and News Triangle Presence ...46
4.2 Analysis of Named Entities ...47
5 Discussion ...48
5.1 Future Work ...50
A Appendix ... 52
B Appendix ... 53
B.A Keyword Distribution – Culture ... 53
B.B Keyword Distribution – Domestic ... 57
B.C Keyword Distribution – Economy ... 64
B.D Keyword Distribution – Sports ... 67
C Appendix ... 69
C.A List of articles ... 69
C.B Grouping of articles in Categories ... 70
C.C Participants Job Functions and Job Titles ... 71
C.D Detailed look at count of Annotations of Keywords ... 71
Illustration Index
Illustration 1: Re-drawn example of “The News Triangle”...10
Illustration 2: Inverted News Triangle for print...15
Illustration 3: Inverted News triangles for online news...15
Illustration 4: Article from Politken.dk, explanations of elements, a Stacked News Triangle...16
Illustration 5: Annotations by article Category...28
Illustration 6: Article 27 - Keyword Distribution incl. All Popularity Fit...29
Illustration 7: Article 08 – Keyword Distribution incl. All Popularity Fit...31
Illustration 8: Article 29 – Keyword Distribution incl. All Popularity Fit...32
Illustration 9: Article 02 - Keyword Distribution incl. All Popularity Fit...33
Illustration 10: Article 31 - Keyword Distribution incl. All Popularity Fit...34
Illustration 11: Mean, std.dev, variance, std. error of NT presence Per Category and Blocks...39
Illustration 12: Frequency and Occurrences of Named Entities (NE) from all articles...40
Illustration 13: Normalised Percentage of Occurrence of Named Entities per Category...42
Illustration 14: Named Entity Type averages per Category for Named Entities keywords...43
Illustration 15: Normalised Percentage of Named Entity Types per Category...44
Illustration 16: Named Entity Types per Category & std. dev. Of Annotations...45
Illustration 17: Example of an article as presented to the participants...52
Illustration 18: Article 16 - Keyword Distribution incl. All Popularity Fit...53
Illustration 19: Article 17 - Keyword Distribution incl. All Popularity Fit...53
Illustration 20: Article 18 - Keyword Distribution incl. All Popularity Fit...54
Illustration 21: Article 22 - Keyword Distribution incl. All Popularity Fit...54
Illustration 22: Article 28 - Keyword Distribution incl. All Popularity Fit...55
Illustration 23: Article 23 - Keyword Distribution incl. All Popularity Fit...55
Illustration 24: Article 28 - Keyword Distribution incl. All Popularity Fit...56
Illustration 25: Article 27 - Keyword Distribution incl. All Popularity Fit...56
Illustration 26: Article 03 - Keyword Distribution incl. All Popularity Fit...57
Illustration 27: Article 05 – Keyword Distribution incl. All Popularity Fit...57
Illustration 28: Article 04 – Keyword Distribution incl. All Popularity Fit...58
Illustration 29: Article 07 – Keyword Distribution incl. All Popularity Fit...58
Illustration 30: Article 08 – Keyword Distribution incl. All Popularity Fit...59
Illustration 31: Article 13 – Keyword Distribution incl. All Popularity Fit...59
Illustration 32: Article 19 – Keyword Distribution incl. All Popularity Fit...60
Illustration 33: Article 20 – Keyword Distribution incl. All Popularity Fit...60
Illustration 34: Article 21 – Keyword Distribution incl. All Popularity Fit...61
Illustration 35: Article 24 – Keyword Distribution incl. All Popularity Fit...61
Illustration 36: Article 25 – Keyword Distribution incl. All Popularity Fit...62
Illustration 37: Article 26 – Keyword Distribution incl. All Popularity Fit...62
Illustration 38: Article 29 – Keyword Distribution incl. All Popularity Fit...63
Illustration 39: Article 30 – Keyword Distribution incl. All Popularity Fit...63
Illustration 40: Article 01 - Keyword Distribution incl. All Popularity Fit...64
Illustration 41: Article 02 - Keyword Distribution incl. All Popularity Fit...64
Illustration 42: Article 06 - Keyword Distribution incl. All Popularity Fit...65
Illustration 43: Article 09 - Keyword Distribution incl. All Popularity Fit...65
Illustration 44: Article 10 - Keyword Distribution incl. All Popularity Fit...66
Illustration 45: Article 11 - Keyword Distribution incl. All Popularity Fit...66
Illustration 46: Article 12 - Keyword Distribution incl. All Popularity Fit...67
Illustration 47: Article 14 - Keyword Distribution incl. All Popularity Fit...67
Illustration 48: Article 15 - Keyword Distribution incl. All Popularity Fit...68
Index of Tables
Table 1: Participant's Ages...23
Table 2: Participant's Graduation Year...23
Table 3: Participant's Education Length...23
Table 4: Question: "For how many years have you worked with annotating news articles?"...24
Table 5: Question: "When did you last work with annotating news articles?"...24
Table 6: Participant's Browsers and Operating Systems...25
Table 7: Averages and Five Number Summary of Article Categories Annotation Rate...26
Table 8: Annotations Overall...26
Table 9: Keyword Annotations per Category: Culture 7, Domestic 14, Economy 6, Sports 4...27
Table 10: Presence of News Triangles across all Sections and per Single Sections basis...36
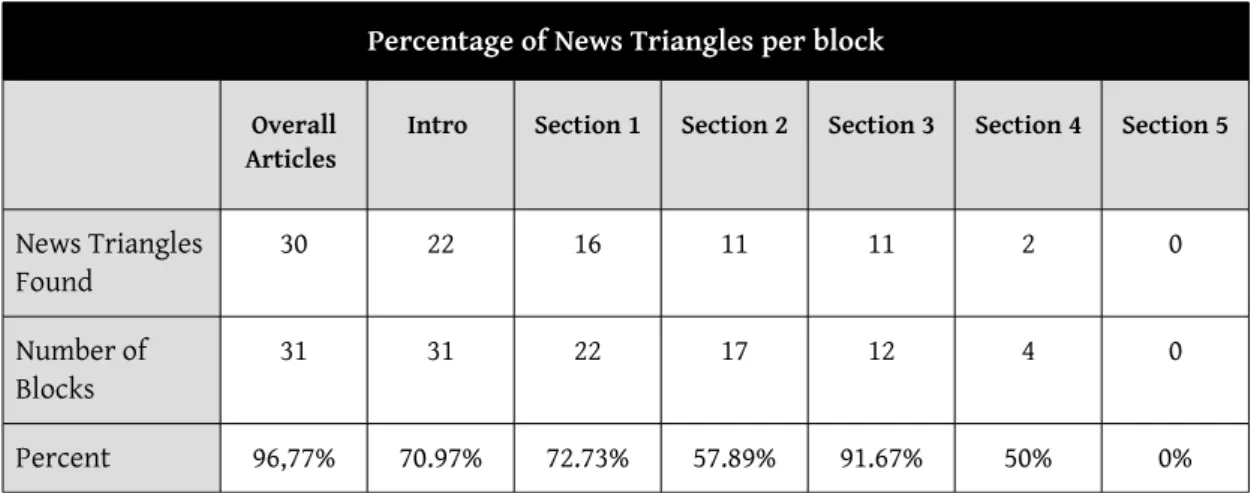
Table 11: Percentage of News Triangles per block...37
Table 12: Mean, Standard Deviation, Variance and Standard Error for all Blocks/Categories...38
Table 13: Grouping of articles in Categories...70
Table 14: Job Functions and Job Titles...71
Table 15: Detailed look at counts of Annotations of Keywords...72
Table 16: Occurrences of Named Entities per article for Culture...72
Table 17: Occurrences of Named Entities per article for Domestic...73
Table 18: Occurrences of Named Entities per article for Economy...73
Table 19: Occurrences of Named Entities per article for Sports...73
List of acronyms
ML Machine Learning
NE Named Entity
NLP Natural Language Processing
NLTK Natural Language Tool Kit (a Python programming language library)
NT News Triangle
POS Part of Speech
TF-IDF Term Frequency Inverse Document Frequency
LF Linguistic Features
LA Lexical Affiliates
HCA hierarchical clustering algorithm
CMS Content Management System
HTML Hyper Text Markup Language
Concepts
Latent Dirichlet allocation (each document is a mixture of smaller topics) Entropy (information gain)
1 Introduction
Each day numerous articles are published in online newspapers. In order to make search retrieval and recommendations of related articles to readers easier, each of these articles are manually annotated with relevant metadata including the article's keywords, taxonomies and the category it belongs to.
The information in newspaper articles is presented in descending order of importance, where important information is relayed first. Within journalism this is known as the “News Triangle”, where the writer explains “What happened”, “How it happened”, “Amplify the point”, “Tie up loose ends” (WHAT) [3]. The article is written using one large News Triangle, with a headpiece, an introduction followed by smaller section blocks, where the level of informations diminishes the further you read. The writing process has worked well for more than a hundred years. However, the process of writing for online is different than writing for print. According to Tverskov & Tverskov [1] (2004) and Sissons [3] (2006), the classic print article changed somewhat when it entered the online arena. The setup of a headline, a sub headline, an introduction followed by several section blocks still holds. But where articles written for print, with a limited space not known in advance, are produced to be quickly edited bottom-up, online articles are not limited in the same way. Moreover, readers of online news tend to skim text instead of reading from top to bottom. This has supposedly led to a shift from using one overall News Triangle, towards using smaller News Triangles for each sub-section [1] (pp. 40).
If it is the case that articles are partitioned into smaller News Triangles where the level of important information decreases the further into the article we read, this could make keyword extractions and knowledge discovery easier. When designing algorithms, we would be able to add weights to each section and compare keyword's placement. With this in mind, this paper investigates what the structure of a set of online newspaper articles actually look like.
1.1 Background
For many years the newspaper was a distribution channel for news and advertising. With the Internet, online newspapers became just one of many options for users to spend their time and advertisers to spend their money. This change brought on a huge decline in circulation and revenue for newspapers, and many newspapers are today struggling to survive. A consequence of the decline is layoff of staff, and the staff that are left, are pressed for time. Both when it comes to producing news, but also when placing the articles online and adding metadata. In a physical newspaper there is a clear priority of content and each article undergoes an editorial process before publication. On the front page there are a number of top stories prioritised as A (above the fold), and B and C stories (below the fold). Inside the newspaper, stories are prioritised using page numbers, images, headline sizes, position on page etc. There is
a clear indication of the newspaper sections (Domestic, International, Sports, Culture, etc.). Physical newspapers have a finite state, a beginning and end, for a given period, usually a day. For online newspapers the story is slightly different. The newspaper's homepage (front-page) can feature 50-100 stories shown in semi-prioritised chronological order, changing throughout the day. The newspaper sections are different, in that they follow an identical design resembling that of the homepage, where the articles are displayed in a chronological manner. Thus the hierarchy and prioritisation on newspaper websites is different from a physical newspaper and news media are well aware of the fact [4].
To combat the need for better navigation, findability and recommendations for users, newspapers employ Information Architecture tools like keywords, hierarchies, taxonomies, automated recommendation systems, and classification (sections) among other aspects [5]. These tools are managed according to journalistic principles, and are set and prioritised by journalist who have knowledge of the domain area. This can be a laborious and repetitive task, which often needs careful planning [6][7].
1.2 The News Triangle
“News stories should flow logically from the first paragraph. They should have pace and no unnecessary elements should slow the story down. And even though readers won’t see a structure, there is one. For hard news there is quite a strict structure. One way of looking at it is through the News Triangle or inverted pyramid. Generations of journalists have been brought up on this.” - Sissons [3] (pp. 70).
The reason for placing the less important news at the bottom of the article, is useful when you don't know in advance, how much space there is on the physical newspaper page, where the article is supposed to be placed. The story's priority might change or the allotted space might have to give way to an advertisement. Knowing that content placed at the bottom of the article is less important, makes it easier and quicker for editors, who might not know what is important to the story, to edit the text. As such, the structure serves a guideline.
It is also useful to the reader, that information is presented in a logical order. Especially for readers of online news. According to Sissons and Tverskov & Tverskov, when a journalist writes for online news, the text should be even more structured, consisting of not one giant News Triangle, but many. Condensed blocks of information allow readers to skim the article and quickly go back and forth in the text.
Looking at Illustration 1 above, we could also conclude, that although the information should be more concentrated at the top of the triangle, the “What happened” could possibly contain more Named Entities (Names, Places, Organisations), since something happened to someone/something, “How it happened” could contain more verbs since these often describe some kind of action, “Amplify the point” could be considered a summary together with “Tie up loose ends”.
Another strong point to highlight about online news as a structured landscape for information, is that space is endless. Journalists are not forced to cram all information into one article, but can divide the article into several articles and link them together via hyperlinks. This allows journalist to dig a little deeper about what they are talking about in each piece, which in turn could mean that each article is more to the point and the information is condensed [3] (pp. 143) [1] (pp. 40). Knowing how a text within a certain domain is supposed to be structured could greatly enhance successful data-, text-mining and Natural Language Processing (NLP).
Common data- and text-mining, and NLP techniques
There exist many Data Mining [8], Natural Language Processing (NLP) techniques and tools [9], and frameworks like NLTK [10], for automating the extraction of keywords and classifying text. Below we highlight some of the many techniques and concepts used within machine learning, data- and text-mining, and NLP.
Common Preprocessing Steps: Text is normalised so as to better be able to count and compare
tokens in the text. First, common stop words (“a”, “I”, “it”, “he”, “she”, etc.) are removed. The text is separated into sentences, and words are tokenised (Within NLP words are called tokens). Each token is stemmed, that is, plural s's are removed.
Part of Speech (POS): Part of Speech tagging (POS) is the process of identifying nouns, verbs
and Named Entities (Names, Places and Organisations) etc. This is done by comparing each token with the tokens that surround it and the likelihood of that the token being a certain
POS-tag given a certain context. I.e. “gay men”, can mean both happy males or homosexual males depending of the context of the surrounding text.
Frequency Count and Frequency Distribution: A common step in identifying what a text is
about, is to count and rank the occurrence of tokens. The idea is, that the more often a word appears, this is also what the text is about. Frequency Count can be combined with Frequency Distribution, where the most common token's occurrences are mapped across the text corpus.
Unigrams, Bigrams and Trigrams: A single token (one word) is called a unigram. Two tokens
next to each other are called bigrams and three tokens next to each other are called trigrams. Unigrams, bigrams and trigrams etc. are often used together with Frequency Count and Frequency Distribution.
Collocations: Collocations (also known as Lexical Affiliations) are separate words that appear in
conjunction. The notion of conjunction can be tuned according to how far from each other the words are “allowed” to appear. The idea is, that if words like “software” and “upgrade” often appear fairly close together, they should be considered as a single concept: “software upgrade”.
TF-IDF: Term Frequency Inverse Document Frequency (TF-IDF) is a technique where terms or
tokens widely distributed across the document, are ranked higher than frequently occurring terms. The notion is, that a wide distribution of a term means that the term is used throughout the text, and thus must be important.
Organisation of content
The paper is organised as follows: Section 1 features 1.3 Related Work and 1.4 Research Questions. Methods (section 2) are explained on page 17 - 22 . Results (section 3) are shown on page 22 - 44. The analysis (section 4) starts on page 45 and the discussion (section 5) starts on page 48. To not interrupt flow, illustrations of Keyword Popularity Distributions are for a large part moved to Appendix A on page 53. A list with links to the articles used in this paper, and some larger tables can be found in Appendix C on page 69.
1.3 Related Work
Extracting relevant keywords from texts is not a new area of research and much research within machine learning (ML), data- and text mining, and Natural Language Processing (NLP) focuses on this area. However, we have not been able to find research which uses human annotators or evaluators before the algorithms have run, which is our approach, since we use the input as an evaluation measure to identify News Triangles, not as a measure of evaluating if our model is correct.
Dividing the text into smaller chunks for weighing output of keywords or selecting appropriate taxonomies or classification is an area with some research. A common denominator for most studies is using online news articles and algorithms to tackle specific domains of knowledge. While the concept of a News Triangle is well known within journalism, there is, to our
knowledge, no research that identifies News Triangles in a scientific manner within the domains of machine learning, data- and text-mining, or NLP. A common technique within text-mining and NLP is to look at frequencies of occurrence across a text corpus as a means to understand what the text is about, however, we have not been able to find research that uses the notion of keyword popularity from annotations as a way to measure information density.
How we searched
We have searched for original research articles using Malmö University's Summon search service, the websites of IEEE, ACM, ScienceDirect and Google Scholar, but found very little relevant research, so our strategy was to follow citations up and downstream for the articles we did find. The main search terms are “News Triangle”, “HTML blocks”, “Keyword Popularity”, “Keyword Extraction”, “Information Density”, “Named Entities”, either as standalone searches, in combination with each other, or with “data mining”, “text mining”, “Natural Language Processing” o r “NLP” attached to the search term. Below we present eight relevant research papers.
Categorisation and topic identification
Muller, Dörre, Gerstl & Seiffert, (1999) [11] describe the use of TaxGen, an automated taxonomy generator based on a hierarchical clustering algorithm (HCA). By using a bottom-up iterative approach, where each text is analysed, the system slowly builds a taxonomy. The results are analysed against the training set and show above 99% positive results. The authors preprocess the text to find Lexical Affiliates (LA) and meaningful subjects in the text limited to a maximum of top five keywords. They also use Linguistic Features (LF), also known as Named Entities (NE), to extract names and places of people and go into great detail about how difficult this is to use as taxonomies, since the clustering algorithm chokes. This could prove problematic for news articles, where journalist, in order to spice up the language, use synonyms, or only first or last names. The text documents in the paper are from news-wire services, where the language is much more compact. There is also a possible misunderstanding of what classes and taxonomies are, where the authors seem to mix the too, but this is not explicitly clear from the text.
In explaining TopCat [12], Clifton, Cooley & Rennie (2004) give a very thorough walkthrough of the problems of NLP and text-mining, explaining problems and suggesting possible workarounds. Their process too, is removal of stop words along with NE extraction to get a more coherent sets of text bodies. The NE's are used to map articles to topics, i.e. “Sampras”, the American tennis player Petros Sampras, is mapped to the “tennis” concept. They also use TF-IDF to find important words in each text, which substantially improves the results. TopCat finds around 30% more similar documents as that of a human process, however the authors are clear in stating that their results are difficult to evaluate. Nonetheless it is a solid piece of work that shows the difficulties in automation and text mining. They also note, like Muller, Dörre, Gerstl & Seiffert above, that computation takes a very long time and conclude that the experiment is a
success even though the output is small. But this is based on algorithm evaluation by users, which could be a sign of any improvements are good, since annotating content is a complicated and time-consuming task for users.
Denecke & Brosowski also follow a recipe of preprocessing, where stop words are removed, words are stemmed and sentences processed to find the related topic, in the 2010 paper “Topic Detection in Noisy Data Sources“ [13]. Only sentences with a minimum of four words are considered, and a Latent Dirichlet allocation (each document is a mixture of smaller topics) is performed on each sentence. A keyword is only considered if it is contained in minimum 15 sentences. Finally the top five keywords are chosen as the keywords describing the article. The algorithms is tested on medical blogs, slashdot.org and 14 products from Amazon.com. The algorithm performs best on blogs and Amazon.com products, which might be due to the more strict structure of blogs and Amazon.com product pages. The authors use annotators to test the output against, but these have difficulty with medical blogs due to unfamiliarity with the domain. Again there is confusion about classes, taxonomies and keywords.
Reza & Matin discuss in “Application of Data Mining For Identifying Topics at the Document Level” (2013) how to identify topics at the document level [14]. The authors start by looking at the sentence level using unigrams and bigrams, and Named Entity extraction and analysis, but do not get satisfactory results. The authors then move on to the paragraph level and begin to see good results on their test-corpus and the feedback from their test audience. This is promising result for our purpose. However the authors do not take into account the use of semantics and synonyms to get the true meaning of concepts and words. It is also unclear if they have used stemming of words to find similarities.
Keyword extraction
Although they do not seem to be aware of the concept behind News Triangles, Nørvåg and Øyri [15] describe a process where only the front page of online newspapers are used to extract news from. Their intuition is, that headlines are short, to the point and created by humans, which leads to higher classification accuracy than an automated process. They text-mine the front-page of online newspapers and each news item is added to a database, with a link to the article. The headpiece is used to categorise the article. This process takes up a lot less hard-disk space and saves time regarding data cleaning. Their approach is somewhat problematic, in that not all newspapers link their headlines to the article or they might use different HTML markup, depending of where the article is placed on the webpage, which changes as the news items slides down the newspapers homepage during the course of the day. Apart from the problem of creating a template for each online newspaper, the logic behind the extraction process can be complex. Furthermore, although news headlines are condensed with information and are written by a person with domain knowledge of what the article is about, the process looses out on possible valuable knowledge, which could have been mined from the article itself.
By looking at each block (section element) and analysing the particular block's entropy (information gain), Huang, Yen, Hung, Chuang, & Lee (2006) [16] propose to consider both structure and information by adding weights to each block of text and letting the algorithm decide which block is more informative. The authors conclude that using only entropy to classify block importance, gives poor results in real life when tested on live websites. They regard that future work in this area needs to be done. They also note that a side effect of a boolean selection is that some blocks don’t reach a certain threshold for selection and are deemed un-useful, even though a manual human process deems the block to be informative. They conclude on this part, that a ranking of blocks could be more useful.
In “Automatic free-text-tagging of online news archives” from 2010 by Farkas, Berand, Hegedús, Kárpárti & Krich [17] the authors extend the above mentioned set-ups by using semantics from wikipedia. From the corpus they filter the keyword list to a fixed size based on statistics of the site average. The headlines, sub-headlines etc. contain important words and the authors perform TF-IDF on these parts to determine importance. The authors find that the raw text and links to other articles are mostly noise. The authors also touch on the problem with non english words using the available tools and frameworks on non-english languages. The use of wikipedia.org for semantic extraction seems to circumvent this challenge greatly.
In “Topic identification based on document coherence and spectral analysis” [18] from 2011, D'hondt, Verhaegen, Vertommen, Cattrysse & Duflou, treat texts as a non-sequential stream of words, where the best parts of information could lie anywhere in the text. The authors use a technique of lexical chains to quantify and describe similar keywords from different text blocks. They add a score to keywords that appear closer to each other, word by word, sentence by sentence, so occurrence of the same word very close to each other, receives a higher score than words occurring similar times but further apart. Their technique receives good precision and recall on both large randomized and standard test sets. The paper goes in great detail of explaining the set-up of their experiment along with explanations of algorithms used. Their approach is different to our line of thought, since our intuition is, that information is grouped into blocks of knowledge, and that each section carries and adds weight to each keyword, we choose to partition the article into sections.
1.4 Research Questions
The research questions set out to identify: the presence of News Triangles and Stacked News Triangles; if Named Entities influence the presence of Stacked News Triangles; and what the differences are among Named Entities across categories.
1.4.1 Research Question 1 – News Triangles
Research Question 1: To what extent do online news articles follow the idiom of many News
of the text. I.e. do the keyword candidates appear less frequently the further we move away from the start of each element block?
Methodology and assumptions for Research Question 1
The participants annotate a selection of articles with keywords. The more often a keyword is mentioned, the more popular it is, i.e. it has a higher value. To make sure only the most important keywords with the highest value are used for looking at keyword popularity, only keywords that belong to the top 3rd quartile are considered.
A News Triangle (an inverse triangle) is a triangle where most of the information is in the top part (see Illustration 2, 3 and 4). Thus, what we are looking for is the majority of popular keywords in a text across a vertical time line, will have spikes of popularity that follow what is seen in Illustration 3. Moreover, we want to see if what is taught about writing for online is in fact true. We will look for patterns that resemble those seen in Illustration 3 and 4, where the spike starts at the left side and descends downwards. The hypothesis is, that online news follows a pattern that resembles Illustration 3 and 4.
Note that we are not measuring where the keywords begin or end. We are looking for a boolean value, a True or False, of whether there is an overall News Triangle and/or a series of Stacked News Triangles.
Below we have inserted the News Triangles as per the theory of Sissons [3] and Tverskov & Tverskov [1]. Note that the article may be organised exactly the same in online and print version. We are only concerned with only online news and do not take into consideration the print version.
1.4.2 Research Question 2 and 3 – Named Entities
Research Question 2: Given that much news concerns something that happened to someone
somewhere, what influence does Named Entity keywords have on the presence of News Triangles and Stacked News Triangles?
Research Question 3: Is there a distinct variance of Named Entity Type (Persons, Places or
Organisations) in keywords within the categories (Culture, Domestic, Economy, Sports)?
Methodology and assumptions for Research Questions 2 and 3
Named Entities from the 3rd quartile keywords are extracted and divided into the following
misspellings like “Georg W Bush”, “Georg W. Bush”, “George W. Bush”. Each NE Type is grouped by type and category. Standard Deviation across NE and Non-NE is used to identify the influence of NE's on News Triangle presence.
The concept of the News Triangle is to describe what happened to someone/something. As described in the Background section above, the “What happened” part of the News Triangle could possibly contain more NE's, since something happened to someone/something. Investigating whether the “How it happened” contains more verbs since these often describe some kind of action, or if the “Amplify the point” and the “Tie up loose ends” are used for summarisation, is however out of the scope of this paper.
Relevance of research questions
Gaining knowledge of how news articles, which are semi structured texts, are partitioned into smaller but discernible parts, is of great value to automated keyword extraction and the process of automatically tagging news articles in a more relevant way, which could produce better results when fetching related and relevant content.
Contribution
We expect to find that all news articles use an overall News Triangle to present information and to a large extent that we will find that most element blocks contain News Triangles as per our definition in Illustration 3 and Illustration 4 above. We expect a majority of keywords to be NE's and that there is distinct difference between NE Types for each category.
2 Methodology
On the onset of this paper the idea and scope was to explore more than keywords and News Triangles, thus the questionnaire, which forms the basis of the data collection method, also asked the participants for input about taxonomies and category. The data about taxonomies and categories has not been used in this paper.
Quick overview of methodology
Sixty-eight Danish journalist are each asked to add keywords to a random selection of eight news articles from a set of 31 articles. Each article is divided into partitions (Headpiece, Intro and subsequent Section blocks according to HTML markup). The keywords for each article are ranked according to occurrence and the popular keywords in the 3rd quartile are used to
measure keyword popularity in the article. The popular keywords from each article are searched for in the article, and their position, if found, is mapped for each section block. The position and popularity count for each keyword is used to create a graph, showing the distribution of keyword popularity in each section block. A linear fit, acting as a boolean value, is set across each section block and the entire article, to measure if the keyword distribution ascend or descends. An ascent from left to right indicates that there is no News Triangle
present. A descent from left to right indicates that there is a News Triangle.
For analysis of NE's we extract NE's from both articles and annotations using NLTK and our own automated method. Only NE annotations found in the 3rd quartile are considered.
2.1 Articles - criteria and selection methods
We use 41 articles from the online edition of the Danish newspaper Politiken1 of which we have
selected 31 articles to test on. The original intent for this paper, was to also build and test an algorithm based on the initial results, using the remaining ten articles as a test-set. However, on first inspection of the annotations by the participants and mapping of keywords to each article, we decided to instead dig deeper into what caused the presence and non-presence on News Triangles and Stack News Triangles.
The criteria for selecting articles is to get recent articles from the categories: domestic news (14 articles), economy (6 articles), sports (4 articles) and culture (7 articles). By selecting articles from four common newspaper categories we are able to generalise the results better. The reason for choosing recent articles is that we wanted the participants to be fairly on par with what the article was about. The article's subjects are: terror in Denmark, politics, integration, music streaming, schools, education, the Copenhagen metro, credit cards, sports games.
We have not looked at, or consider it relevant, to include data about the article's author, since this should not influence the presence of News Triangles.
All articles are written and edited by Politiken staff and the articles have been approved for use in this thesis by Politiken's copyright office. No articles are from news-wire services. The full list with links to articles can be found in Appendix C on page 69.
2.2 Preprocessing of articles
Each article's URL is accessed via a browser and the full HTML source-code is copied to a text document and saved. The reason for not scraping the content automatically, is due to Politiken.dk's paywall system, where users are only allowed to access five articles per month. This can however can be bypassed by using the Chrome browsers “incognito” functionality. Using the Python library BeautifulSoup42, each text file is processed to removed excess elements
in the HTML, such as links to advertisements, navigation, semantic content etc. Only the HTML surrounding the content is extracted. Based on the extracted HTML and content, a new HTML page is generated, where the content is marked up to only contain H1 HTML-tags for the title, H2 HTML-tags for the headline, H3 HTML-tags for the subsequent section block sub-headlines and HTML p-tags for paragraphs. The new HTML page does not contain images, image captions, author bylines, dates, category identification or links to related stories.
1 http://politiken.dk
2.3 Participants - criteria and selection methods
The participants where chosen via the authors network of former colleagues in the Danish media business. The participants have a wide background in the field of journalism, ranging from broadcasting to traditional print and online media. Their ages, annotation experience and type of education varies. Having said that, there is a bias towards participants being forty years of age, working with print media and having completed an education from the Danish School of Journalism in Aarhus around the year 2001.
113 journalist where invited via email and Facebook chat to participate, 37 journalist never replied back, nine journalist declined and 71 journalists opted to participate of which 68 completed the test. There does not seem to be a difference in opt in rate over which invitation method was used.
During the invitation process, several participant showed great interest in the research at hand, since tagging (and updating taxonomy catalogues) is a daily chore, which according to some participants, does not work to it’s full potential. Many felt that a lot of repetitive work was done (and lost), and the newspaper's Content Management System's (CMS) where not good at matching keywords and taxonomies or suggesting related articles. There where also many who did not know what a taxonomy was, even though they, one imagines, work with one daily. This could be due to online newspapers still hold on to the notion of classifying content into strict sections, as they have done with print, where there is a natural physical affordance.
2.4 Collecting keywords via a web questionnaire
Questionnaire
The URL to the questionnaire (http://tagging.miklasnjor.com) is emailed or posted via Facebook chat to the participant, and each URL contains a unique participant ID (example:
http://tagging.miklasnjor.com/index.php?
userid=MN123). As mentioned earlier, we initially
wanted to also test an algorithm, and to be able to make comparisons between test one and two (test two never took place) each participant is also assigned an internal user ID.
For copyright reasons the questionnaire is not made public. The article layout for the questionnaire is responsive so as to fit all device types, although participants are informed that the test is best taken on laptop/desktop computers or tablets. This step is done since a large portion of the participants are contacted via Facebook and there is a chance that they received the URL via their mobile phones.
To avoid looking like the most common Danish newspapers, the typography used is that from the WordPress theme TwentyThirteen3, which we conclude has undergone tests for readability.
On the introduction page, the experiment is explained to the participant, what the data will be used for and that the data will be treated anonymously. Definitions of what is meant by
keyword, taxonomy and section are also explained.
On the next page, participants are asked to enter data about their education type, year of finishing their education, current job title, current job function, overall editorial tagging experience, and years since working editorially with annotating content. This is done to see if there is differences in annotation rate and keywords entered, between participants tagging experiences and years since tagging articles, or education, job function and job title. After the second page, participants continue to the main test, where they are asked to annotate eight articles. The data was collected over a three week period from mid March, 2015.
Layout of articles
For each article page, the participant is presented with the article, where the markup follows common HTML principles, where headline gets a <H1> HTML tag, sub headlines gets a <H2> HTML tag and so forth described earlier in 2.2 Preprocessing of articles on page 18. See example of a page in Illustration 17 in Appendix A on page 52.
Reading wide pieces of text on a screen is cumbersome, so we choose to set the max width of the text to 760 pixels. Alongside the article is a box for writing keywords, taxonomies and categories. The box follows the top of the web-page, so participants avoid scrolling up and down when they read the article and need to enter data.
Underneath the box is a link to the bottom of the article where the difference between keywords, taxonomies and categories is explained. This is done to make sure that if doubt or uncertainties arise, participants can quickly get information about definitions, a need that was raised by some participants prior to taking the test.
Choice of articles presented to the participant
The first time a participant is presented with an article, the article with the least annotations is fetched from the stack of articles, to make sure that we get as many articles annotated by a wide group of participants. This process continues except for the third and fifth article, where the participant is presented with the most annotated article, as we want to see if there is a difference in keywords between articles with less and more annotations.
Questions asked
The participants are asked to read the article and annotate the article with: • Keywords: Which keywords are relevant to the article.
• Taxonomies: Which taxonomies they would place the article in (based on their assumption).
• Classification: In which section the article belongs (based on their assumption).
The data is entered into the on-page box mentioned in Layout of articles above, with either one keyword per line or keywords comma-separated. Note that a keyword can consist of several
words, i.e. “Football Stadium”, “Terror in Denmark” or “Klaus Riskær Pedersen”.
When the participant has annotated the article they click the “Next article” button. The data they entered is saved to a database and they are presented with a new article which they are asked to add keywords to. We choose to save the data after each annotation. As such, there is no minimum or maximum amount of articles that needed to be tagged, since our intuition is that the task of tagging is seen by participants as a chore, and we feared that if they exited the test halfway through, we would loose valuable data. The users are informed of how many articles they have tagged.
Minor problems
A. There was a coding error which once in a while showed the same article twice. Some participants would skip the article, some would annotate it again, and some would write in the data collection box, that they had seen this article before. These entries have been removed. B. Since there was no finish button on the questionnaire, some participants annotated more than eight articles.
2.5 Analysis of collected tags
The keywords belonging to each article are collected and gone over manually to make sure that strange html entities or other oddities inside or surrounding the keywords are caught and normalised. This is to avoid complications further down the preprocessing pipeline.
Removing Noise from the Data
All keywords for each article are collected and made lower case, after which they are compared and ranked according to frequency. The frequency count from each keyword is divided into 1st,
2nd and 3rd median. Keywords not belonging to the 3rd median for each article are discarded, i.e.
we only consider keywords with high frequency and a strong presence. This is done to avoid outliers in the data. The reason for making all keywords lowercase is to ensure that participants may have spelled keywords with title-, upper- or lowercase.
Named Entities
Named Entities (Persons, Organisations, Locations) are extracted from all of the articles we train on. We intended to do this in one swoop to avoid repetition by using the NLTK ne_chunk method4. By
closer inspection we notice that the NLTK ne_chunk method doesn't collect all NE's, which could possibly be due to the anglocentric nature of NLTK and our text corpus is in Danish. We found a POS-tagging web service from “Center For Sprogteknologi”5, however it would be cumbersome
and error prone to copy-paste data back and forth between the web form and text sheets. Likewise, training a POS-tagger from scratch, to identify names entities etc., is out of the scope of this paper, so we write our own function to collect the rest of the NE's.
4 http://www.nltk.org/api/nltk.chunk.html 5 http://cst.dk/online/pos_tagger/
The function collects n grams (from 1 – 5 tokens) that are either Titlecase or UPPERCASE. Naturally we rake in many false positives. The tokens are gone over manually and false positives are removed from the list. NE's from the NLTK ne_chunk function and our function are joined and edited again.
2.6 Identifying News Triangles.
To map where keywords are found across the articles, we partition the articles into: header and sub-headline; intro; and subsequent section blocks including the section block sub-headline. The intro and section blocks are divided into 20 buckets, based on the fact that most section blocks consist of roughly 20 sentences.
We write a Python program to go through each sentence in each section block of the article, and if a single or multiple token keywords in the 3rd quartile is found, the program marks the
keywords position. The resulting data-set is sent of programmatically to plot.ly, where we manually add the linear fit to each block. The values of the Squared Correlation Coefficients (R2),
Mean Squared Error (MSE), and a boolean value of whether there is a News Triangle present, is read and entered into Table 10 on page 36.
For identifying News Triangles in the intro and each section block, the linear fit is calculated for each section block. For calculating the linear fit across the entire article, the header and sub-headline are included, but since this part of the article is so compact, we do not calculate a linear fit across it.
Note that we use the linear fit as a boolean value to identify whether there is a News Triangle or not. We considered using alternative methods for measuring the presence of News Triangles, but decided a linear fit is the best method to see if there is an ascent or descent across the sections. We do find that this set-up has certain drawbacks, since the linear fir does not show where the keywords start or stop across the 20 partitions, which could be valuable information. For section blocks where the linear fit is almost horisontal, this is problematic. However, we choose to partition the section blocks into 20 partitions and this allows for visual feedback, so the reader can see what the distribution looks like. A later step could be investigating the slopes of the fit across the data or where the ascents or descent start and stop. We choose to concentrate on a preprocessing step of identifying if there even are News Triangles or Stacked News Triangles.
3 Results
Since we will show many tables and illustrations, we also choose to analyse part of the data in the results section. For brevity, we have moved the majority of the illustrations for Keyword Popularity Distribution to the B Appendix on page 53.
3.1 Participants
All participant are from Denmark. Table 1, 2 and 3 show the participant ages, graduation year and education length. The participant's ages range from 30 to 59, the year of graduation ranges from 1980 to 2011, and the education length ranges from 2 to 6 years, with the majority of education length being four years.
Participant's Ages
Min Max Count Mean 1st Median Median 3rd Median
30 59 67* 43.66 40 42 46
Table 1: Participant's ages. The oldest participant is 59, and the youngest is 30 years old. The majority of participants are close to 40. * Note that one participant did not specify his or her age.
Participant's Graduation Year
Min Max Count Mean 1st Median Median 3rd Median
1980 2011 68 2000 2001 2001 2002
Table 2: Participant's Graduation year. The majority of participants graduated in 2001.
Participant's Education Length within Journalism and Communication
Min Max Count Mean 1st Median Median 3rd Median
2 6 68 4.088 4 4 4
Table 3: Participant's education length. All participants have an education related to the fields of either journalism or communication, of which the majority have studied for 4 years.
Participant's Keyword Experience
The participants where asked to select for how long they had worked with annotating articles and when they had last worked with this. In all, roughly half (54,5%) had experience with adding keywords to journalistic articles, 42,6% have no experience and 2,9% answered “N/A”.
Question: "For how many years have you worked with annotating news articles?" Answer "I have
never worked with it”
"1 - 3 years" "4 - 6 years" "7 - 9 years" “More than 10 years”
“N/A”
Count 29 17 11 5 4 2
Table 4: More than half of the participant have experience with adding keywords to articles.
For when they last worked with annotating articles, 29 participants (42.64%) are currently working with it or have worked with it within the past 3 years. 3 participants (4.41%) have not worked with it since seven years ago. 26 participants (38.23%) have never worked with it and 6 participants (8.82%) chose “N/A”.
Question: "When did you last work with annotating news articles?" Answer "I have
never worked with it” "I work with it daily" “1 – 3 years ago” "4 - 6 years ago" "7 - 9 years ago" “More than 10 years ago” “N/A” Count 26 15 14 4 1 2 6
Table 5: Close to half have current or recent keyword experience.
Participant's Job Functions and Job Titles
The 68 participants label themselves with 33 different job titles and 52 different job functions, ranging from journalist to CEO. Job titles and job functions are shown in Table 14 on page 71.
Participant's Device and OS
One concern was that participants would take the test on their phones, which we feel hinders the annotation of articles. Each participant's browser type and device type is collected during the test. The split is as follows: Desktop/Laptop: 60 (88.2%); Tablet: 4 (5.9%); Mobile Phone: 4 (5.9%). From Table 6 we find a wide range of browsers used by the participants across both operating systems.
Participants Browsers and Operating Systems Operating
System
IE Safari Chrome Firefox Others Total
Windows 4.4% - 30.9% 2.9% - 38,2%
Apple - 29.4% 5.9% 14.7% - 50%
IOS - 5.9% - - - 5.9%
Other - - - - 5.9% 5.9%
Table 6: Participant's Browser and Operating System. Windows, Chrome: 21 (30.9%); Apple, Safari: 20 (29.4%); Apple, Firefox: 10 (14.7%); IOS iPad, Safari: 4 (5.9%); Apple, Chrome: 4 (5.9%); Windows, IE': 3 (4.4%); Windows, Firefox' 2 (2.9%); Various others: 4 (4.5%)
3.2 Articles and Annotations
This first part of the results serves the purpose of getting an overview of the data and to make sure that everything is aligned, to better make comparisons when we explore the data further. Even though the content of the articles vary and as such could produce a wide spectrum of annotations, both in type and count, we choose to use averages to compare article categories. We also look at the respective group's median when possible. The reason for analysing the participant's annotations is to understand what defines a “good” keyword. Later we will analyse where the most popular annotations among participants are placed throughout the article text.
Article Groups
We group the articles into categories to understand differences among categories and annotations. This is also a sanity check to see if there are any outliers in our data that might become a problem later. Table 13 on page 70 (in Appendix C) lists the articles with their categories, article ID, a rough translation of the headline from Danish to English, and the original URL, which is the namespace that comes after “http://politiken.dk”.
We group the articles based on their content and the first taxon in the URL. Articles could be grouped further by URL, however we would be left with such small categories that comparison would be difficult to calculate. The placement of articles in the sports section is clearcut, while the articles in Culture, Domestics, and Economy could be placed differently due to certain subjects overlapping, i.e. an article about economy is likely to be concerned with Danish politics, and an article about education is placed in domestic news, although that area, to some extent, is governed by politicians. We chose to group articles about life style and consumerism in the Culture category. Table 13 on page 70 shows that seven articles belonging to Culture, 14 belonging to Domestic News, six articles belong to the Economy category and four articles
belong to the Sports category.
From Table 7 below we see how the Domestic and Sports categories feature articles which have been annotated more than double the times than the 2nd median and average for that particular
group (Domestic max = 39 , Sports max = 37). However, looking at the 1st, 2nd and 3rd medians for
all categories, we can see that the majority of articles have been annotated by 13 – 16 participants for each group respectively. This indicates easier comparison across article groups.
Averages and Five Number Summary of Article Categories Annotation Rate
Categories Average Min Max Median 3rd median 1st Median
Culture 15.57 13 19 16 16 16
Domestic 18.71 12 39 15.5 16 15
Economy 14.83 13 18 14.5 15 14
Sports 18.75 12 37 13 13 13
Table 7: Domestic and sport receive higher Max annotation by the 68 participants, however the 1st, 2nd and
3rd medians for all categories group closely showing that the annotation rate for each article lies between 13
– 16 annotations from participants. Notice also how close the keyword count for 1st,,2nd and 3rd medians for
each category are.
Keyword Annotations
Table 8 and Table 9 show: annotation types; the count of all annotations for that annotation type; the average annotations per article; the count of unique annotations; and averages of unique keywords per article.
The process of finding unique annotations is as follows: all annotations are made lower case and duplicates are removed, so we have a set of non matching annotations. Having said that, it is possible that annotations with the same semantic meaning can exist alongside each other, or, since annotations are not stemmed, that annotations exist in different lemmas. Table 8 shows that the 31 articles have collected 4930 keywords, of which 1467 are unique. Per article, on average, there are 159.03 tokens of which 47.32 are unique.
Annotations Overall All Annotations Avg. Annotations per article collectively Unique Annotations Avg. Unique Annotations per article collectively All Keywords 4930 159.03 1467 47.32
Keywords per Category
For Table 9, averages are the sum of all annotations divided by the number of articles in that category, i.e. “Culture Keywords” = 993 / 7 (articles) = 141.86. The averages for each section that are above average have been bolded. Illustration 5 on page 28 summarises Table 9.
I n Table 9 we find that while articles in each category receive from 691 – 2510, the Average Unique Annotations per Article collectively groups around 44 – 52.14. Unique Annotation for each Category varies from 176 – 703, the Average Annotations per Article Collectively lie close(44 – 52.14 average unique annotations per article collectively) with a Standard Deviation of 4.04. There is a wide spectrum of overall and unique keywords per category and each category settles closely to each other.
Keyword Annotations per Category: Culture 7, Domestic 14, Economy 6, Sports 4
Category and Annotation Type All Annotations for each category Avg. Annotations per article collectively Unique Annotations for each category Avg. Unique Annotations per article collectively Culture Keywords 993 141.86 365 52.14 Domestic Keywords 2510 179.29 703 50.21 Economy Keywords 755 125.83 268 44.67 Sports Keywords 691 172.75 176 44
Table 9: Keyword annotations per Category of articles. For Average Annotations per article collectively: Min 125.83, Max 179.29, Mean 54.93, Q1 133.85, Median 157.30, Q3 176.02, Std Dev 25.35. For Average Unique Annotations per article collectively: Min 44, Max 52.14, Mean 47.75, Q1 44.34, Median 47.44, Q3 51.18 Std Dev 4.04
Also evident from Table 9 is that although articles receive a different amount of attention from participants the averages group around each other. Illustration 5 shows that culling the lists of keywords to only contain unique annotations, the count drops quickly and all categories group fairly even around the same range.
To understand the variation within each group, we can in Table 15 (on page 71, Detailed look at count of Annotations of Keywords ), see in detail the number of annotations added to each article, along with the count of unique annotations. We calculate a one-way ANOVA test, for the null hypothesis (H0) of no connection between the number of annotations added and the number of unique annotations. We find that there is no significance between the number of annotations added and the amount of unique annotations, except for the Sports category, where there is a significance above 0.05 (P<0.07117) for keywords added vs. unique keywords. However the score for the sports category is based on four articles.
3.3 Keyword Distribution
For brevity, the majority of illustrations of Keyword Popularity Distribution have been move to Appendix B on page 53. The article ID's, illustration number and page number are show in the footer for each results category.
As described in the methodology, the keywords in the 3rd quartile for each article, are searched
for and mapped along a line representing the entire article. Each article is divided into sections and each section (except the header and sub-headline) consist of 20 partitions. Each partition can feature from zero to many keywords. To identify the presence of overall News Triangles and Stacked News Triangles, the mapping results are sent of to Plot.ly, where a linear fit is added and used as a boolean value. A descent from left to right indicates that there is a News Triangle,
while an ascent from left to right, indicates that there is no News Triangle.
Keyword Distribution – Culture
Article 18, 23 and 28 have an overall News Triangle and a News Triangle for each block. Article 16 and 22 have an overall News Triangle, but not a News Triangle for the only block (the Intro). For article 16, the linear fit over All - Popularity and Intro Popularity Count follow each other closely. The Header popularity in article 16 is lower than some of the spikes in the Intro.
Article 17 has an overall News Triangle and a News Triangle for the Intro and Section 2 blocks. Section 1 does not have a News Triangle. Section 2 has less popular keywords than Section 1 and especially the Intro block. The Header popularity is lower than some of the spikes in the Intro. Article 27 (Illustration 6 below) has an overall News Triangle and a News Triangle for Section 1,3 and 4. The Intro and Section 2 have no News Triangles. Article 27 is very jagged, both for spikes in popularity and for how the Keyword Popularity Distribution ascends and descends in the Intro, and Section 1 and 2.
A list of illustration references for Culture can be found in the footnotes6.
6 Culture Articles pp. 53:
Article 16: Illustration 18 - pp. 53, Article 17: Illustration 19 - pp. 53, Article 18: Illustration 20 - pp. 54, Article 22: Illustration 21 - pp. 54, Article 23: Illustration 23 - pp. 55, Article 27: Illustration 25 - pp. 56, Article 28: Illustration 22 - pp. 55
Keyword Distribution – Domestic News
Article 03, 04, 05, 08, 13, 19 and 26 all have an overall News Triangle and a News Triangle for each block. For article 05, 08, 19 and 26, the linear fit over All - Popularity and the Intro Popularity Count fit follow each other closely.
In article 04 the Intro, Section 2 and 3 have an almost horizontal linear fit, indicating that the distribution of popular keywords in those blocks is fairly even. Note how in article 08 (Illustration 7 below on page 31) the article starts with more popular keywords, than there are in the header, which by convention is supposed to be the most condensed part. This is also apparent in article 20 (Illustration 32 page 60).
In Article 13 the keyword distribution for all blocks is dispersed and the header block is the most keyword popularity condensed area.
Article 07 has an overall News Triangle and a News Triangle for Sections 1 and 2, but not for the Intro block, where the majority of the popular keywords are in the rear partitions, in contrast to Section 1 and 2, where the popular keywords are at the beginning.
Article 20 has an overall News Triangle and a News Triangle for each block, except for the last section (Section 2), where the popularity ascends. The popularity of keywords in the Intro and Section 1 ascends. Note how the Header popularity is lower than many of the popular partitions in the blocks.
Article 21 has an overall News Triangle and a News Triangle for the Intro and Section 3. Sections 1, 2, 4 and 5 ascend and have no News Triangle. Section 2, 3 and 4 have an almost horizontal linear fit.
Article 24 has an overall News Triangle and a News Triangle for Section 1,2 and 3. The keyword popularity in Intro and Section 4 ascends and the article has few popular keywords.
Article 25 has an overall News Triangle and a News Triangle for Section 1 and 3. The Intro and Section 2 ascend and have no News Triangles.