Link¨oping studies in science and technology
Dissertations No 1168
Nonlinear Phonocardiographic
Signal Processing
Christer Ahlstr¨
om
Department of Biomedical Engineering
Link¨oping University, SE-581 85 Link¨oping, Sweden
http://www.imt.liu.se
In cooperation with Biomedical Engineering,
¨
Orebro County Council, Sweden
Link¨oping, April 2008
During the course of the research underlying this thesis, Christer Ahlstr¨om was enrolled in Forum Scientium, a multidisciplinary doctoral programme at Link¨oping University, Sweden.
c
2008 Christer Ahlstr¨om, unless otherwise noted. Department of Biomedical Engineering
Link¨opings universitet SE-581 85 Link¨oping
Sweden
ISBN 978-91-7393-947-8 ISSN 0345-7524
Abstract
The aim of this thesis work has been to develop signal analysis methods for a com-puterized cardiac auscultation system, the intelligent stethoscope. In particular, the work focuses on classification and interpretation of features derived from the phonocardiographic (PCG) signal by using advanced signal processing techniques. The PCG signal is traditionally analyzed and characterized by morphological prop-erties in the time domain, by spectral propprop-erties in the frequency domain or by nonstationary properties in a joint time-frequency domain. The main contribution of this thesis has been to introduce nonlinear analysis techniques based on dynamical systems theory to extract more information from the PCG signal. Especially, Tak-ens’ delay embedding theorem has been used to reconstruct the underlying system’s state space based on the measured PCG signal. This processing step provides a geo-metrical interpretation of the dynamics of the signal, whose structure can be utilized for both system characterization and classification as well as for signal processing tasks such as detection and prediction. In this thesis, the PCG signal’s structure in state space has been exploited in several applications. Change detection based on recurrence time statistics was used in combination with nonlinear prediction to remove obscuring heart sounds from lung sound recordings in healthy test subjects. Sample entropy and mutual information were used to assess the severity of aortic stenosis (AS) as well as mitral insufficiency (MI) in dogs. A large number of, partly nonlinear, features was extracted and used for distinguishing innocent murmurs from murmurs caused by AS or MI in patients with probable valve disease. Finally, novel work related to very accurate localization of the first heart sound by means of ECG-gated ensemble averaging was conducted. In general, the presented nonlinear processing techniques have shown considerably improved results in comparison with other PCG based techniques.
In modern health care, auscultation has found its main role in primary or in home health care, when deciding if special care and more extensive examinations are required. Making a decision based on auscultation is however difficult, why a simple tool able to screen and assess murmurs would be both time- and cost-saving while relieving many patients from needless anxiety. In the emerging field of telemedicine and home care, an intelligent stethoscope with decision support abilities would be of great value.
Popul¨
arvetenskaplig sammanfattning
Att bed¨oma h¨alsotillst˚andet hos en patient genom att lyssna p˚a ljud fr˚an kroppen ¨ar en av de ¨aldsta diagnostiska metoderna. Tekniken kallas auskultation och beskrevs av den grekiske l¨akaren Hippokrates redan 400 ˚ar f. Kr. Metoden har sedan dess f¨orfinats, men de bakomliggande principerna ¨ar fortfarande desamma.
Under senare tid har bildgivande metoder som ultraljud och magnetresonanstomo-grafi blivit allt vanligare. Dessa ger mer tillf¨orlitliga resultat ¨an auskultation, men de kr¨aver ocks˚a dyr utrustning och kvalificerade operat¨orer. B˚ade av kostnadssk¨al och av praktiska sk¨al beh¨ovs det d¨arf¨or en prelimin¨ar unders¨okningsmetod som kan hitta de personer som beh¨over unders¨okas vidare p˚a en specialistklinik. Som ett viktigt verktyg i denna f¨orsta sovring har auskultationen hittat sin roll i dagens v˚ardkedja. Problemet med auskultation ¨ar att det kan vara sv˚art att s¨arskilja ljud som uppkommer av patologiska orsaker fr˚an normala eller oskyldiga ljud. Denna problematik behandlas i detta avhandlingsarbete. Mer specifikt har avancerad sig-nalanalys utvecklats f¨or att tolka hj¨artats ljud p˚a ett objektivt s¨att.
Hj¨artats ljud kan i huvudsak delas in i hj¨arttoner och bl˚asljud. Hj¨arttonerna h¨ors i samband med klaffst¨angning medan bl˚asljud uppkommer genom virvelbildningar d˚a blodet passerar genom hj¨artat. Tonerna ¨ar korta och av l˚ag frekvens medan bl˚asljuden ¨ar mer l˚angdragna och av lite h¨ogre frekvens. De patologier som vanligen kopplas till bl˚asljud ¨ar vitier (l¨ackande eller f¨ort¨atnade klaffar) och duktusprob-lematik (h˚al i v¨aggen mellan hj¨artats h¨ogra och v¨anstra sida). Bl˚asljuden kan ocks˚a vara helt normala och det ¨ar en av orsakerna till att auskultation ¨ar sv˚art. St¨orre delen av denna avhandling beskriver signalbehandlingsmetoder som kan anv¨andas dels f¨or att s¨arskilja normala bl˚asljud fr˚an patologiska bl˚asljud och dels f¨or att best¨amma graden av l¨ackaget eller f¨ortr¨angningen. Tidigare har detta gjorts utifr˚an signalens utseende (morfologi) i tidsdom¨anen, dess karakt¨aristik i frekvensdom¨anen eller utifr˚an en kombination av dessa. Inom ramen f¨or avhandlingen har f¨orb¨attrad metodik utvecklats vilken utnyttjar ljudens olinj¨ara egenskaper. Speciellt har inspi-ration h¨amtats fr˚an kaosteori och olinj¨ara dynamiska system. Arbetet har fokuserat p˚a att s¨arskilja normala bl˚asljud fr˚an bl˚asljud orsakade av f¨ortr¨angning i aortak-laffen eller l¨ackage i mitraliskaortak-laffen (de tv˚a vanligast f¨orekommande vitierna) samt p˚a gradering av de tv˚a sistn¨amnda. Graderingen av mitralisl¨ackage ¨ar extra intres-sant eftersom signalbehandling av bl˚asljud aldrig tidigare anv¨ants f¨or denna typ av bed¨omning.
Avhandlingen beskriver ¨aven tv˚a angr¨ansande problemst¨allningar d¨ar signalbehan-dling appliceras p˚a hj¨artljud. Den f¨orsta handlar om hur ljud fr˚an lungorna kan g¨oras mer l¨attolkade genom att ta bort de, i det h¨ar fallet, st¨orande hj¨arttonerna. Eftersom hj¨arttonerna tagits bort m˚aste tomrummet fyllas med lungljud. Detta har
handlar om att hitta hj¨artats f¨orstatons precisa l¨age i tiden med hj¨alp av wavelets och matchade filter. Anledningen till att man vill detektera f¨orstatonen s˚a noggrant ¨ar att man d˚a kan m¨ata tidsintervallet mellan hj¨artats elektriska och mekaniska ak-tivering. Detta tidsintervall p˚averkas av olika fysiologiska parameterar och m¨ojligg¨or bland annat att andning och blodtrycksf¨or¨andringar kan monitoreras kontinuerligt, icke-invasivt och utan st¨orande sensorer i ansiktet.
I takt med en allt mer ˚aldrande befolkning, en befolkning som st¨aller h¨ogre krav p˚a sjukv˚arden och som vill ta mer ansvar f¨or sin egen h¨alsa kommer den moderna sjukv˚arden att f¨or¨andras. D¨arf¨or efterstr¨avas metoder som till˚ater att patienter i h¨ogre utstr¨ackning kan diagnostiseras och v˚ardas i hemmet. Resultatet av detta avhandlingsarbete inneb¨ar ett viktigt steg mot ett datorbaserat intelligent stetoskop utrustat med beslutst¨od. Med ett s˚adant instrument skulle auskultationstekniken bli ett ¨annu kraftfullare verktyg i hj¨artsjukv˚arden.
List of Publications
This thesis is based on the following papers, which will be referred to in the text by their roman numerals. The papers are numerated in order of appearance in the thesis.
I. Ahlstrom C, L¨anne T, Ask P, Johansson A: A method for accurate localization of the first heart sound and possible applications. Physiological Measurement. 2008. 29:417-428.
II. Ahlstrom C, H¨oglund K, Hult P, H¨aggstr¨om J, Kvart C, Ask P: Assessing Aor-tic Stenosis using Sample Entropy of the Phonocardiographic Signal in Dogs. Accepted for publication in IEEE Transactions of Biomedical Engineering. III. Ljungvall I, Ahlstrom C, H¨oglund K, Hult P, Kvart C, Borgarelli M, Ask
P, H¨aggstr¨om J: Assessing mitral regurgitation attributable to myxomatous mitral valve disease in dogs using signal analysis of heart sounds and murmurs. Submitted to a veterinary journal.
IV. Ahlstrom C, Hult P, Rask P, Karlsson J-E, Nylander E, Dahlstr¨om U, Ask P: Feature Extraction for Systolic Heart Murmur Classification. Annals of Biomedical Engineering. 2006. 34(11):1666-1677.
V. Ahlstrom C, Liljefelt O, Hult P, Ask P: Heart Sound Cancellation from Lung Sound Recordings using Recurrence Time Statistics and Nonlinear Prediction. IEEE Signal Processing Letters. 2005. 12:812-815.
Related publications by the author which have contributed to this thesis. These papers will be referred to in the text by their reference listing in accordance with the bibliography:
• Ahlstrom C, Ask P, Rask P, Karlsson J-E, Nylander E, Dahlstr¨om U, Hult P: Assessment of Suspected Aortic Stenosis by Auto Mutual Information Analy-sis of Murmurs, 29th Annual International Conference of the Engineering in Medicine and Biology Society (EMBC 2007), Lyon, France, 2007. [1]
• H¨oglund K, Ahlstrom C, H¨aggstr¨om J, Ask P, Hult P, Kvart C: Time-frequency and complexity analysis: a new method for differentiation of innocent murmurs from heart murmurs caused by aortic stenosis in boxer dogs. American Journal of Veterinary Research. 2007. 68:962-969. [2]
• Ahlstrom C, Johansson A, Hult P, Ask P: Chaotic Dynamics of Respiratory Sounds. Chaos, Solitons and Fractals. 2006. 29:1054-1062. [3]
• Ahlstrom C, H¨oglund K, Hult P, H¨aggstr¨om J, Kvart C, Ask P: Distinguishing Innocent Murmurs from Murmurs caused by Aortic Stenosis by Recurrence Quantification Analysis. 3rd International Conference on Biosignal Processing (ICBP 2006), Vienna, Austria, 2006. [4]
Processing (ICASSP 2006), Toulouse, France, 2006. [5]
• Johansson A, Ahlstrom C, L¨anne T, Ask P: Pulse wave transit time for moni-toring respiration rate. Medical & Biological Engineering & Computing. 2006. 44:471-478. [6]
• Ahlstrom C, Johansson A, L¨anne T, Ask P: Non-invasive Investigation of Blood Pressure Changes using Pulse Wave Transit Time: a novel approach in the monitoring of dialysis patients. Journal of Artificial Organs. 2005. 8:192-197. [7]
• Ahlstrom C, Hult P, Ask P: Wheeze analysis and detection with non-linear phase space embedding. 13th Nordic Baltic Conference, Biomedical Engineer-ing and Medical Physics (NBC05), Ume˚a, Sweden, 2005. [8]
• Ahlstrom C, Johansson A, L¨anne T, Ask P: A respiration monitor based on electrocardiographic and photoplethysmographic sensor fusion. 26th Annual International Conference of the Engineering in Medicine and Biology Society (EMBC 2004), San Francisco, US, 2004. [9]
Acknowledgements
To my lovely sunshine Anneli. You are all I want and everything I need. Thank you for keeping me happy.
This work would not have been possible without my supervisors; Per Ask, for hav-ing faith in my ideas and for allowhav-ing me to go where it was sometimes hard to follow, Peter Hult for introducing me to the intelligent stethoscope and the world of bioacoustics, and Anders Johansson for counseling me in the best possible way even after he left the department.
To all of my coauthors: I would have been lost without your knowledge in this inter-disciplinary research field. Special thanks to Katja H¨oglund and Ingrid Ljungvall for giving me the opportunity to experience a double cultural clash. I am also grateful to Olle Liljefelt for stimulating discussions on nonlinear gap-filling.
Several comments and suggestions have improved the content of this thesis. Many thanks to Katja H¨oglund, Jens H¨aggstr¨om, Eva Nylander, Linda Rattf¨alt, Lars-G¨oran Lindberg, Jan-Erik Karlsson, Peter Rask, Ulf Dahlstr¨om, Clarence Kvart and Toste L¨anne for lending me their expertise.
I am very grateful to the kind and forthcoming personnel at the Dept. of Internal Medicine (Ryhov County Hospital), at the Dept. of Clinical Physiology ( ¨Orebro University Hospital) and at the Dept. of Clinical Physiology, Link¨oping University Hospital, for all help and persistent support regarding data acquisition. I am also very grateful to the Uppsala research group at the Swedish University of Agricultural Sciences for letting me use their database of PCG signals from dogs.
Finally, I am very fortunate to have the best of friends. Linda for sharing her boggling and sometimes windswept thoughts, Jonas for reminding me of who I once was, Markus for always caring a little too much, and Emma, Maja and Michael for adopting me into their posse. I would also like to thank Marcus and Erik for excellent cycling company and for depriving me from the experience of being one of the old guys at the department. I also owe a great deal to Amir, my office mate whom I trust with my life – whatever the future holds for you and wherever you end up I wish you all the best. Finally, my sincerest gratitude goes to my family for all their support over the years.
This work was supported by grants from the Swedish Agency for Innovation Systems, the Health Research Council in the South-East of Sweden, the Swedish Research Council, the Swedish Heart-Lung Foundation and the NIMED Center of Excellence.
Aims
Phonocardiography and auscultation are noninvasive, low-cost and accurate meth-ods for assessing heart disease. However, heart diagnosis by auscultation is highly dependent on experience and there is a considerable inter-observer variation. The primary aim of this work is therefore to develop objective signal processing tools to emphasize and extract information from the phonocardiographic signal. More specifically, the aims of this thesis are to:
• Investigate and develop linear and nonlinear signal processing tools suitable for phonocardiographic applications.
• Classify and assess heart murmurs and relate the obtained information to different heart valve pathologies.
Table of Contents
Abstract i List of Publications v Acknowledgements vii Aims ix Abbreviations xv 1 Introduction 11.1 Preliminaries on cardiac sounds . . . 1
1.2 Preliminaries on PCG signal processing . . . 3
1.3 Data sets . . . 6
1.4 Outline of the thesis . . . 11
1.5 Contributions . . . 12
2 Origin of Heart Sounds and Murmurs 15 2.1 Cardiovascular anatomy and physiology . . . 16
2.1.1 The heart valves . . . 17
2.1.2 The cardiac electrical system . . . 18
2.1.3 The cardiac cycle and the pressure-volume loop . . . 19
2.1.4 Coupling in the cardiovascular system . . . 21
2.1.5 Fractal physiology . . . 23
2.2 Valvular heart diseases . . . 23
2.3 Auscultation and phonocardiography . . . 25
2.3.1 Terminology for describing cardiac sounds . . . 27
2.3.2 Phonocardiography (PCG) . . . 27
2.4 Acquisition of PCG signals . . . 28
2.5 Flow-induced sound and vibrations . . . 29
2.5.1 Heart sounds . . . 30
2.6.1 Modeling the first heart sound . . . 37
2.6.2 Modeling the second heart sound . . . 38
2.6.3 Animal models and veterinary applications . . . 39
3 Signal Processing Framework 43 3.1 Linear correlations and the power spectrum . . . 46
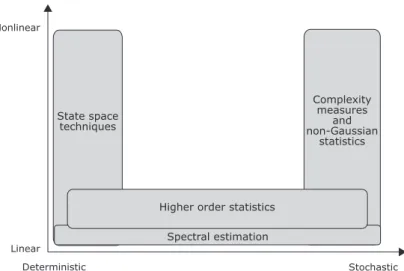
3.2 Higher order statistics . . . 48
3.3 Waveform complexity analysis . . . 50
3.3.1 Waveform fractal dimension . . . 50
3.3.2 Spectral slope . . . 52
3.3.3 Entropy . . . 52
3.4 Reconstructed state space analysis . . . 53
3.4.1 Characterizing reconstructed state spaces . . . 60
3.4.2 Dimension analysis . . . 61
3.4.3 Lyapunov exponents . . . 65
3.4.4 Entropy . . . 65
3.5 Neural networks . . . 68
3.6 Analysis of nonstationary signals . . . 70
3.6.1 Joint time-frequency representations . . . 71
3.6.2 Nonlinear and nonstationary signal analysis . . . 75
3.7 Noise reduction . . . 78
3.7.1 Ensemble averaging . . . 79
3.7.2 Wavelet denoising . . . 80
3.7.3 State space based denoising . . . 82
3.8 Prediction . . . 85
3.9 Classification . . . 87
3.10 Feature selection . . . 89
3.10.1 Feature ranking . . . 89
3.10.2 Feature subset selection . . . 90
3.11 System evaluation . . . 90
3.11.1 Estimating classifier accuracy . . . 91
4 Heart Sound Localization and Segmentation 95 4.1 Properties of heart sounds . . . 96
4.2 Indirect heart sound localization and segmentation . . . 97
4.2.1 Accurate localization of S1 . . . 99
4.3 Direct heart sound localization . . . 104
4.3.1 Algorithm components . . . 105
4.3.2 Evaluation data . . . 106
4.3.3 Determination of design parameters . . . 106
4.3.4 Frequencies and wavelets . . . 107
4.3.5 Quadratic measures . . . 111
4.3.6 Complexity based measures . . . 112
4.3.7 Multi-feature heart sound localization . . . 116
4.3.8 Comparison between methods . . . 117
4.4 Heart sound classification . . . 121
4.5 Finding the third heart sound . . . 121
5 Assessing and Classifying Systolic Murmurs 125 5.1 Assessing and classifying systolic ejection murmurs . . . 125
5.1.1 Pre-processing . . . 128
5.1.2 Frequency based features . . . 128
5.1.3 Nonlinear features . . . 132
5.1.4 Classifying AS from physiological murmurs . . . 138
5.1.5 Additional comments . . . 140
5.2 Assessing and classifying regurgitant systolic murmurs . . . 142
5.2.1 Pre-processing . . . 143
5.2.2 Features . . . 144
5.2.3 MI assessment . . . 147
5.2.4 Distinguishing severe MI . . . 148
5.2.5 Additional comments . . . 150
5.3 Classifying murmurs of different origin . . . 150
5.3.1 Features . . . 151
5.3.2 Feature selection . . . 161
5.3.3 Classification . . . 163
6 Heart Sound Cancellation from Lung Sound Recordings 167 6.1 Heart sound localization . . . 168
7.1 Continuous monitoring of blood pressure changes . . . 175
7.1.1 Extraction of transit times . . . 177
7.1.2 Agreement between transit times and blood pressure . . . 178
7.2 Respiration monitoring . . . 180
7.2.1 Agreement between transit times and respiration . . . 181
7.3 Additional comments . . . 182
8 Complementary Remarks and Future Aspects 185 8.1 Areas of application . . . 185 8.2 Limitations . . . 186 8.2.1 Clinical validation . . . 186 8.2.2 Computational complexity . . . 186 8.2.3 Stationarity . . . 187 8.2.4 Chaos or noise? . . . 187 8.3 Future work . . . 188
8.3.1 Creating a murmur map . . . 188
8.3.2 Feature extraction, classification and beyond . . . 189
8.3.3 The forest and the trees . . . 190
8.3.4 Information fusion . . . 191
8.3.5 Model-based signal analysis . . . 191
8.3.6 Obstacles . . . 192
8.4 Starting all over again . . . 194
Abbreviations
AMI Auto mutual information
AR Auto regressive
ARMA Auto regressive moving average
AS Aortic valve stenosis
AV Atrioventricular
CCI Cross correlation index
COPD Chronic obstructive pulmonary disease
D2 Correlation dimension
ECG Electrocardiographic signal EMAT Electromechanical activation time LBNP Lower body negative pressure
MA Moving average
MI Mitral insufficiency (mitral regurgitation)
MRI Magnetic resonance imaging
PCG Phonocardiographic signal
PEP Pre-ejection period
PPG Photoplethysmographic signal
PSD Power spectral density
S1 The first heart sound
S2 The second heart sound
S3 The third heart sound
S4 The fourth heart sound
SBP Systolic blood pressure
SFFS Sequential floating forward selection SVD Singular Value Decomposition T1 Recurrence time of the first kind T2 Recurrence time of the second kind VFD Variance fractal dimension
1
Introduction
“Let your heart guide you. It whispers so listen closely.” Land before time (1988) The stethoscope is a recognized icon for the medical profession, and for a long time, physicians have relied on auscultation for detection and characterization of car-diac disease. New advances in carcar-diac imaging have however changed this picture. Echocardiography and magnetic resonance imaging (MRI) have become so domi-nating in cardiac assessment that the main use of cardiac auscultation is nowadays as a preliminary test in the primary health care. Basically, all patients present-ing anythpresent-ing but normal auscultatory findpresent-ings are sent to a cardiology clinic for further investigations. In a world where modern health care is striving for cost contained point-of-care testing, it is now time to bring cardiac auscultation up to date. Decision support systems based on heart sounds and murmurs would improve the accuracy of auscultation by providing objective additional information, and the overall aim of this thesis is to develop signal processing tools able to extract such information.
This introductory chapter will provide a peak preview of upcoming chapters. Heart sounds and murmurs will be introduced and a number of phonocardiographic (PCG) signal processing examples will be given. Terminology and methodology will be used rather carelessly in this chapter, but every example contains pointers to other chapters where more information is available.
There are six data sets which this thesis relies upon. Some of these data sets are used more than once why they will all be surveyed in this chapter. Also included in this chapter are an outline of the thesis and a listing of the main contributions of this research.
1.1
Preliminaries on cardiac sounds
Aristotle found the heart to be the seat of intelligence, motion and sensation. Other organs surrounding the heart, such as the brain and the lungs, merely existed as cooling devices [10]. Since the fourth century BC, our understanding of the heart has changed its role from an all-embracing organ towards a highly specialized device
Fig. 1.1: Early monaural stethoscopes (top left), Cummann’s and Allison’s stetho-scopes (lower left), a modern binaural stethoscope (middle) and a modern electronic stethoscope, Meditron M30 (right).
whose purpose is to propel blood. Knowledge about auscultation has evolved along-side with discoveries about heart function. Robert Hooke (1635–1703), an English polymath, was the first to realize the diagnostic potential of cardiac auscultation:
I have been able to hear very plainly the beating of a man’s heart . . . Who knows, I say, but that it may be possible to discover the motion of the internal parts of bodies . . . by the sound they make; one may discover the works performed in several offices and shops of a man’s body and thereby discover what instrument is out of order.
When Ren´e Laennec (1781–1826) invented the stethoscope in 1816, cardiac aus-cultation became a fundamental clinical tool and remains so today. A selection of stethoscopes from different eras is presented in figure 1.1.
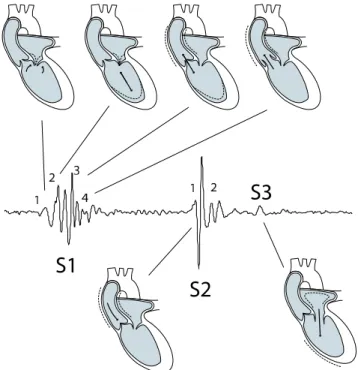
Normally there are two heart sounds, S1 and S2, produced concurrently with the closure of the atrioventricular valves and the semilunar valves, respectively. A third and a fourth heart sound, S3 and S4, might also exist. Additionally, a variety of other sounds such as heart murmurs or adventitious sounds may be present. Heart murmurs can be innocent or pathologic, and they are especially common among children (50-80% of the population has murmurs during childhood, but only about 1% of these murmurs are pathological [11]) and in the elderly (prevalence estimates range from 29%–60% [12,13]). Most common are murmurs originating from the left side of the heart, especially aortic valve stenosis (AS) and mitral insufficiency (MI). A more thorough review of the origin of heart sounds and murmurs can be found in chapter 2.
It is often during auscultation that murmurs are detected. Performing auscultation is however difficult since it is based on the physician’s ability to perceive and interpret a variety of low-intensity and low-frequency sounds, see figure 1.2. Auscultation is also highly subjective and even the nomenclature used to describe the sounds varies amongst clinicians. Unfortunately, the auscultatory skills amongst physicians demonstrate a negative trend. The loss has occurred despite new teaching aids such as multimedia tutorials, and the main reasons are the availability of new diagnostic tools such as echocardiography and MRI, a lack of confidence and increased concern
1.2. PRELIMINARIES ON PCG SIGNAL PROCESSING
about litigations [11]. An automatic decision support system able to screen and assess the PCG signal would thus be both time and cost saving while relieving many patients from needless anxiety.
Fig. 1.2: Relationship between the acoustic range of cardiac sounds and the threshold of audibility of the human ear. Figure redrawn from Leatham [14].
1.2
Preliminaries on PCG signal processing
The PCG signal discloses information about cardiac function through vibrations caused by the working heart. In the early days of PCG signal analysis, manual in-terpretation of waveform patterns was performed in the time domain. Heart sounds were identified as composite oscillations related to valve closure and heart murmurs seemed to derive from malfunctioning valves or from abnormal holes in the sep-tal wall. When the Fourier transform became practically useful, it provided further information about periodicity and the distribution of signal power. In many biomed-ical signals, the Fourier transform showed that sharp frequency peaks were rare, and when they did exist, they often indicated disease [15]. The PCG signal turned out to be different. Murmurs possessed characteristics similar to colored noise, and with increasing disease severity, the frequency spectrum became more and more compli-cated. In an attempt to disentangle the frequency spectrum, joint time-frequency analysis was employed [16]. In later studies, it could be shown that heart sounds consisted of several components where each component had a main frequency that varied with time. This short introduction basically brings us up to date regarding the tools used for PCG signal analysis. In this thesis, nonlinear techniques will be investigated as means to explore the PCG signal even further.
Heart sounds and murmurs are of relatively low intensity and are band-limited to about 10–1000 Hz, see figure 1.2. Meanwhile the human auditory system, which is adapted to speech, is unable to take in much of this information. An automated signal processing system, equipped with a sound sensor, would be able to exploit this additional information. In a clinical setting, the main tasks for such a system would be to:
• Emphasize the audibility of the PCG signal.
• Extract or emphasize weak or abnormal events in the PCG signal.
Emphasize the audibility of the PCG signal
Noise is a big problem in PCG recordings. The sensor, the sensor contact surface, the patient’s position, the auscultation area, the respiration phase and the back-ground noise all influence the quality of the sound. In practice this means that the recordings often contain noise such as friction rubs, rumbling sounds from the stomach, respiratory sounds from the lungs and background noise from the clinical environment. Most of these noise sources have their frequency content in the same range as the signal of interest, why linear filters are not very suitable. In figure 1.3a, a very noisy PCG signal is shown. Wavelet denoising, which will be intro-duced in section 3.7 and used on PCG signals in chapter 4, somewhat emphasizes the heart sounds (figure 1.3b), but the signal is still covered in noise. When trying to emphasize S1 alone, a matched filter can be employed to improve the results, see figure 1.3c. A problem with this approach is that even though S1 occurrences are emphasized, the actual appearance of S1 is lost. Matched filtering relies on finding a representative template of, in this case, S1. Since S1 is basically triggered by the R-peak in an electrocardiogram (ECG), event related processing techniques (section 3.7) can be used to obtain this template. In chapter 4, very accurate localization of S1 is achieved by using this technique.
Fig. 1.3: Example of a very noisy PCG signal (a) and the result of wavelet denoising (b). In (c), occurrences of S1 are emphasized by employing a matched filter.
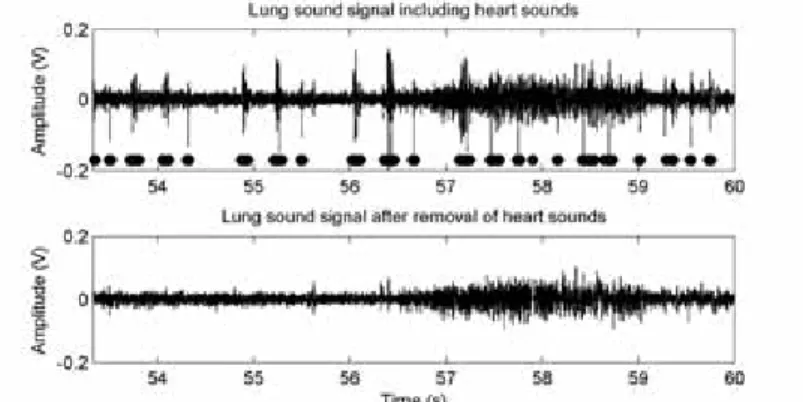
A particular noise cancellation problem is transient noise removal. Potential use in a PCG setting is to remove disturbances such as friction rubs. A related problem, where the heart sounds themselves are considered as noise, is the task of removing heart sounds with the aim to make lung sounds more audible (lung sounds is often the first resource for detection and discrimination of respiratory diseases, see chapter 6). Again, the frequency content of the noise (heart sounds) and the signal (lung sounds) are heavily overlapping. Instead of trying to filter out the heart sounds, it is possible to locate the heart sounds (chapter 4), remove them altogether and fill in the missing gaps based on time series forecasting (section 3.8). An example of a lung sound signal before and after heart sound cancellation (section 6) is given in figure 1.4.
Extract or emphasize weak or abnormal events in the PCG signal A typical example of finding specific components in the PCG signal is the task of automatically locating S3 (section 4.5). Since S3 is of low amplitude, short duration and low frequency, it is sometimes difficult to detect during auscultation. One automatic method to extract S3 is to look for changes in a so called recurrence time
1.2. PRELIMINARIES ON PCG SIGNAL PROCESSING
Fig. 1.4: Example of a lung sound signal before and after heart sound cancellation. The results from a heart sound localization algorithm are indicated by the bars. In this case, the patient has a third heart sound and there are also some false positive detections. In the lower plot, an error caused by the prediction algorithm can be found just before 58 seconds.
statistic (section 3.6.2). This statistic is sensitive to changes in a reconstructed state space (section 3.4), and is particularly good at detecting weak signal transitions such as S3. An example is given in figure 1.5.
Fig. 1.5: Example of a PCG signal from a patient with a third heart sound (a). An image showing a recurrence time statistic as a function of time and a neighborhood radius clearly indicates instances of S3 (arrows in subplot b).
Extract information suitable for assessment and classification of heart diseases
The third item in the list is about finding signal representations that facilitate sep-aration or grouping of data. Figure 1.6 shows a feature space spanned by two parameters, the correlation dimension (section 3.4.1) of a systolic murmur and the duration that the murmur has a frequency content exceeding 200 Hz. Clearly, these two parameters are almost capable of separating PCG signals containing innocent murmurs from murmurs caused by AS. The line trying to separate the groups was derived with a linear classification technique called linear discriminant analysis (sec-tion 3.9). This example shows an applica(sec-tion with emphasis on AS classifica(sec-tion (section 5.1). Also included in this thesis are methods for MI classification (section 5.2) and for classifying murmurs from different valvular diseases (section 5.3).
Fig. 1.6: Example of a feature space spanned by the two parameters correlation dimension and duration above 200 Hz. The circles represent murmurs caused by aortic stenosis while the stars represent innocent murmurs. The line trying to separate the two groups was derived with linear discriminant analysis.
1.3
Data sets
A number of data sets have been used in this thesis. The data sets, summarized in table 1.1, will be referred to by their roman numerals as data set I–VI. Data set I–V are used in paper I–V, whilst data set VI has been used in previous studies in our research group [5, 17].
Since the aims of this thesis are focused on developing PCG signal processing tech-niques, full clinical trials were neither intended nor carried out. Nevertheless, to emulate the clinical situation where the system most likely will be used, the major-ity of the data sets were recorded in a clinical environment.
Data set I
Contains ECG, PCG and photoplethysmography (PPG) signals from ten healthy subjects (8 male, 2 female, mean age 28 years). Two measurements were however aborted because of difficulties for the subjects to adapt to the measurement situation. Data from these two subjects were excluded from the data set. The purpose of recording this data set was to investigate the correlation between certain cardiac time intervals and blood pressure as well as respiration rate, why also blood pressure and respiration were measured. The acquisition protocol consisted of five phases; a five minute resting phase, about five minutes of hypotension, five minutes of rest, about two minutes of hypertension and finally another five minutes of rest. Lower body negative pressure (LBNP) was applied to invoke hypotension [18] and isometric muscle contraction to invoke hypertension [19]. The test subjects were instructed to relax and breathe naturally throughout all measurement phases.
The ECG (Diascope DS 521, S&W Medicoteknik AS, Albertslund, Denmark, stan-dard 3-lead placement), the PCG (Siemens E285E microphone amplifier with a Siemens EMT25C microphone, Solna, Sweden, located at the second intercostal space along the right sternal border), the PPG (Nellcor Puritan Bennett, NPB-295, Albertslud, Denmark) and the respiration reference (Optovent system, Accelerator AB, Linkoping, Sweden) were recorded and digitized with a DAQ-Card 700 from National Instruments (Austin, TX, USA, fs = 2 kHz). Blood pressure was mea-sured with either an automatic oscillometric instrument (Datascope Accutor Plus,
1.3. DATA SETS T a b le 1 .1 : S u m m a ry o f th e d a ta se ts (P C G – p h o n o c a rd io g ra p h y , E C G – e le c tr o c a rd io g ra p h y , P P G – p h o to p le th y sm o g ra p h y ). S et S u b je ct s M ea su re d si gn al s fs S en so r D es cr ip ti on I 10 E C G P C G P P G B lo o d p re ss u re R es p ir at io n 2 k H z E M T 25 C 10 h ea lt h y su b je ct s (8 m al e, 2 fe m al e, m ea n ag e 28 ye ar s) . A b ou t 20 m in u te s of d at a (5 m in u te s re st , ab ou t 5 m in u te s h y p ot en si on , 5 m in u te s re st , ab ou t 2 m in u te s h y p er te n si on an d 5 m in u te s re st ). R ef er en ce m et h o d s: R es p ir at io n m on it or ed w it h O p to ve n t, b lo o d p re ss u re m on it or ed v ia an au to m at ic os ci ll om et ri c in st ru m en t or co n ti n u ou sl y v ia in tr aa rt er ia l ca n n u la . II 27 E C G P C G E ch o ca rd io gr ap h y 44 .1 k H z M ed it ro n 27 b ox er d og s w it h va ri ou s d eg re es of ao rt ic st en os is (1 2 m al e, 15 fe m al e, m ea n ag e 2. 15 ye ar s) . 10 se co n d s of d at a re co rd ed in a q u ie t ro om . R ef er en ce m et h o d : A or ti c fl ow ve lo ci ty v ia ec h o ca rd io gr ap h y. II I 77 E C G P C G E ch o ca rd io gr ap h y 44 .1 k H z M ed it ro n 77 sm al l to m ed iu m -s iz ed d og s w it h va ri ou s d eg re es of m it ra l in -su ffi ci en cy (3 6 m al e, 41 fe m al e, m ea n ag e 9 ye ar s) . 10 se co n d s of d at a re co rd ed in a q u ie t ro om . R ef er en ce m et h o d s: A u sc u lt at io n an d ec h o ca rd io gr ap h y. IV 36 E C G P C G E ch o ca rd io gr ap h y 44 .1 k H z M ed it ro n 36 p at ie n ts w it h p h y si ol og ic al m u rm u rs (n = 7) an d va ri ou s d eg re es of ao rt ic st en os is (n = 23 ) an d m it ra l in su ffi ci en cy (n = 6) (1 9 m al e, 17 fe m al e, m ea n ag e 69 ye ar s, al l w it h n at iv e h ea rt va lv es ). R ef er en ce m et h o d : E ch o ca rd io gr ap h y ev al u at ed b y ex p er t. V 6 E C G P C G 6 k H z E M T 25 C 6 h ea lt h y su b je ct s (6 m al e, m ea n ag e 28 ye ar s) . N ea rl y 2 m in u te s of d at a re co rd ed (3 0 s of ti d al b re at h in g, ab ou t 60 s of b re at h in g w it h co n ti n u ou sl y in cr ea si n g b re at h vo lu m es an d 10 s of b re at h h ol d ). R ef er en ce m et h o d : A u sc u lt at io n b y ex p er t. V I 10 E C G P C G 2. 5 k H z E M T 25 C 10 h ea lt h y ch il d re n (5 m al e, 5 fe m al e, m ea n ag e 10 .5 ye ar s) . 30 se co n d s of d at a re co rd ed in a so u n d p ro of ro om . R ef er en ce m et h o d : P C G ev al u at ed b y ex p er t.
Paramus, NJ, USA, located on the upper left arm, n = 8) or a cannula (Becton Dickinson, Franklin Lakes, NJ, USA) positioned in the left radial artery connected to a blood pressure transducer (Abbott Critical Care Systems, Chicago, IL, USA) and connected to a monitor (Medimatic, Genoa, Italy, n = 2). The measurement setup is illustrated in figure 1.7.
All subjects were normotensive with (mean ± SD) systolic blood pressure 119 ± 8 mmHg and diastolic blood pressure 71 ± 9 mmHg (n = 8). LBNP reduced upper body systolic blood pressure by 24 ± 14 mmHg and the static muscle contraction increased it by 18 ± 12 mmHg.
Limitations: Intra-arterial continuous measurements of blood pressure would have been preferable in all test subjects. It would also have been interesting to measure respiration with other non-intrusive techniques such as transthoracic impedance.
Application of negative pressure Pressure monitor ECG
Phono-cardiograph Pulse oximeter
Oscillometric cuff Intra-arterial cannula Respiration reference Airtight box
Fig. 1.7: Measurement setup for data set I.
Data set II
Contains PCG signals with various degrees of aortic stenosis present. Signals from 27 boxer dogs (15 females, 12 males, mean age 2.15 ± 2.18 years) were recorded with an electronic stethoscope (M30, Meditron AS, Oslo, Norway) and a standard 3-lead ECG (Analyzer ECG, Meditron AS, Oslo, Norway) was recorded in parallel as a time reference. For characterization purposes, all dogs underwent an echocardiographic examination. The peak aortic flow velocity, measured by continuous wave Doppler, was used as a hemodynamic reference to assess AS severity. The murmurs ranged from physiological murmurs to severe aortic stenosis murmurs (flow velocities 1.5 − 5.5 m/s).
The dogs were divided into two groups (A and B), each of which were further divided into two subgroups of increasing stenosis severity. Group A showed no morphologic evidence of AS via 2D echocardiography and consisted of subgroup A1 (Vmax< 1.8
m/s) and A2 (Vmax ≥ 1.8 m/s). Group B showed morphological evidence of AS
on 2D echocardiography and were allocated to subgroup B1 (Vmax≤ 3.2 m/s [mild
AS]) and B2 (Vmax > 3.2 m/s [moderate to severe AS]). The subgroup
classifica-tion was based on categorizaclassifica-tion described in the veterinary medical literature [20]. Echocardiographic and auscultatory information about this data set is presented in
1.3. DATA SETS
Table 1.2: Echocardiographic and auscultatory data for all dogs in data set II. The group denomination was based on peak aortic flow velocity, as outlined in the main text.
Class A1 A2 B1 B2
Number of dogs 8 8 5 6
Degree of heart murmur (0-VI) 0–II 0–II II–IV III–V
Aortic flow velocity, mean ± SD (m/s) 1.65 ± 0.09 2.02 ± 0.19 2.82 ± 0.36 4.68 ± 0.57 Aortic flow velocity, range (m/s) 1.52 − 1.73 1.84 − 2.41 2.40 − 3.20 4.00 − 5.50
2D morphological aortic stenosis No No Yes Yes
table 1.2.
Limitations: The gold standard for diagnosis of subvalvular AS in dogs is necropsy, a procedure that, for obvious reasons, was not possible to perform for research purposes. The best clinical diagnostic method available to date is echocardiography. Nevertheless, there is no single value of velocity, gradient or valve area that is able to assess AS severity alone. Of these measures, aortic flow velocity is the most reproducible and the strongest predictor of clinical outcome [21]. Further, patients with significant AS and left-sided congestive heart failure have a diminished and sometimes undetectable murmur. This important patient group is not represented in this data set.
Data set III
Contains PCG signals with various degrees of mitral insufficiency present. Signals from 77, mostly Cavalier King Charles Spaniels (CKCS), dogs (41 females, 36 males, mean age 8.60±0.34 years) were recorded with an electronic stethoscope (M30, Med-itron AS, Oslo, Norway) and a standard 3-lead ECG (Analyzer ECG, MedMed-itron AS, Oslo, Norway) was recorded in parallel as a time reference. Based on auscultation, the dogs were divided into the following murmur groups: absent (no audible heart murmur), mild (grade 1–2), moderate (grade 3–4) and severe (grade 5–6). The most commonly recruited breeds were CKCS (n=59) and Dachshund (n=5). Thirteen other breeds with one dog each were also represented in the data set.
For characterization purposes, all dogs underwent an echocardiographic examina-tion. Assessment of mitral valve structures was conducted from the right paraster-nal long-axis view and the left apical four-chamber view. The same views were also used for assessing the degree of mitral regurgitation by color Doppler. Further, the left atrial to aortic root ratio (La/Ao-ratio) was quantified from a right 2-D short-axis view and M-mode measurements of the left ventricle were made. The M-mode values were used to derive the fractional shortening (FS) and the percent increase in left ventricular internal dimensions in diastole (LVIDdinc) and in systole (LVIDsinc)
according to Cornell et al. [22]. The dogs were then classified as normal if no signs of anatomical or functional cardiac pathology could be found. Estimation of MI severity (mild, moderate and severe) was based on the obtained echocardiographic information regarding La/Ao-ratio and severity of regurgitation into the left atrium (table 1.3). More information about assessing MI in dogs can be found in H¨aggstr¨om et al. [23].
Table 1.3: Echocardiographic and auscultatory data for all dogs in data set III. The group denomination was based on the echocardiographic results, as outlined in the main text.
Normal Mild MI Moderate MI Severe MI
LA/Ao < 1.5 LA/Ao < 1.5 LA/Ao < 1.8 LA/Ao > 1.8 No regurgitation Mild regurg. Moderate regurg. Severe regurg.
Number of dogs 5 38 17 17 HR (bpm) 103.5–167 97-121.3 93.5-135.5 115-150 LA/Ao 1.09–1.16 1.16–1.26 1.48–1.7 1.97–2.35 LVIDs (mm) 1.75–1.96 1.94–2.35 2.04–2.76 2.05–2.6 LVIDs inc (%) -9.45–6.34 2.02–21.5 3.37–21.8 7.03–29.4 LVIDd (mm) 2.6–2.81 2.91–3.43 3.21–4.21 4.05–4.77 LVIDd inc (%) -11.2– -4.97 -1.89–11.1 7.05–29.4 27.7–55.2 FS (%) 26.8–37.1 27.7–36.7 31.7–42.2 43.1–47.7
Auscultation Absent Absent–Moderate Mild–Severe Moderate–Severe
Limitations: Characterization of regurgitant valve lesions is among the most diffi-cult problems in valvular heart disease. Contributing to the diffidiffi-culty of assessing mitral regurgitation is the lack of a gold standard [24]. For example, an increase in blood pressure causes an increase in the parameters used to assess MR. Here, the main parameter for MI assessment was the La/Ao-ratio which was derived from 2D echocardiography. Complementary parameters based on Doppler measurements such as the jet area, the diameter of vena contracta and the proximal isovelocity sur-face area (PISA) method could have been used to get a more comprehensive picture of the disease state. However, none of the Doppler parameters have been shown to be more accurate in assessing MI compared to the LA/Ao-ratio in dogs [23, 25]. Data set IV
Contains PCG signals with systolic murmurs present. Signals from 36 patients (19 male, 17 female, mean age 69 years) with probable valvular heart disease (as de-tected with auscultation) were included in the study (7 physiological murmurs, 23 aortic stenosis and 6 mitral insufficiency, all with native heart valves). An electronic stethoscope (theStethoscope, Meditron AS, Oslo, Norway) was used to acquire the PCG signals and a standard 3-lead ECG (Analyzer ECG, Meditron AS, Oslo, Nor-way) was recorded in parallel as a time reference. Both signals were digitized at 44.1 kHz with 16-bits per sample using a sound card (Analyzer, Meditron AS). PCG data were recorded successively for 15 seconds from the four traditional areas of auscultation [26]. Based on signal quality, one of the four signals was selected af-ter visual and auditive inspection. The diagnosis and the assessment of valve lesions were based on an echocardiographic examination according to clinical routine and recommended standards [27]. The PCG signals were acquired in association with this examination.
Limitations: The severity of the disease in the AS and MI patients ranged from mild to severe, and further subdivision of these groups would have been interesting. However, the limited amount of patients in this data set prevent such groupings.
1.4. OUTLINE OF THE THESIS
Data set V
Contains PCG signals in the presence of lung sounds. Signals from six healthy male subjects aged 28 ± 4 years were recorded with a contact accelerometer (Siemens EMT25C, Sweden), connected to a microphone amplifier (Siemens, E285E, Sweden). A standard 3-lead ECG was also recorded as a time reference (S&W, Diascope DS 521, Denmark). Both signals were digitized at 6 kHz with 12-bits per sample (National Instruments, DAQCard-700), after passing an anti-aliasing filter with a cut-off frequency of 2 kHz. The recording site was the second intercostal space along the left sternal border, and the sensor was fixed with an adhesive elastic tape. The acquisition protocol consisted of three phases: 30 s of tidal breathing, about 60 s of breathing with continuously increasing breath volumes up to vital capacity, and 10 s of breath hold (respiration rate was not controlled).
Limitations: Air flow measured with a pneumotachograph should have been ac-quired along with the sound signals. Controlled breathing with a predefined air flow target is essential for performance comparisons at different flow rates. Further, only healthy subjects with known cardiac (no additive sounds or murmurs) and respiratory (no crackles or wheezes) states were included in the data set.
Data set VI
Contains PCG signals with a third heart sound present (S3). Signals from ten healthy children (5 male, 5 female, mean age 10.5 years) were recorded with a contact accelerometer (Siemens, EMT 25C, Sweden) connected to a microphone amplifier (Siemens, E285E, Sweden). A standard 3-lead ECG was also recorded as a time reference (S&W, Diascope DS 521, Denmark). Both signals were digitized at 2.5 kHz with 12-bits per sample (National Instruments, DAQCard-700), after passing an anti-aliasing filter with a cut-off frequency of 1.25 kHz. The signals were recorded over the apex in a soundproof room. The sensor was fixed with a belt around the body. 30 seconds of data was acquired during breath hold, and the presence of S3 was determined by visual inspection of the recordings (an S3 occurrence was marked if a signal component with low frequency was present in a time window 120 − 200 ms after S2).
Limitations: Ten healthy children were included in the data set since third heart sounds with high signal quality are common in this group. Patients with heart failure would have been a more appropriate study population. Another limitation is the lack of an objective and quantitative reference method for detection of S3 occurrences.
1.4
Outline of the thesis
The papers which this thesis is based upon is not entirely (chrono)logically ordered. For example, the studies on AS and MI in papers II and III should have preceded paper IV. This transposed time line also resulted in that the auto mutual information (AMI) feature was not part of the AS assessment study and that AMI, sample entropy and the correlation dimension were “left out” from paper IV. Clearly, it would have been very interesting to include all of the features in paper IV, but I
simply did not know of these techniques back then. This is also the reason why the study underlying paper IV precedes both paper II and paper III and why human experiments were conducted before studies on dogs were performed.
In an attempt to get some order in this chaos, the outline of this thesis is ar-ranged somewhat differently. Chapters 1–3 provides introductory information about anatomy, physiology, PCG signals and signal processing theory. The emphasis in chapter 3 is on signal analysis and especially on the task of extracting descriptive features. Related issues such as noise reduction, classification, feature selection and system evaluation are also mentioned. This chapter is written in a general manner free from cardiac sound examples, so if the reader is familiar with the material it is possible to skip it altogether. Chapter 4 describes direct and indirect heart sound localization (paper I) and briefly mentions heart sound segmentation. A rigorous survey of available indirect heart sound localization methods is given and a compara-tive performance evaluation is presented. A section on S3 detection is also included. Segmentation of PCG signals into S1, systole, S2 and diastole is an important pre-processing step in most PCG signal pre-processing applications. Chapter 5 describes murmur classification and assessment, starting with AS (paper II) and MI (paper III), and concluding with classification of MI, AS and physiological murmurs (paper IV). Chapter 6 makes use of methodology introduced in chapter 4 to find and remove heart sounds to make lung sounds more audible (paper V). More specifically, recur-rence time statistics and nonlinear prediction are used for the actual heart sound cancellation process. Chapter 7 also makes use of methodology from chapter 4 to derive cardiac time intervals (paper I). The time intervals reflect certain processes in the cardiovascular system and facilitates indirect tracking of blood pressure changes and monitoring of respiration in a noninvasive, non-obstructive and non-intrusive manner. Chapter 8 contains a discussion about PCG signal processing in general, particularly regarding future aspects.
1.5
Contributions
Waveform fractal dimensions were introduced for heart sound localization by Gnitecki et al. [28] and nonlinear dynamical analysis of sounds from obstructed coronary ar-teries was introduced by Padmanabhan [29]. The main contribution of this thesis has been to introduce nonlinear signal analysis tools based on dynamical systems theory to the field of heart murmur processing. The results have lead to descriptive features that facilitate classification of heart murmurs (papers II–IV).
Analysis of respiratory sounds based on waveform fractal dimensions was first in-troduced by Yap et al. [30]. These ideas were extended within this thesis work to also incorporate nonlinear dynamical systems theory. The basic methodology be-hind these extensions was first reported at an annual meeting with the International Lung Sound Association [31] and later expanded in [3] and [8]. These preliminary works lead to the nonlinear heart sound cancellation approach presented in paper V. It should be noted that contemporary work on nonlinear lung sound analysis was performed by Vena and Conte [32, 33].
1.5. CONTRIBUTIONS
Chapter 4 provides a novel comparison of heart sound localization techniques. There is a large amount of scientific publications presenting methods for heart sound lo-calization. None of these do however compare the method suggested in the paper against previously published methods using the same data sets. This chapter was written in an attempt to shed some light on this field of research.
A recent interest has emerged in portable, noninvasive, obstructive and non-intrusive devices able to monitor various physiological parameters. The underlying reasons are the need to monitor the health status of patients in their homes as well as of soldiers in the field. This has lead to a rebirth of old knowledge by merging it with recent developments in portable computing. One example is the pulse wave velocity, which has been revived as a mean to monitor blood pressure changes and respiration rate. A novel method to accurately estimate the timing of S1, presented in paper I, was developed along this line of thought. By using the occurrence of S1, it would be possible to investigate the subcomponents of the pulse wave transit time (PTT) and by that to improve the correlations between PTT, blood pressure and respiration.
The practical contribution in each paper can be summarized as follows:
• Paper I: Participated in designing the measurement protocol and in acquiring the data. Implemented the analysis software, analyzed the data and had the main responsibility for writing the paper.
• Paper II: Introduced sample entropy in PCG signal processing. Implemented the analysis software, analyzed the data and had the main responsibility for writing the paper.
• Paper III: Implemented the analysis software, analyzed the data and partici-pated in writing the paper. This is the first attempt ever to assess the severity of mitral insufficiency by means of PCG signal processing.
• Paper IV: Participated in planning the study. Acquired most of the data, implemented the analysis software, analyzed the data and had the main re-sponsibility for writing the paper.
• Paper V: Designed the measurement protocol and acquired the data. Came up with the analysis approach, implemented the software, analyzed the data and had the main responsibility for writing the paper. Preliminary work was performed in cooperation with Olle Liljefelt during his MSc thesis work [34]. This thesis is an extension and a continuation of the work previously presented in my licentiate’s thesis [35].
2
Origin of Heart Sounds and Murmurs
“Hey, I don’t have a pulse. Cool. Can we eat a doctor so I can get a stethoscope and hear my heart not beating?” Buffy the Vampire Slayer (1997) Heart sounds and murmurs arise as a consequence of turbulent blood flow and vibrating cardiovascular structures. This chapter reviews the principles of anatomy and physiology that are necessary to understand how the cardiac sounds are related to physiological events. The electrical and mechanical operation of the healthy heart is reviewed in section 2.1 along with the most important interactions within the cardiovascular system. The coupling between the cardiac system, the vascular system and the respiratory system is very interesting since it renders continuous, non-invasive and non-intrusive monitoring of respiration and blood pressure changes possible (these particular applications will later be discussed in chapter 7 as well as in paper I).
The most important parameters governing mechanical activity are blood pressure, tension in the heart or in adjacent vessels, ventricular volume, blood flow velocity and movement as well as deformation of the heart wall [36]. Many of these pa-rameters can only be measured with sophisticated equipment. However, since the mechanical events cause vibrations that are propagated to the chest surface, in-formation about the working status of the heart can be obtained by auscultation (section 2.3). There are basically two types of sounds originating from the heart, heart sounds and murmurs. A preliminary example showing a recorded PCG signal, containing the two normal heart sounds S1 and S2, is illustrated in figure 2.1 along with an ECG. Information about the ECG signal will be given in section 2.1.2 and the flow induced sounds giving rise to the PCG signal will be discussed in section 2.5.
Murmurs can be of both pathological or physiological origin and arise as a conse-quence of increased blood flow velocities in the heart. High flow velocities can be completely normal, especially amongst children, but it may also be due to a patho-logical narrowing in the blood’s pathway. A common cause of such obstructions is valvular heart diseases, why the cause and pathophysiology of the most common valvular dysfunctions will be described in section 2.2. The concept of sounds induced by turbulence is introduced in section 2.5.2, and these ideas provide a foundation
Fig. 2.1: An electrocardiogram (ECG) and a phonocardiographic (PCG) signal from a healthy person without murmurs. The ECG signal, which will be introduced in section 2.1.2, reflects electrical activity in the heart. Details about the PCG signal, here including the first heart sound (S1) and the second heart sound (S2), will be discussed in section 2.5.1.
to the methodology used in papers II–IV. These topics will also be elaborated in chapters 3 and 5.
Auscultation and phonocardiography are introduced in sections 2.3 and 2.4, together with a short survey of recording techniques. Finally, mathematical models for the two heart sounds as well as animal models for AS and MI are presented in section 2.6. The mathematical models are used in paper I as well as in the simulation studies in chapters 4, while the animal models1are used in papers II–III.
2.1
Cardiovascular anatomy and physiology
The cardiovascular system is designed to establish and maintain a mean systemic arterial pressure sufficient to transport nutrients, oxygen and waste products to and from the cells, while preserving regulatory flexibility, minimizing cardiac work and stabilizing body temperature and pH to maintain homeostasis [37]. The main components of the cardiovascular system are the heart, the blood, and the blood vessels.
The primary task of the heart is to serve as a pump propelling blood around the circulatory system. When the heart contracts, blood is forced through the valves. First from the atria to the ventricles and then from the ventricles out through the body, see figure 2.2. There are four heart chambers, the right and left atria and the right and left ventricles. From a simplistic2 point of view, the two atria mainly
act as collecting reservoirs for blood returning to the heart while the two ventricles act as pumps ejecting blood out through the body. The pumping action of the
1Paper III is actually written for a veterinary journal why it is questionable if the animals
should be considered as models.
2The contraction of the heart is actually very intriguing, where the pumping action is a complex
2.1. CARDIOVASCULAR ANATOMY AND PHYSIOLOGY
heart is divided into two phases; systole when the ventricles contract and ejects blood from the heart, and diastole, when the ventricles are relaxed and the heart is filled with blood. Four valves prevent the blood from flowing backwards; the atrioventricular valves (the mitral and tricuspid valve) prevent blood from flowing back from the ventricles to the atria and the semilunar valves (aortic and pulmonary valves) prevent blood from flowing back towards the ventricles once being pumped into the aorta and the pulmonary artery, respectively. Deoxygenated blood from the body enters the right atrium, passes into the right ventricle and is ejected out through the pulmonary artery on its way to the lungs. Oxygenated blood from the lungs re-enter the heart in the left atrium, passes into the left ventricle and is then ejected out through the body.
Fig. 2.2: Anatomy of the heart (left figure) and the blood flow pathways through left and right side of the heart (right figure).
2.1.1
The heart valves
The atria are separated from the ventricles by the fibrous skeleton of the heart [37]. There is one fibrous ring around each of the four valves, but the rings are fused together into a single fibrous framework. The skeleton has several physiological functions; it provides a foundation to which the valves and the great arteries attach, it prevents overstretching of the valves as blood passes through them and it electri-cally isolates the atria from the ventricles3 (see also section 2.1.2). All four heart
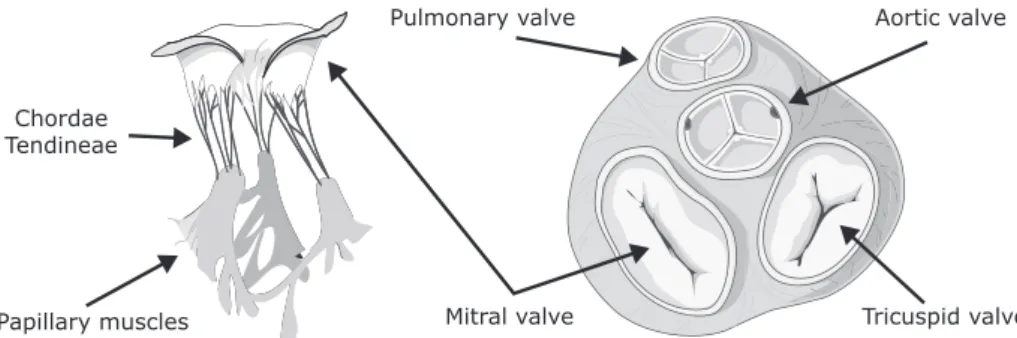
valves have flaps, called leaflets or cusps, which open to let the blood flow through and close to prevent it from flowing backwards. The valves and their leaflets are illustrated in figure 2.3.
The mitral and tricuspid valve leaflets are connected via the chordae tendineae and papillary muscles to the ventricular wall. The papillary muscles contract at the same time as the ventricles contract, thus pulling the chordae tendineae downwards and preventing the valve leaflets from everting into the atria. The semilunar valves both have three cusps consisting of connective tissue reinforced by fibers. These valves
3The only electrical conduction link between the atria and the ventricles goes through the
atrioventricular bundle which penetrates the fibrous skeleton in a location between the mitral, aortic and tricuspid valves [37].
Aortic valve Pulmonary valve Tricuspid valve Mitral valve Papillary muscles Chordae Tendineae
Fig. 2.3: Illustration of the mitral valve and its associated chordae tendineae and papillary muscles (left) and the heart valves and the fibrous rings surrounding each valve (right).
do not have chordae tendineae, instead the shape of the cusps prevent any form of prolapse.
2.1.2
The cardiac electrical system
Cardiac muscle cells can possess at least four properties: automaticity (the ability to initiate an electrical impulse), conductivity (the ability to conduct electrical im-pulses), contractility (the ability to shorten and do work) and lusitropy (the ability to relax) [38]. Cells in different areas of the heart are specialized to perform different tasks; all cells possess the conductivity property, the working cells are mainly able to contract and relax while the cells governing the electric systems are adapted to automaticity and conductivity. The pumping action of the heart is synchronized by pacemaker cells, concentrated in the sinoatrial node (located in the right atrium), the atrioventricular node (located in the wall between the atria) and in the His-Purkinje system (starting in the atrioventricular node and spreading over the ventricles), see figure 2.4.
An action potential generated in the sinoatrial node (which normally controls the heart rate) will spread through the atria and initiate atrial contraction. The atria are electrically isolated from the ventricles, connected only via the atrioventricular node which briefly delays the signal. The delay in the transmission allows the atria to empty before the ventricles contract. The distal part of the atrioventricular node is referred to as the Bundle of His. The Bundle of His splits into two branches, the left bundle branch and the right bundle branch, activating the left and the right ventricle, respectively. The action potential spreads very quickly through the ventricle due to the fast His-Purkinje cells, causing almost immediate synchronous excitation of the entire ventricular wall [39].
The electrocardiogram (ECG)
Cardiac action potentials are conducted to the body surface, where they can be measured as an electrical potential that varies with the current flow through the heart. Action potentials associated with different cardiac regions are illustrated in
2.1. CARDIOVASCULAR ANATOMY AND PHYSIOLOGY
Atria
Atrioventricular node Bundle of His Bundle branches Purkinje fibers Ventricles Sinoatrial node P Q R S T
Fig. 2.4: Morphology and timing of action potentials from different regions of the heart are illustrated in the right-hand side of the figure. Also illustrated is the related ECG
signal as measured on the body surface. Redrawn from S¨ornmo and Laguna [39].
figure 2.4 along with a typical ECG waveform measured from the body surface. The ECG can be seen as a projection of a dominant vector (represented by the summation in time and space of the action potentials from each muscle cell) onto a lead vector, whose direction is defined by the position of the measurement electrodes in relation to the heart [39]. The ECG describes the different electrical phases of the heart, where depolarization of the atria gives rise to the P-wave, depolarization of the ventricles combined with repolarization of the atria results in the QRS-complex and repolarization of the ventricles results in the T-wave.
2.1.3
The cardiac cycle and the pressure-volume loop
The blood pressure within a chamber increases as the heart contracts, generating a flow from higher pressure areas towards lower pressure areas. The work diagram of the heart, illustrated in figure 2.5 for the left ventricle, is referred to as a pressure-volume (PV) loop [37]. The following discussion applies to the left side of the heart, but the key concepts are similar for the right side.
When left atrial pressure exceeds the pressure in the left ventricle, the mitral valve opens (A) and the atrium empties into the ventricle (filling). During the rapid filling phase, venous blood from the lungs enters the atrium, and as the pressure gradient between the atrium and the ventricle levels out (reduced filling phase), a final volume of blood is forced into the ventricle by atrial contraction. When tension develops in the ventricular wall, increased intraventricular pressure will force the mitral valve to shut (B). The pressure stretching the ventricle at this moment is called preload. The amount of pressure exerted is determined by the duration of ventricular diastole
together with the venous pressure. Within limits, the more the heart is stretched during diastole, the more vigorous the contraction will be in systole. Since the heart is contracting while all valves are closed, ventricular pressure will increase whereas the volume remains unchanged (isovolumic contraction). The first heart sound originates from events related to the closing of the mitral valve (B) and the opening of the aortic valve (C). The ventricular pressure required to open the aortic valve is called afterload, a parameter which, consequently, is affected by arterial blood pressure.
As blood is ejected from the heart, ventricular pressure decreases, and when it falls below the aortic pressure, the aortic valve closes again (D). In association with valve closure, S2 is heard. The end-systolic pressure-volume ratio is a clinical measure of cardiac muscle performance referred to as myocardial contractility. Again all valves are closed, but this time the pressure will decrease while the volume remains unchanged. This phase, called isovolumetric relaxation, will complete the loop and start a new heart cycle.
Pressure (mmHg) 120 100 80 60 40 20 0 160 120 100 80 60 40 20 140 C B A D Isovolumic contraction Isovolumic relaxation Volume (ml) D ias tole Sys tole Eje ction Filling
Fig. 2.5: Work diagram (pressure-volume loop) of the left ventricle.
The PV-loop illustrates the changing pressures and flows within the heart, however, it has no time scale. Wiggers diagram, see figure 2.6, demonstrates the temporal correlations between electrical and mechanical events in the left side of the heart over one cardiac cycle [37]. The electrical R-wave, representing ventricular depolariza-tion, precedes the beginning of ventricular contraction. The ventricular contraction causes a rapid rise in the left ventricular pressure. As soon as the ventricular pres-sure exceeds the atrial prespres-sure, the mitral valve closes (B in the PV-loop). This is when S1 is heard. When the ventricular pressure exceeds the aortic pressure, the aortic valve opens (C in the PV-loop), and the blood flows from the ventricle to the aorta. At the end of blood ejection, the pressure in the ventricle falls below the aortic pressure, and the aortic valve closes (D in the PV-loop), giving rise to S2. The pressure in the ventricle drops steeply, and when it falls below the atrial pressure, the mitral valve opens (A in the PV-loop), and the rapid filling phase begins. The rapid filling phase might cause an impact sound, the third heart sound (S3), when blood collides with the ventricular wall. Similarly, atrial systole may also produce an audible forth heart sound (S4). S3 and S4 will be described more carefully in section 2.5.
2.1. CARDIOVASCULAR ANATOMY AND PHYSIOLOGY
Mitral valve Aortic valve
Open Open
Open
Diastole Systole Diastole
Aortic pressure Left ventricular pressure ECG Heart sounds S3 S1 S4 S2 S4 P Q R S T Left atrial pressure Amplitude (V) Pressure (mmHg) Flow (l/s) Aortic flow velocity Pulmonary artery flow velocity
Fig. 2.6: Wiggers diagram, showing pressures and flows in the left side of the heart over one heart cycle and how they relate to electrical (ECG) and mechanical (PCG) activity.
2.1.4
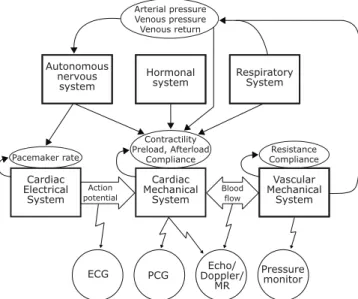
Coupling in the cardiovascular system
As stated before, the main task of the cardiovascular system is to efficiently maintain an arterial pressure which is high enough to meet the flow demands of the body’s tissues. Blood pressure refers to the force exerted by circulating blood on the walls of blood vessels, and is directly determined by the arterial blood volume and arterial compliance [38]. These physical factors are in turn affected primarily by cardiac output and peripheral vessel resistance (whose product approximately equals mean arterial pressure).
Cardiac output is defined as the heart rate times the stroke volume. The cardiac electrical system is the main rate controller, whose task is to synchronize the cardiac mechanical system. The most important regulators of heart rate are the autonomous nervous system (sympathetic activity increases heart rate while parasympathetic activity decreases heart rate) and the hormonal system [38].
The cardiac mechanical system is mainly regulated by the three factors controlling stroke volume: preload, afterload and myocardial contractility (see section 2.1.3). Heart rate and contractility are strict cardiac factors while preload and afterload depend on both cardiac and vascular factors. These latter two provide a functional
Cardiac Electrical System Cardiac Mechanical System Vascular Mechanical System Autonomous nervous system Hormonal
system RespiratorySystem
Pacemaker rate Contractility Preload, Afterload Compliance Resistance Compliance Arterial pressure Venous pressure Venous return Action potential Blood flow
ECG PCG Doppler/Echo/
MR
Pressure monitor
Fig. 2.7: Diagram surveying different interactions between the systems involved in cardiac activity along with various measurable signals. The illustration should not be considered complete, it rather functions as a facilitator of the main text. The abbre-viated measurable signals at the bottom are the electrocardiogram (ECG), phonocar-diogram (PCG), echocarphonocar-diogram (ECG), Doppler ultrasound (Doppler)and magnetic resonance imaging (MR).
coupling between the heart and the blood vessels since both preload and afterload are important determinants of cardiac output. However, at the same time, they are also determined by cardiac output [38].
The respiratory system causes periodic changes in the intra-thoracic pressure, effect-ing blood flow, venous pressure and venous return [38]. Amongst others, changes in diastolic filling of the heart lead to rhythmic variations in cardiac output (the heart rate is increased during inspiration and decreased during expiration, a phenomenon called respiratory sinus arrhythmia). A schematic illustration of interconnections in the cardiovascular system is given in figure 2.7.
In physics, two systems are coupled if they are interacting with each other. The car-diovascular system is interconnected through many different feedback control loops, why coupling is an innate and natural property of the system. Unfortunately, since most components are interdependent on each other, it is very difficult to elucidate these interactions. In fact, most of these interconnections are not understood. Some possible (and probable) interactions are the ones illustrated in figure 2.7.
From figure 2.7, it can also be seen that the vascular mechanical system is affected by both the respiratory system and the cardiac system. These interactions can be used to gain information about physiological parameters that are not directly measured. For example, in paper I (chapter 7), information gained from the ECG and the PCG are utilized to track blood pressure changes and to monitor respiration via cardiac time intervals.

![Table 3.1: Comparison of linear and nonlinear signal processing techniques. The table is adapted from Abarbanel [105].](https://thumb-eu.123doks.com/thumbv2/5dokorg/5414977.139170/79.701.70.641.120.636/table-comparison-linear-nonlinear-processing-techniques-adapted-abarbanel.webp)
