Linköping University Medical Dissertations No. 1417
Lithium formate EPR dosimetry for
accurate measurements of absorbed
dose in radiotherapy
Emelie Adolfsson
Department of Medical and Health Sciences Linköping University, Sweden
Lithium formate EPR dosimetry for accurate measurements of absorbed dose in radiotherapy
Emelie Adolfsson, 2014 Cover photo: Mattias Karlsson
Published articles has been reprinted with the permission of the copyright holder. Printed in Sweden by LiU-Tryck, Linköping, Sweden, 2014
ISBN 978-91-7519-246-8 ISSN 0345-0082
ABSTRACT
Lithium formate has shown to be a material with properties suitable for electron paramagnetic resonance (EPR) dosimetry, among them up to 7 times higher sensitivity compared to alanine, which is a well-established EPR detector material for dose determinations in radiotherapy.
The aim of this thesis was to further investigate the properties of lithium formate and develop the dosimetry system towards applications in radiotherapy. The intrinsic efficiency for energies of relevance to brachytherapy and the signal stability were investigated. The dosimetry system was expanded to include a smaller dosimeter model, suitable for measurements in dose gradient regions. An individual sensitivity correction method was applied to the smaller dosimeters to be able to perform dose determinations with the same precision as for the larger ones. EPR dosimetry in general is time consuming and effort was spent to optimize the signal readout procedure regarding measurement time and measurement precision.
The system was applied in two clinical applications chosen for their high demands on the dosimetry system: 1) a dosimetry audit for external photon beam therapy and 2) dose verification measurements around a low energy HDR brachytherapy source.
The conclusions drawn from this thesis were: dose determinations can be performed with a standard uncertainty of 1.8-2.5% using both the original size dosimeters and the new developed smaller ones. The dosimetry system is robust and useful for applications when high measurement precision and accuracy is prioritized. It is a good candidate for dosimetry audits, both in external beam therapy and brachytherapy.
LIST OF PAPERS
The present thesis is based on the following papers. They are referred to in the text by their capital Roman numerals.
I. Response of lithium formate EPR dosimeters at photon energies relevant to the dosimetry of brachytherapy. E Adolfsson, G Alm Carlsson, J-E Grindborg, H Gustafsson, E Lund and Å Carlsson Tedgren. Medical Physics 37 (2010) 4946-4959
II. Investigation of signal fading in lithium formate EPR dosimeters using a new sensitive method. E Adolfsson, M Karlsson, G Alm Carlsson, Å Carlsson Tedgren, E Lund, S Olsson and H Gustafsson. Physics in Medicine and Biology 57 (2012) 2209-2217
III. Optimisation of an EPR dosimetry system for robust and high precision dosimetry. E Adolfsson, Å Carlsson Tedgren, G Alm Carlsson, H Gustafsson and E Lund. Radiation Measurements 70 (2014) 21-28
IV. A system for remote dosimetry audit of 3D-CRT, IMRT and VMAT based on lithium formate EPR. Conditionally accepted for publication in Radiotherapy and Oncology
V. Measurement of absorbed dose to water around an electronic brachytherapy source. Comparison of two dosimetry systems: lithium formate EPR dosimeters and radiochromic EBT2 film. E Adolfsson, S White, G Landry, E Lund, H Gustafsson, F Verhaegen, B Reniers, Å Carlsson Tedgren and G Alm Carlsson. Submitted to Physics in Medicine and Biology
CONTRIBUTIONS
I. The project was initiated by Å Carlsson Tedgren. I planned the experiments together with Å Carlsson Tedgren and G Alm Carlsson. I performed the experiments and the analysis. I wrote the first manuscript draft and participated in the writing process.
II. The project was initiated by me, H Gustafsson and M Karlsson. I planned and performed all experiments together with M Karlsson. I was responsible for the analysis and wrote the article with assistance from the other authors. I was the corresponding author.
III. The project was initiated by me and E Lund. I planned and performed all experiments together with E Lund with support from H Gustafsson. I was responsible for the analysis and wrote the manuscript with assistance from E Lund and the other authors. I was the corresponding author.
IV. The project was initiated by S Olsson after the idea from Professor Pedro Andreo. I participated in the planning of the project and performed the
experimental work. I was responsible for the analysis and the manuscript writing. I am the corresponding author.
V. The project was initiated by E Lund and Å Carlsson Tedgren. I was responsible for and performed all EPR-measurements. I wrote the parts that concerns EPR dosimetry together with G Alm Carlsson and participated in discussions and writing of the other parts.
Other related publications not included in the thesis:
i. E Lund, E Adolfsson, N Kolbun, H Gustafsson: “EPR imaging of dose rate distributions aiming at applications in radiation therapy”. Radiation Protection Dosimetry, 2014, Vol159, No 1-4, pp130-136
ii. N Kolbun, E Adolfsson, H Gustafsson, E Lund: “High-resolution mapping of 1D and 2D dose distributions using X-band electron
paramagnetic resonance imaging” Radiation Protection Dosimetry, 2014, Vol159, No 1-4, pp182-187
Peer reviewed conference abstracts:
E Adolfsson, G Alm Carlsson, J-E Grindborg, H Gustafsson, E Lund, Å Carlsson Tedgren. “Response of lithium formate EPR dosimeters at photon energies relevant to brachytherapy”. World Congress – Medical physics and biomedical engineering, Munich, 2009
E Adolfsson, G Alm Carlsson, J-E Grindborg, H Gustafsson, E Lund, Å Carlsson Tedgren. “Decreased dose response for low energy photons indicating a LET dependence in lithium formate EPR dosimeters”. EPR-Biodose
ABBREVIATIONS
3D-CRT Three-dimensional Conformal Radiotherapy AAA Anisotropic Analytical Algorithm
APBI Accelerated Partial Breast Irradiation
BIPM International Bureau of Weights and Measures CPE Charged Particle Equilibrium
CT Computed Tomography
EBS Electronic Brachytherapy Source EPR Electron Paramagnetic Resonance ESR Electron Spin Resonance
HDR High Dose Rate HU Hounsfield Unit HVL Half Value Layer
IMRT Intensity Modulated Radiation Therapy IORT Intraoperative Radiation Therapy KERMA Kinetic Energy Released per unit Mass LET Linear Energy Transfer
MC Monte Carlo
MLC Multi Leaf Collimator OAR Organ at Risk
RAKR Reference Air Kerma Rate RE Relative Effectiveness RED Relative Electron Density SSD Source-surface Distance
SSDL Secondary Standard Dosimetry Laboratory TCPE Transient Charged Particle Equilibrium TLD Thermoluminescence Dosimetry TPS Treatment Planning System VMAT Volumetric Modulated Arc Therapy QA Quality Assurance
CONTENTS
1. INTRODUCTION ... 1
1.1 Aim ... 2
2. BACKGROUND ... 3
2.1 External beam radiotherapy ... 3
2.2 Brachytherapy ... 3
2.3 Electronic brachytherapy ... 4
3. DOSIMETRY ... 5
3.1 Introduction to radiation dosimetry ... 5
3.1.1 Ionizing radiation ... 5
3.1.2 Fluence ... 5
3.1.3 Kerma ... 5
3.1.4 Absorbed dose ... 6
3.1.5 Cavity theory ... 6
3.2 Radiation detectors in radiotherapy ... 6
3.3 Low energy photon dosimetry ... 7
3.4 Energy dependence of radiation detectors ... 8
3.4.1 Intrinsic efficiency ... 8
4. ELECTRON PARAMAGNETIC RESONANCE ... 9
4.1 EPR dosimetry ... 10
5. THE LITHIUM FORMATE DOSIMETRY SYSTEM ... 13
5.1 Lithium formate monohydrate... 13
5.2 Dosimeter production and storage ... 13
5.3 Spectrometer settings and equipment ... 14
5.4 Homogeneity test ... 14
5.5 Dose determination ... 15
5.6 Uncertainty analysis... 17
5.6.1 Uncertainty in the EPR signal ... 17
5.6.2 Uncertainty in the calibration of dosimeters ... 17
6. CHARACTERISTICS OF THE DOSIMETRY SYSTEM ... 19
6.1 Intrinsic efficiency of the lithium formate system ... 19
6.2 Signal fading ... 21
6.2.1 Ambient storage temperature... 22
7. FURTHER DEVELOPEMENTS OF THE DOSIMETRY SYSTEM ... 23
7.1 Dosimeter dimensions ... 23
7.2 Individual sensitivity correction ... 24
7.3 Optimization of readout process ... 25
7.4 Resonator type ... 26
7.5 Conclusions ... 27
8. DOSIMETRY AUDIT ... 29
8.1 Introduction to dosimetry audits ... 29
8.2 The lithium formate audit system ... 30
8.2.1 Acceptance criteria ... 32
8.3 Discussion ... 33
8.3.1 The audit method ... 33
8.3.2 Effect of phantom material ... 34
8.4 Conclusions ... 34
9. MEASUREMENTS AROUND ELECTRONIC BRACHYTHERAPY SOURCES ... 35 9.1 Experimental details ... 35 9.2 Conclusions ... 37 10. SUMMARY ... 39 11. CONCLUSIONS... 41 12. FUTURE WORK ... 43 12.1 National audit ... 43 12.2 Brachytherapy audit ... 43
12.3 Lithium formate in high LET radiation ... 44
13. ACKNOWLEDGEMENTS... 47
Introduction
1
1.
INTRODUCTION
The responsibility of a medical physicist working with radiotherapy is to control the dose delivered to the patient. Small margins determine the difference between tumour control and risk for severe side effects. New complicated treatment techniques and technical equipment are developed and implemented rapidly in the clinic and accurate dose verification measurements are necessary to ensure a safe patient treatment. The tumour should receive as high dose as possible, while the dose to the surrounding organs at risk (OARs) and healthy tissue should be minimized to avoid severe side effects induced by the treatment.
There are several methods and equipment available for dose verification measurements, which one to choose must be decided upon the aim of the measurement. This thesis focuses on a dosimetry technique utilizing electron paramagnetic resonance (EPR) spectroscopy. The EPR technique is well established for dosimetry applications using alanine as dosimeter material and is e.g. used as a secondary standard for absorbed dose to water at both The National Physical Laboratory (NPL, UK) (Sharpe et al., 1996) and at the Physikalisch-Technische Bundesanstalt (PTB) (Anton, 2005).
Alanine is relatively insensitive for radiation and quite high doses are needed to achieve sufficient precision. New, more sensitive materials have been tested for EPR dosimetry, with the possibility of determining lower doses with high precision (Gustafsson, 2008). One of the most promising materials found was polycrystalline lithium formate monohydrate (referred to as lithium formate in the following text) with several properties desirable for applications in radiotherapy.
The EPR method is relatively time consuming and the high precision equipment expensive and is hence less suitable for daily use in the clinic. The strength of EPR dosimetry is its accurate and reproducible measurements, suiting applications that demand high accuracy.
Introduction
2
1.1 Aim
The overall aim of this thesis was to develop the lithium formate dosimetry system towards applications in both external beam radiotherapy and brachytherapy. Two applications of current interest and with high demands on the dosimetry system were chosen: 1) dosimetry audit for advanced external photon beam therapy techniques and 2) verification measurements around low energy, high dose rate (HDR) brachytherapy sources.
To be able to fulfil these aims, there was a need for further developments of the system, namely to:
1. Evaluate the detector response (intrinsic efficiency) for measurements around low energy sources of relevance for brachytherapy.
2. Investigate the signal stability over time after irradiation and possible effects due to storage temperature.
3. Develop a system utilizing smaller sized dosimeters. The original dosimeter size (diameter 4.5 mm, height 4.8 mm) is too large for measurements in dose gradient regions.
4. Optimize the performance of the system regarding measurement time and precision.
The clinical applications chosen here are examples of applications where the advantages of the lithium formate system come to its right. The developments performed in this thesis are general and will assure high quality measurements in a wide variety of applications. The conclusions drawn from this thesis were: dose determinations can be performed with a standard uncertainty (k=1) of 1.8-2.5% using both the original size dosimeters and the new developed smaller ones. The dosimetry system is robust and useful for applications when high measurement precision and accuracy are prioritized. It is a good candidate for dosimetry audits, both in external beam therapy and brachytherapy.
Background
3
2.
BACKGROUND
2.1 External beam radiotherapy
External beam radiotherapy is used for most cancer patient requiring radiotherapy. Normally a linear accelerator is used for dose delivery and the energy is in the megavoltage range, about 4-20 MV. The dose is divided as several fractions. The fractionation schedule depends on diagnose and on the treatment intent (curative or palliative). A common fractionation is 2 Gy a day, 5 days a week for 5-6 weeks. The patient is located on a treatment couch using some kind of fixation method for reproducible set-up each treatment fraction. The accelerator gantry (treatment head) can be rotated 360° around the patient, allowing irradiation from all angles.
There are several techniques available for external beam therapy. Three-dimensional conformal radiotherapy (3D-CRT) is the standard procedure. This technique utilizes a number of fixed gantry angles and fixed field openings. Variations of different modulated techniques have been introduced recently. The intensity modulated radiotherapy (IMRT) technique delivers radiation with fixed gantry angles but dynamic field openings. Multi leaf collimators (MLC) are used to shape the radiation field, these can either be dynamic or used as a “step-and-shoot” technique. In volumetric modulated arc therapy (VMAT), both the gantry and the MLC is dynamic during irradiation. These techniques allow the dose distribution to be more conformal around the target, but a larger volume of normal tissue is irradiated to low doses compared to 3D-CRT. Stereotactic radiotherapy is used for small targets, e.g., for small lung tumours or brain metastases. The technique utilizes small radiation fields (a few cm2), few fractions and large fraction doses.
2.2 Brachytherapy
Brachytherapy is a technique where radioisotopes or miniature x-ray sources are positioned inside (intestital) or next to (intracavitary) the treatment target. The energies used are normally in the keV region, depending on the radioisotopes used and are hence in general much lower compared to external beam therapy. The dose around the source
Background
4
decreases rapidly, approximately as 1/r2, where r is the radial distance from the source. Also, since the sources are fixed in the target, the problem of organ movement is reduced. Hence, the delivered dose in brachytherapy is absorbed more locally and protects healthy tissue to a higher extent than external beam therapy. Brachytherapy is commonly used as an effective treatment for prostate, cervical, breast and skin cancer but is also used to treat tumours in other body sites. The technique can be used alone or in combination with other therapies such as surgery, external beam radiotherapy and chemotherapy. The fraction dose is usually larger but the number of fractions fewer compared to external beam therapy.
2.3 Electronic brachytherapy
Recently, electronic brachytherapy sources (EBS) have been introduced for brachytherapy treatments. The electronic sources are x-ray tubes in miniature, operating with a tube voltage of 40 kV - 50 kV. The electronic source is turned off after use. That, in combination with the low tube voltage reduces the demands of radiation protection compared to conventional radioisotopes.
The electronic sources including their necessary cooling system are too large to be used for interstitial treatments, such as prostate treatments. The main area of interest for the electronic sources is intraoperative radiation therapy (IORT). Interest in IORT using electronic sources is increasing as the possible benefits for the patient of this technique become apparent. The ability to deliver a single therapeutic dose to the tumour bed during surgery, and thereby avoid the standard 5-week course of external-beam therapy treatment is a major advantage for both the patient and the work-load. In adjuvant radiotherapy after breast surgery, it is of particular importance to protect the lungs and heart from radiation. This can be achieved to a higher degree using brachytherapy compared to external beam radiotherapy. Accelerated partial breast irradiation (APBI) is another area of interest for EBS.
Dosimetry
5
3.
DOSIMETRY
3.1 Introduction to radiation dosimetry
Radiation dosimetry is the subject that describes methods for quantitative determination of energy deposited in a medium by ionizing radiation. The medium of interest in radiotherapy is human tissue. Experimental determination of absorbed dose is often performed in so-called phantoms. A phantom is used to simulate human tissue and is made of plastics, solid or water-filled. Measurements in phantoms are performed under controlled conditions and in known geometries. Below follows a short introduction to the quantities and concepts defined for describing a photon radiation beam.
3.1.1 Ionizing radiation
Ionization produced by particles is the process where one or several electrons are liberated when collisions between the particles and atoms or molecules occur. Ionizing radiation is according to ICRU (ICRU, 2011) defined as charged particles (e.g. electrons and protons) and uncharged particles (e.g. photons and neutrons) that produces ionizations in a medium, or initiates nuclear or elementary-particle transformations that result in ionization or the production of ionizing radiation.
3.1.2 Fluence
Particle fluence, Φ, is defined as the number of particles dN that passes through a sphere with cross-section area dA. The definition is set as if the incident radiation always is perpendicular of the cross-section area, i.e. particle fluence is independent of incidence angle of the radiation. The unit of fluence is m-2.
[m-2] (1)
3.1.3 Kerma
Kerma is the acronym for kinetic energy released per unit mass and is only defined for uncharged particles. Kerma quantifies the average amount of energy transferred from
d d N A
Dosimetry
6
uncharged ionizing particles to charged ionizing radiation (dEtr) (e.g. from photons to orbital electrons) per unit mass (dm), with no concern to the energy after this transfer. The unit of kerma is Gy (J/kg)
tr
d d
K E m [J/kg = Gy] (2)
3.1.4 Absorbed dose
Energy of photons is imparted to matter in a two-step process. In the first step (resulting in kerma), the photons transfer energy as kinetic energy to secondary charged particles and in the second step, these charged particles impart some of their energy (small enough to not be ionizing) to matter. The absorbed dose is related to the energy imparted and is defined as the expectation value of the mean energy imparted, d , by ionizing radiation to an infinitesimally small volume (point) of mass dm:
d d
D m [J/kg = Gy] (3)
Note that charged particles deposit their energy along their track, the absorption of energy does not occur at the same location as the transfer of energy described by kerma. The unit of absorbed dose is Gy.
3.1.5 Cavity theory
To quantify absorbed dose by experimental measurements, a detector (dosimeter) needs to be inserted in the radiation field. Normally, the sensitive material of the detector is not the same as the surrounding medium and hence, the detector will disturb the fluence of ionizing radiation. Cavity theory relates the mean absorbed dose in the detector to the absorbed dose in the undisturbed medium, i.e., when the detector is not present. For photon beam irradiation, cavity sizes are referred to as small, intermediate or large in comparison with the ranges of secondary electrons produced by the photons in the cavity medium.
3.2 Radiation detectors in radiotherapy
Radiation detectors are divided into two groups, direct reading detectors where the signal is displayed instantaneously (ionization chambers, semiconducting diodes, etc.), and passive detectors that need some kind of readout process after irradiation to establish the result (thermoluminescent (TL) detectors, EPR detectors etc.). While the direct reading detectors often are preferred in the clinic due to the rapid display of result, passive dosimeters have their advantage of being less dependent of radiation direction, no stem or cable is included in the radiation field. The measurements are often time consuming but can be worthwhile when yielding increased precision and accuracy.
Dosimetry
7
For radiotherapy purposes the detector should be robust and produce measurements with high precision and accuracy. It should be as tissue equivalent as possible in the meaning that the disturbance of the fluence should be minimized. It should also have a dose response (signal per mean absorbed dose in the detector) as independent of radiation quality as possible since the energy spectrum varies with position in the tissue or phantom used for measurement. Radiotherapy clinics normally hold one or a few sub-standard detectors that are calibrated at a secondary standard dosimetry laboratory (SSDL) with traceability to a primary standard. These instruments, normally ionization chambers, serve as working standard for dose measurements in absolute terms and are used to calibrate other detectors. The traceability ensures that the magnitude of absorbed dose (to water) in a certain point is equal and independent of clinic and is the ground for comparing and transferring clinical results and new findings.
3.3 Low energy photon dosimetry
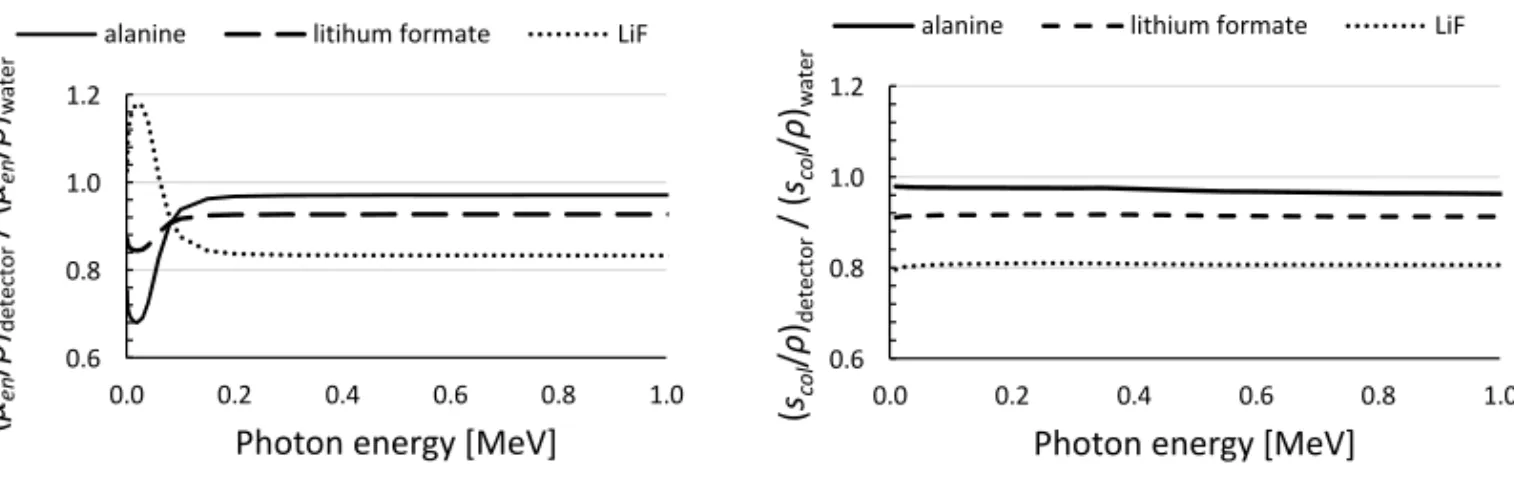
The definition of low photon energy in this thesis is energies of relevance for brachytherapy, i.e. in the keV region. Performing experimental dosimetry in low photon energies is different than measurements in MeV photon beams. The interaction processes of photons in these two energy intervals are different. While the dominating interaction process for MeV photons in human tissue is Compton scattering, photoelectric effect starts to have a large impact at energies around 50 keV and below. The dose gradients occurring due to the 1/r2 dose decrease make accurate positioning and dose averaging effects in the detector important. Also, attenuation of photons in the keV energy region is sensitive to phantom material composition. It is of great interest to identify dosimetry systems that are capable of performing dosimetric measurements in absolute values around such sources. In this thesis, “absolute dosimetry” is used to describe measurements that, through use of detectors calibrated with traceability to primary standards, result in values with unit Gy. One option is to use solid state detectors that can be made small to reduce the fluence disturbance and resolve the gradients. The size of the lithium formate dosimeters are larger than e.g. lithium fluoride (LiF) TLDs that have higher sensitivity, but compared to both lithium fluoride and alanine, lithium formate has mass-energy absorption coefficients closer to water at energies below 200 keV, see Figure 1. The mass collision stopping power is rather constant for all materials in this energy region (Figure 1). Also, the density of the lithium formate dosimeters, 1.31 g/cm3 (including paraffin) and alanine 1.42 g/cm3, is closer to the density of water compared to LiF 2.62 g/cm3.
It should however be noted that for measurements in very high gradient regions there are other preferred systems capable of high resolution measurements, e.g. diods and diamonds.
Dosimetry
8
3.4 Energy dependence of radiation detectors
The general term “energy dependence” is used with several different definitions in the literature. In radiotherapy, one commonly refers “absorbed dose” as absorbed dose to water unless otherwise specified. In that context, energy dependence is defined as the dependence of the dosimeter signal per unit of absorbed dose in water on the photon beam energy. This type of energy dependence can be expressed in terms of ratios of mass-energy absorption coefficients or stopping power of detector material and water (Figure 1).
3.4.1 Intrinsic efficiency
In addition to differences in energy absorption properties between detector material and water, experimental dosimetry is influenced by variations in the radiation yield with beam quality (radical production for EPR dosimeters, light output for TL dosimeters etc.). This is most likely caused by the density of ionization with which the charged particles impart energy to the detector. This definition of energy dependence could be regarded as the more fundamental one since it reflects the energy efficiency of the dosimeter, i.e., the ability of the dosimeter to give the same reading for the same amount of absorbed energy in its own sensitive volume, regardless of radiation type or quality. This energy dependence is commonly referred to as “intrinsic efficiency”, “LET dependence” (LET = linear energy transfer), or “detector response” and must be experimentally investigated. The intrinsic efficiency is of special importance when measurements and calibration of detectors are performed in two different radiation qualities.
Figure 1. Ratio of mass-energy absorption coefficients (left) and mass collision stopping power (right) of alanine, lithium formate and lithium fluoride relative to those of water.
(µen /ρ )detector / ( µen /ρ )wa te r
Photon energy [MeV]
alanine litihum formate LiF
(sco l /ρ )detector / ( scol /ρ )wa te r
Photon energy [MeV]
alanine lithium formate LiF
0.6 0.8 1.0 1.2 0.0 0.2 0.4 0.6 0.8 1.0 0.6 0.8 1.0 1.2 0.0 0.2 0.4 0.6 0.8 1.0
Electron paramagnetic resonance
9
4.
ELECTRON PARAMAGNETIC
RESONANCE
EPR is a technique to study chemical species that have one or more unpaired electrons (e.g. free radicals). Apart from being used in radiotherapy, EPR is a common method for retrospective dosimetry, where several substances, such as tooth enamel, finger nails, sweeteners and mobile phone glass are used for dose determination. The technique is also applied for geological and archaeological dating.
EPR spectroscopy is built on the principles of quantum mechanics, the fact that a molecule or atom has discrete energy states. The energy differences studied in EPR spectroscopy depend on interactions of unpaired electrons in the sample with an external magnetic field produced by a magnet in the laboratory, B0. The electron magnetic moments align itself either parallel or antiparallel with B0.
In an EPR spectrometer, the sample is positioned in a resonator cavity at the centre of B0. A standing wave pattern of microwaves forms inside the cavity via a waveguide. The magnetic field component, B1, is oscillating while static electromagnetic (EM) radiation is applied. When the magnetic field strength increases, the energy difference (∆E) between the two spin states of the electron will also increase until it matches the energy of the EM radiation and energy absorption occurs, resulting in an absorption spectrum.
Electron paramagnetic resonance
10
4.1 EPR dosimetry
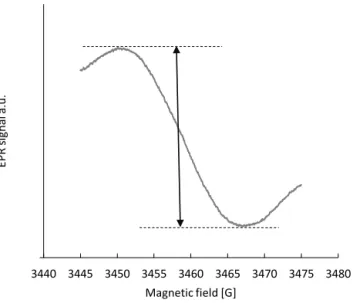
The absorbed energy from ionizing radiation is proportional to the number of unpaired electrons in the sample. The absorption spectrum is Gaussian shaped and the peak-to-peak value of the first derivative of the spectrum is taken as the intensity of the EPR signal, Figure 2. The readout technique is non-destructive to the signal and the sample can be read several times to improve measurement precision.
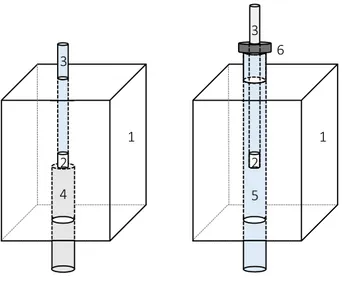
The dosimeters are positioned in sample tubes that in turn are positioned in the resonator. It is essential that both the tubes and the fixation of them is robust and precise. If the dosimeter fixation is poor, the reproducibility in the measurements will be poor. The fixation method used should not disturb the magnetic field and the equipment must not induce any additional EPR signal. The most common method for sample tube fixation is to use a pedestal that serves as the bottom of the resonator for the sample tube to rest on. The pedestal has a drilled well that fits the sample tube and prevents it from moving in any direction inside the resonator, see Figure 3 (left). An alternative to the pedestal is to use a so called double tube fixation. An outer sample tube is fixed in the resonator by screws both at the top and bottom. The dosimeters are positioned in a narrower sample tube that fits exactly into the outer tube. A collar on the inner tube assures reproduced position in the vertical direction (right hand Figure 3). This method fix the dosimeter position without pedestal.
-0.7 3440 3445 3450 3455 3460 3465 3470 3475 3480 EP R s ig na l a. u. Magnetic field [G]
Figure 2. EPR spectrum of lithium formate. The arrow indicates the peak-to-peak amplitude, taken as the EPR signal intensity.
Electron paramagnetic resonance 11 1 1 2 2 3 3 4 5 6
Figure 3. Schematic view of the resonator and the two fixation methods. Left: pedestal, right: double tube. The numbers marked are: 1) resonator, 2) EPR dosimeter, 3) sample tube, 4) pedestal, 5) outer fixation tube and 6) collar attached to the sample tube. Screws used for fixation of pedestal and sample tube are not shown in the sketch.
The lithium formate dosimetry system
13
5.
THE LITHIUM FORMATE
DOSIMETRY SYSTEM
5.1 Lithium formate monohydrate
The active dosimetric material used is polycrystalline lithium formate monohydrate (98%) (HCO2 Li H2O). Lithium formate has shown to be a robust dosimeter material with high stability of the radiation induced free radicals, a linear dose response over a wide range (0.5 – 1000 Gy) and up to seven times higher sensitivity than the most common EPR dosimetry material alanine (Vestad et al., 2003; Vestad et al., 2004; Lund et al., 2002). The dosimetry system was developed during a dissertation work studying sensitive materials for EPR dosimetry (Gustafsson, 2008).
5.2 Dosimeter production and storage
The dosimeters are handmade, cylindrical with height 4.8 mm, diameter 4.5 mm and weight 100 ± 1 mg. To make them stable and non-fragile, solid paraffin (CnH2 n = 20 – 40) is used as a binder to 10% of weight. Lithium formate is grinded to achieve a grain size of 180-500 µm before adding paraffin. The mixture is heated to 88°C, below the melting point of lithium formate (94°C), but above the melting point of paraffin (54°-56°C). When the paraffin has melted, the content is carefully mixed. To ensure a homogenous mixture, the heating and mixing process is repeated three times. After the third heating, the content is mixed while cooling down to room temperature. The powder is held in room temperature one hour to let the paraffin solidify before the manufacturing starts. The powder is manually pressed to cylinders with a table-top pellet-press and carefully weighted to ensure homogenous dosimeters.
Lithium formate is slightly hygroscopic. To minimize any effect of humidity, the dosimeters are stored in a desiccator with a constant relative air humidity of 33%. Whenever taken out from the desiccator, they are placed in UV light protected and air-tight glass bottles. The effect of having the dosimeters free in room during irradiations and EPR measurements has shown to be negligible.
The lithium formate dosimetry system
14
5.3 Spectrometer settings and equipment
Two BRUKER spectrometers were used for measurements in this thesis, BRUKER EleXsys E580 (paper I) and E500 (paper II-V). A standard ER 4102ST resonator was used together with both spectrometers. In paper III, an ER 4122SHQE resonator (in the following text referred to as SHQE) designed for optimal sensitivity was evaluated. The sample tubes used were of the type Wilmad precision bore, synthetic quartz (Suprasil). Spectrometer settings are shown in Table 1.
Table 1. Spectrometer settings for EPR measurements.
Microwave power 20 mW Modulation frequency 100 kHz Modulation amplitude 12 G Sweep width 30 G Sweep time 168 s Time constant 328 ms Receiver gain 60 dB Number of points 1024
Each dosimeter is read out 4-5 times in a rotating schedule, i.e. the individual dosimeter readings are not performed one after the other but spread during the day. The signal is taken as the mean value of all readouts of that dosimeter.
5.4 Homogeneity test
The dosimeters are manufactured batch-wise, containing the same mixture of lithium formate and paraffin. To control the signal homogeneity within a batch, all dosimeters are pre-irradiated, read out and evaluated before use. The dosimeters receives 3 Gy using a 6 MV photon beam from a linear accelerator. The dose level is chosen to achieve a relatively high signal to noise ratio without introducing a too high signal in the dosimeters. The dosimeters are positioned in a PMMA phantom with holes drilled in a circle with equal radial distance from the centre (Figure 4). The positioning of the dosimeters minimizes the effect of a possible non-homogenous photon field since the field is rotational symmetric. Also, the phantom is rotated four times during the irradiation. Additional slabs of PMMA are positioned on top to achieve a depth of 8.5 cm (corresponding to 10 cm water using density scaling). Source-surface distance (SSD) 100 cm and field size 10x10 cm2.
For a batch to be considered successful, the standard deviation of the mean signals of all dosimeters in the batch should be lower than 1%. In addition, no individual dosimeter
The lithium formate dosimetry system
15
should deviate more than 2% from the mean; a reasonable limit set to ensure that no dosimeter accidentally would have been contaminated or exposed to humidity. All dosimeters belonging to one batch are stored together and treated equally to reduce influences from ambient conditions.
5.5 Dose determination
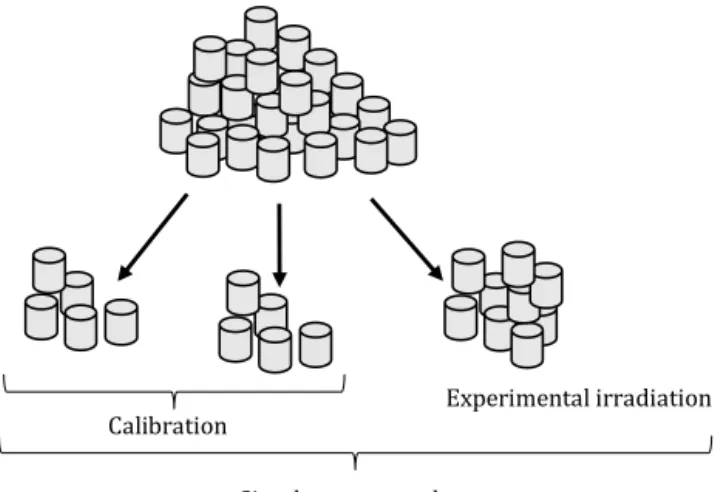
The homogeneity controlled dosimeter batch is divided into three subgroups, see Figure 5. One subgroup is used for the experimental irradiation and the two other groups for calibration to measure absorbed dose to water. One of the calibration groups is not further irradiated but used to subtract the signal induced by the homogeneity irradiation. The second calibration group is irradiated to a calibration dose, determined by an ion chamber with traceability to a primary standard, simultaneously present in the photon beam.
Figure 5. One manufactured dosimeter batch and its division into three subgroups. The two calibration groups represents one point each on the calibration curve.
Experimental irradiation Calibration
Simultaneous readout 15 cm
Figure 4. Schematic view of the phantom used for homogeneity irradiation. Phantom seen from above. The + sign in the centre is positioned in the field centre.
The lithium formate dosimetry system
16
The two calibration groups constitute the two end points in the calibration curve (straight line). The calibration curve is described as:
w
l aD b (4)
where l is the total EPR signal, i.e. the signal corresponding to the calibration dose, Dw, determined by the ion chamber, added to the homogeneity irradiation induced signal, b. The slope of the curve, M/Dw is denoted a. The signal introduced by the homogeneity irradiation is subtracted from all dosimeters and the equation is rewritten as:
M = aDw (5)
where M = l – b, the EPR signal corresponding the calibration dose.
The calibration factor is defined as the slope of the curve, a and is applied on the EPR signal induced by the experimental irradiation. The calibration curve and dose determination are illustrated in Figure 6.
Hence, dose to water is determined by the EPR dosimeters as:
(6) w w,EPR EPR EPR cal D D M M 0 10 0 10 EP R s ig na l Dose b M l a = M/Dw Dw
The lithium formate dosimetry system
17
5.6 Uncertainty analysis
The uncertainty analysis was developed following the “Guide to the expressions of uncertainty in measurements” (GUM) (International Organization for Standardization, 1995). The relative standard uncertainty of dose to water is expressed as:
(7)
where u M
EPR
is the uncertainty in the dosimeter signal reading, u D( w,cal)is the uncertainty in dose to water determination by the ion chamber and u M
EPR,cal
is the uncertainty in the calibration dosimeter signal.5.6.1 Uncertainty in the EPR signal
The uncertainty in a single dosimeter signal MEPR = l – b depends on the uncertainties in both the total signal l and the signal induced by the homogeneity irradiation, b. Type B uncertainties are neglected since systematic errors are minimized in the experimental design (Antonovic et al., 2009). The uncertainty in the signal l is estimated as the relative standard deviation in the homogeneity test (less than 1%, usually around 0.7%). The relative standard uncertainty in b is determined by the same figure divided by √𝑛, since b is given as the average signal of n dosimeters (normally 5). The relative standard uncertainty in MEPR from readout of a single dosimeter is then given by:
(8)
An experimental design normally includes several dosimeters in the same measurement point and hence, MEPR is taken as a mean value of that number of dosimeters. The uncertainty in MEPR is then further reduced by a factor 1/√𝑛.
5.6.2 Uncertainty in the calibration of dosimeters
The uncertainty in the calibration of dosimeters depends on the uncertainties in the absorbed dose determined by the ion chamber, Dw,cal and the corresponding EPR signal, MEPR,cal. The relative uncertainty of Dw,cal was estimated to 1.7%, a figure slightly higher than the 1.5% recommended in IAEA TRS398 (Andreo et al., 2000), to account for the use outside full reference conditions (PMMA phantom). The uncertainty in MEPR,cal is determined in analogy to MEPR above.
2 2
2w,EPR EPR w,cal EPR,cal
w,EPR EPR w,cal EPR,cal
( ) u D u M u D u M D M D M 2 EPR EPR ( ) ( ) ( ) u M u l u b M l b
The lithium formate dosimetry system
18
When applying this method one will end up with a relative uncertainty of 1.8% - 2.5% (k=1), depending on the homogeneity of the dosimeter batch and on the number of dosimeters used.
5.7 Previous clinical applications
The lithium formate EPR dosimetry system has previously been used to verify dose plans for IMRT treatments (Gustafsson et al., 2008) and for determining the dose distributions around 192Ir brachytherapy sources (Antonovic et al., 2009). A similar (but not identical) lithium formate system has been used to verify stereotactic treatments (Waldeland et al., 2010b). These investigations were all successful and important for showing the potential of the dosimetry system, leading to further developments and other clinical applications described in this thesis.
Characteristics of the dosimetry system
19
6.
CHARACTERISTICS OF THE
DOSIMETRY SYSTEM
6.1 Intrinsic efficiency of the lithium formate system
The recommended procedure for brachytherapy dose measurements is to calibrate dosimeters in MV photon beams (Rivard et al., 2004). This implies that the intrinsic efficiency of the detector used should be known and corrected for if needed. In paper I, the aim was to investigate differences in the intrinsic efficiency of lithium formate between MV and kV photon beams using x-ray qualities and 60Co as reference. Intrinsic efficiency was here defined as the variation in detector response, i.e. signal per mean absorbed dose in the detector (M D/ det) between different radiation qualities. To determine the intrinsic efficiency, Ddet needs to be derived. In this low energy range, primary standards are available in terms of Kair and to assure traceability, the dosimeters were irradiated at the Swedish SSDL in kV beams, 137Cs and 60Co with known values of air kerma traceable to BIPM (International Bureau of Weights and Measures, Paris, France). The qualities used are listed in Table 2.
Table 2. Tube voltage, half value layer (HVL) and corresponding effective energies of the beams used in the experiments.
Tube voltage (kV)
HVL (mm)
Effective energy (keV)
25 0.25 Al 13.9 50 1.00 Al 22.6 100 0.141 Cu 38.5 135 0.471 Cu 59.4 180 0.933 Cu 77.7 250 2.495 Cu 126.9 137Cs - 662 60Co - 1250
Characteristics of the dosimetry system
20
The registered signal per unit air kerma, M/Kair, was converted into signal per mean absorbed dose in the detector according to:
(9)
where Φ is the fluence. Ddet/was derived by Monte Carlo simulations andKair/ was calculated analytically.
The result as a function of effective energy is shown in Figure 7. Effective energy is here defined as the energy of monoenergetic photons having the same HVL as that of the spectrum. Effective energies for 137Cs and 60Co correspond to the primary photon energies.
The results show a decrease in response in the order of 5% - 6% for energy spectra of effective energies <100 keV. This implies that a 5% correction is required when measuring in these energies and calibration performed in 60Co.
The intrinsic efficiency is varying slowly with effective energies between 10 keV and 80 keV. The derived 5% correction factor should thus be relatively insensitive of energy spectra with effective energies in the same region. However, it would have been interesting to perform measurements for even lower photon energies. LET increases as the energy decreases and it is possible that the detector response is different for lower energies than those used in this study. An attempt was made irradiating the dosimeters in 10 kV. However, the dosimeter volume was too large to achieve homogenous dose distribution even though they were turned 180° (length direction) after receiving 50% of the total administrated dose. The central part of the dosimeters received lower dose than
0.90 0.95 1.00 1.05 1.10 1 10 100 1000 (M/D d et )Q /( M/D d et )Q0
Effective energy (keV)
Figure 7. The response of lithium formate dosimeters normalized to that of 60Co for the
six x-ray beams and 137Cs as function of effective energy. Error bars show the expanded
(k=2) uncertainty corresponding to 95% confidence interval.
air
det air det
1 K
M M
D K D
Characteristics of the dosimetry system
21
the sides and due to the non-linear sensitivity inside the EPR resonator (with its maximum in the resonator centre), the dose could not be determined accurately.
6.2 Signal fading
If the calibration and experimental irradiation is performed within a reasonable short time period, one can assume that the signal induced in the calibration dosimeters and in the experimental dosimeters would fade to an equal amount and a fading effect would be negligible. However, for practical reasons, calibration and experimental irradiation cannot always be performed simultaneously. Depending on fading level and time separation between calibration and experiment, the outcome of the experiment could be affected. Several attempts trying to determine a possible signal fading in lithium formate dosimeters have been performed (Vestad et al., 2003; Komaguchi et al., 2007; Gustafsson, 2008) indicating that a possible fading would be small. While these investigations have served valuable information they have not been precise enough to exclude a 1-2% fading effect.
In paper II, a new experimental method for signal fading determination was developed and used. Groups of dosimeters were irradiated with a certain time separation. After the last irradiation, all dosimeters were read out and evaluated. Two experiments were performed:
1) Five groups of five dosimeters each were irradiated five days in a row. On the fifth day, all dosimeters were read out and the signals from all groups were normalized to the group irradiated at the same day as the read out.
2) The same experimental set up as in 1) but with a time separation of one week between the irradiations.
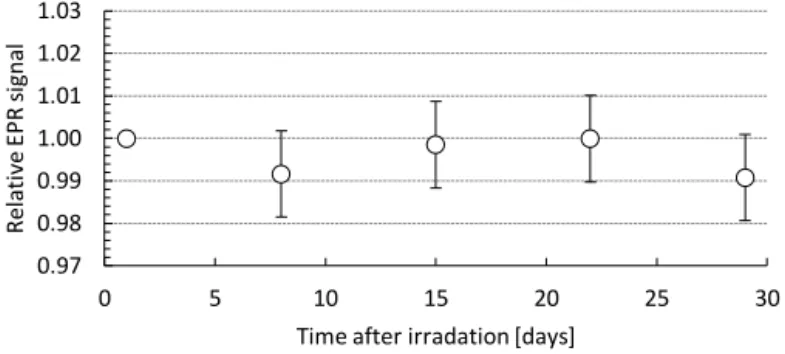
The result of the measurements showed no detectable signal fading within at least one month after irradiation, see Figure 8 and Figure 9.
Figure 8. EPR signal (mean value of five dosimeters) as a function of time after irradiation. Values are normalized to the EPR signal measured 1 hour after irradiation. Error bars show the combined expanded (k=2) uncertainty corresponding to a 95% confidence interval.
0.97 0.98 0.99 1.00 1.01 1.02 1.03 0 1 2 3 4 5 R el ati ve EP R s ig na l
Characteristics of the dosimetry system
22
Figure 9. EPR signal (mean value of five dosimeters) as a function of time after irradiation. Values are normalized to the EPR signal measured 1 day after irradiation. Error bars show the combined expanded (k=2) uncertainty corresponding to a 95% confidence interval.
6.2.1 Ambient storage temperature
When travelling with dosimeters or sending them by mail, the storage temperature cannot always be controlled. A possible effect on the signal due to storage temperatures was investigated in paper II.
A dosimeter batch were irradiated to 10 Gy and divided into five groups. The dosimeter groups were stored at temperatures between -21.5° C and +60° C for 24 h. The results are presented in Figure 10.
Dosimeters stored between -21.5°C and 40°C were not affected by temperature. For those stored in 60°C, the paraffin had started to liquefy since the paraffin melting point was exceeded. 0.97 0.98 0.99 1.00 1.01 1.02 1.03 0 5 10 15 20 25 30 R el ati ve EP R s ig na l
Time after irradation [days]
0.80 0.85 0.90 0.95 1.00 1.05 1.10 R el at ive EP R s ig na l Group Pre exp. Post exp.
40.0°C 4 -21.5°C 1 4.0°C 2 22.0°C 3 60.0°C 5 Figure 10. Effect on signal stability due to different storage temperatures.
Further developments of the dosimetry system
23
7.
FURTHER DEVELOPEMENTS OF
THE DOSIMETRY SYSTEM
7.1 Dosimeter dimensions
For measurements in regions containing dose gradients, the size of the dosimeter is essential. A dosimeter that is too large will not be able to resolve the gradient and a volume averaging effect will arise. Also, the positioning of the dosimeter will be essential, a slightly misplacement could lead to a large error in dose determination.
The original size of our dosimeters (diameter 4.5 mm and height 4.8 mm) is for some applications too large. The dosimeters are relatively non-fragile but the loss of a grain of material will affect a smaller dosimeter relatively more than a large one. It is more difficult and time consuming to produce smaller dosimeters with equal size and mass, at least as long as they are handmade. One must also be able to handle the dosimeters, both in the manufacturing process and during the EPR measurements. If the mass of the dosimeter is too low, gravity is not enough to get the dosimeter in position in the EPR sample tube as the tube have the same inner diameter as the diameter of the dosimeter. The dosimeter could be pressed down mechanically into position but would then be impossible to get out. A reduction of dosimeter volume will reduce the signal by the same proportion and to achieve the same signal to noise ratio, the dose must be increased. After several attempts with different dosimeter sizes it was decided to decrease both diameter and height to 3 mm, a reduction in volume by approximately 70%. In paper III, the smaller dosimeters were tested and evaluated regarding manufacturing process, precision and accuracy in result. A blind test regarding dose determination was performed.
Further developments of the dosimetry system
24
7.2 Individual sensitivity correction
The reproducibility of signal seen in Figure 10 (storage temperature dependence) inspired to develop a method for individual sensitivity calibration in paper III. This is of higher interest for the smaller dosimeters, where it is more difficult to achieve a low standard deviation in the signals in the homogeneity test. The investigated correction factor (inspired by TL dosimetry (Mayles et al., 1993)) is defined as
i batch/ i
C M M (10)
where Mbatch is the mean signal of the total batch and Mi is the signal of the individual dosimeter. For TL dosimetry, the calibration factor is determined both before and after the experimental irradiation, this is not possible for EPR dosimetry where the signal is maintained after readout. An experiment was performed to investigate whether calibration factors determined solely after the homogeneity control are maintained after the experimental irradiation. A batch of dosimeters were irradiated and read out, an individual calibration factor determined and then the procedure was repeated with a second irradiation, readout and calibration factor determination. Result is shown in Figure 11. All individual correction factors were reproduced within 1%.
The implementation of an individual correction factor improves the precision in dose determination for a batch that otherwise would have a high standard deviation. Since the signals are normalised to their average value and hence equal for all dosimeters in the batch, there is no uncertainty caused by signal dispersion in the case of individual calibration. However, the applied correction factor is associated with an uncertainty that has not been present earlier. This uncertainty is estimated to 0.4 % (the standard deviation of the quotients of the nine pairs of factors determined in Figure 11), which is considerably lower than the uncertainty corresponding to signal dispersion (1%).
0.97 0.98 0.99 1.00 1.01 1.02 1.03 0 1 2 3 4 5 6 7 8 9 10 11 Indi vi dua l c al ibr at io n factor , ci Dosimeter id Readout I Readout II
Figure 11. Individual correction factors calculated after the first irradiation (circles) and after the second (diamonds).
Further developments of the dosimetry system
25
7.3 Optimization of readout process
The original method utilizes five readouts per dosimeter, a number that seemed reasonable from the beginning but have not been systematically investigated. In paper III, the effect of measurement precision as a function of number of readouts per dosimeter (and indirect measurement time) was evaluated. A normal batch contains about 25 dosimeters. When they are read 5 times each, a total measurement time of about 8-9 hours is expected. By reducing the number of readouts to 4, the total measurement time would decrease by 20%, to 6-7 hours, a more realistic time considering also the time needed to start and warm up of the spectrometer. A reduced number of readouts would also make it possible to increase the number of dosimeters in a batch, if a larger experiment is planned. In the experiments described in paper III, a total time limit of 12 hours was set and the dosimeters were read out as many times as possible during that time. The results are shown in Figure 12 (large dosimeters) and in Figure 13 (small dosimeters).
Figure 12. Large dosimeters. The relative standard deviation of EPR signals within a batch as a function of number of readouts per dosimeter. 4102ST resonator was used for the readouts.
Figure 13. Small dosimeters. The relative standard deviation of EPR signals within a batch as a function of number of readouts per dosimeter.
0.00 0.50 1.00 1.50 2.00 2.50 3.00 0 1 2 3 4 5 6 7 8 rel ati ve std ( std /m ea n) (%)
Number of readouts per dosimeter
0.00 0.50 1.00 1.50 2.00 2.50 3.00 0 1 2 3 4 5 6 7 rel ati ve std ( std /m ea n) (%)
Number of read outs per dosimeter
SHQE 4102ST
Further developments of the dosimetry system
26
The largest improvement in relative standard deviation is achieved after two readouts for the large dosimeters. The same is seen for the smaller dosimeters using the 4102ST resonator, but for the SHQE resonator the standard deviation is remarkably constant independent of number of readouts.
7.4 Resonator type
In paper III, the high sensitivity SHQE resonator was evaluated and compared to the standard 4102ST resonator. Figure 14 and Figure 15 show the result of blind tests for the large and small dosimeters evaluated using the two resonators. The dose was determined by the EPR dosimeters and compared to an ion chamber determined dose.
In Figure 14, the best agreement between the EPR and ion chamber determined dose is achieved using the 4102ST resonator. Since the SHQE resonator is designed for optimal sensitivity, it is possible that this resonator is more suited for smaller samples. In Figure 15, the use of the SHQE resonator gives both highest precision and accuracy.
0.88 0.92 0.96 1.00 1.04 0 1 2 3 4 5 6 D EPR /D ic
Number of readouts per dosimeter
SHQE 4102ST 0.96 0.98 1.00 1.02 1.04 0 1 2 3 4 5 6 7 8 DEP R /D ic
Number of read outs per dosimeter
SHQE 4102ST
Figure 14. Blind test using the large dosimeters in the two resonators as a function of number of readouts per dosimeters.
Figure 15. A blind test using the small dosimeters in the two resonators as a function of number of readouts per dosimeters.
Further developments of the dosimetry system
27
7.5 Conclusions
Based on the results and discussions above, recommendations of calibration method, resonator type and number of readouts are listed in Table 3. The number of readouts for both the homogeneity test and the experimental measurements can be further reduced if the measurement precision is not highly prioritized.
Table 3. Summary of the results from paper III.
Parameters Large dosimeters Small dosimeters
Calibration method No individual calibration Individual calibration
Resonator type 4102ST SHQE
Sample fixation method Pedestal Double sample tubes
No. of readouts
homogeneity control 2-3 4
Dosimetry audit
29
8.
DOSIMETRY AUDIT
8.1 Introduction to dosimetry audits
Dosimetry audits are built on the concept of independent dose verification measurements. Many audit systems have their roots in developing quality assurance (QA) programs for clinical trials. The International Atomic Energy Agency and the World Health Organization (IAEA/WHO) have since 1969 performed mailed audits using TLD for high-energy photon beams (Izewska and Andreo, 2000). Participation in an audit program is today often demanded for a clinic to be accepted for inclusion in clinical trials. In an increasing number of countries, participation in an audit programme is mandatory to meet regulatory requirements. The purpose of the audits for clinical trials is to assure a dosimetric accuracy among the participating clinics and to ensure reproducible treatment protocols. Pettersen et al. (Pettersen et al., 2008) showed that dosimetry audits reduces the number of patients required in a trial. The lack of auditing can possible ruin the outcome by blurring a possible significant difference between arms in the trial (Kron et al., 2013).
There is no uniform way of auditing. Kron et al. (Kron et al., 2002) states five areas of uncertainty in dose delivery: 1) absolute dose calibration at the reference point, 2) relative dosimetry (e.g. depth dose, off axis ratio, wedge factors), 3) treatment planning system (TPS), 4) treatment unit variations and 5) patient setup. They also categorizes audits into three levels:
Level I: Output measurements under reference conditions. An independent check of beam calibration under reference conditions in water. 10x10 cm2 field size, 10 cm depth, SSD 100 cm, measurement point in field centre.
Level II: Dose distribution in physical phantoms. Possibility to verify both dose at the reference point and e.g. wedge factors, MLC movement etc.
Level III: Anthropomorphic phantoms, end-to-end test. Verification of all the steps in a radiation treatment chain, from the acquisition of radiotherapy CT images to the treatment setup and delivery of the dose plan.
Dosimetry audit
30
For all three levels, there are almost an infinite number of possibilities regarding phantoms, measurement equipment and measurement methods. The choice of audit level is not obvious and should be considered based on the purpose of the audit and the included clinics. Audits are also expensive to conduct, which sometimes is a limiting factor. A reference dosimetry audit is the base level which should be considered for all operating radiotherapy clinics. An end-to-end test is valuable since it actually tests the whole treatment chain but it could be difficult to evaluate deviating results. One usually separates audits into “on site audits” and “remote audits”. On site audits could be included as a sub-step in a larger clinical audit where a whole radiotherapy department is audited. Remote audits are performed without visiting the clinic. The remote model is the cheaper option and demands fewer workers.
Sweden has today no existing regular dosimetry audit programme. During 2010, a reference dosimetry audit was carried out nationally, conducted through a grant from the Swedish Radiation Safety Authority (SSM) (Knöös and Medin, 2012). Currently, many countries are developing national audit systems. Our group participates in a coordinated research project (CRP) run by the IAEA, for development of an end-to-end system primary to be used by developing countries. The discussions and activities in this CRP is also beneficial for the development of our audit system.
8.2 The lithium formate audit system
Interest in performing end-to-end tests started the development of an audit system that utilized the lithium formate dosimeters. The linear dose response, signal stability and measurement precision make lithium formate suitable for this purpose. It was decided to design a system that could be used on remote basis, the phantom should include heterogeneities to test the TPS ability of calculating doses in such areas. Furthermore, it should be possible to perform both conventional 3D-CRT audits as well as modulated ones, IMRT and VMAT. Measurements should be performed in both a target region and in OARs.
A head and neck phantom of PMMA was constructed with inspiration from Han et al. (Han et al., 2008), see Figure 16. A structure of Teflon (spinal cord) and an air cavity (trachea) was included. Six measurement points were decided, three points in the target region (3, 4 and 5 in Figure 16) and three in OARs (medulla behind the spinal cord (6) and two lateral salivary glands (1 and 2). Each measurement point contains three EPR dosimeters, positioned in PMMA rods inserted in the phantom.
Dosimetry audit
31
The manufacturing process and preparation of dosimeters including the homogeneity control follow the standard procedure (as described in chapter 5). The personnel at the audited clinic should not need to handle the dosimeters, which are placed in their PMMA rods before the package is sent. A second set of solid PMMA rods are used for the CT scan to avoid the extra dose. A flowchart of the audit procedure is shown in Figure 17.
At the audit clinic, the phantom is going through all steps in the treatment chain: CT scanning, contouring, dose planning and radiation treatment. The dose values are extracted from the TPS and the phantom, dosimeters and a TPS dose report is returned for evaluation. The calibration dosimeter group (see Figure 5) is irradiated for calibration after the return. In order to minimize the time between the audit irradiation and the
Figure 16. The audit phantom. The numbers in the CT slice indicates the measurement positions: salivary glands (1, 2), target (3, 4, and 5) and medulla (6).
Dosimeter and phantom preparation
CT scan
EPR readout and analysis Calibration of dosimeters Feedback to audit site Contouring and dose planning Audit irradiation Dose extraction from TPS
LiU Audit site LiU Figure 17. Flowchart of the audit process, the bottom line indicates where the processes occur (LiU = Linköping University).
Dosimetry audit
32
calibration, it is preferable to perform the calibration after the audit irradiation since the dosimeters normally are irradiated a few days before the package is returned. The calibration dosimeters travel together with the package to ensure that all the dosimeters are exposed to the same ambient conditions.
In paper IV, the audit system was used in a pilot study at four clinics in Sweden. A 3D-CRT dose plan was evaluated at all four clinics. At the time of the measurements, two clinics had implemented IMRT and one clinic VMAT. Results of the measurements are shown in Figure 18 and Figure 19.
8.2.1 Acceptance criteria
The acceptance criterion set for dosimetry audits should be tight, making sure that possible errors are found, but not too tight as induction of false negative results must be
-10 -5 0 5 10
Target dx Target sin Target central Medulla Salivary gland dx Salivary gland sin (DEP R -DTP S )/ DTP S (%) Clinic 1 Clinic 2 Clinic 3 Clinic 4 -10 -5 0 5 10
Target dx Target sin Target central Medulla Salivary gland dx Salivary gland sin (DEP R -D TP S )/ DTP S (%) IMRT clinic 4 IMRT clinic 1 VMAT clinic 4
Figure 19. Percentage difference between measured (EPR) and calculated (TPS) absorbed doses in each measurement point.
Figure 18. Percentage difference between measured (EPR) and calculated (TPS) absorbed doses in each measurement point.
Dosimetry audit
33
avoided. The relative combined standard uncertainty of dose to water determined by the EPR dosimeters is 2%-2.5%, depending on the homogeneity in the dosimeter batch. Ahnesjö and Aspradakis (Ahnesjö and Aspradakis, 1999) discuss tolerances for TPS calculated doses and list uncertainties and their estimated magnitudes included in dose calculations. They also include estimates of “future” (now current) uncertainties. With support from their review, the relative standard uncertainty in the TPS dose calculation was estimated to 2%. Combining these figures, the relative uncertainty in the percentage deviation between measured and calculated doses is approximately 3% (k=1). With this uncertainty in mind, the preliminary acceptance criterion was set to 5% for 3D-CRT. The dose calculation, planning and delivery of IMRT and VMAT are more complex and associated with larger uncertainty (Cedric and Grace, 2011), thus, a preliminary acceptance was set to 7% for these measurements.
Acceptance criterion for the OARs is not trivial to set. The dose to these structures are low compared to the PTV dose and a small deviation in absolute dose could induce a large percentage deviation. A discussion of setting different demands on TPS dose calculations for different dose levels and calculation difficulties was discussed by Venselaar et al. (Venselaar et al., 2001). Their discussions could to some extent be translated into audit acceptance criteria. It would be reasonable to set a higher tolerance level for these lower doses, also since it is more difficult to measure dose with high accuracy due to dose gradients normally appearing in these regions. A possibility could also be to specify dose deviations for OARs in terms of percent of the planned PTV dose.
8.3 Discussion
8.3.1 The audit method
Since both the lithium formate system, the phantom and instructions were used for the first time in paper IV, restrictions regarding dose planning (number of fields, wedges etc.) were set to be able to compare the results. This is a limitation for an end-to-end test but was considered necessary for evaluation of the method. For future measurements, the restrictions should be removed and the clinics should use their own protocols to best treat the target.
During the audit pilot study, the phantom handling and irradiations were performed by physicist. It could be discussed whether this should be the case for future measurements, or if the procedures should be handled by the personnel routinely performing the different procedures. There are pros and cons for both alternatives. The physicists are responsible for dosimetry audits, they are used to handle phantoms and are familiar to work with instructions for different phantom measurements. On the other hand, physicists might not be familiar with the clinical routines. As an example, one of the audit measurements performed by physicists was repeated since the couch rails were included in two of the radiation fields during irradiation.
Dosimetry audit
34 8.3.2 Effect of phantom material
In Figure 18 and Figure 19, a tendency of measured results that is lower than calculated ones is seen. Even though most measurement points were within acceptance limits, this is worth investigating as it could imply a systematic error. Fransson and Johnsson (Fransson and Johnsson, 2012) showed that the TPS CT calibration curve (relative electron densities (RED) to Hounsfield units (HU)) affects AAA calculated doses using acrylic plastic phantoms (such as PMMA). The TPS calculated doses were 2-4% higher compared to ion chamber measurements in an acrylic phantom when a patient CT calibration curve was used. They also showed that ion chamber measurements agreed with TPS calculations if a CT calibration curve based on acrylic calibration inserts was used (one that must not be used for patient dose calculation).
As a test, a CT calibration curve derived with acrylic calibration inserts was applied on the PMMA audit phantom. This resulted in reduced calculated doses of approximately 2%, and hence a reduced deviation between calculated and measured doses. For an end-to-end dosimetry audit, it is essential that the CT calibration curve normally used for patients in the particular clinic is also used in the audit since this is part of treatment and one thing that should be tested.
8.4 Conclusions
The lithium formate dosimetry system was found suitable for dosimetry audits. The remote based system and the logistics around it worked properly. It was also found that deviations between doses calculated by the AAA algorithm and measured ones stem from the use of a PMMA phantom together with the clinically used CT calibration curve. A phantom made of a plastic more close to the composition of tissue than PMMA might thus be preferred for future audits.