THE EFFECTS OF PRIVATE INVESTMENT ON GROWTH IN
SUB SAHARAN AFRICAN BETWEEN 1990-2008.
Master’s thesis within Economics
Authors: Tamba Fillie Komeh 720721- 6271
Tutors:
Lars Pettersson
Hyunjo Kim Karlsson
Jönköping: June 2012
i
Master Thesis in Economics
Title: The Effects of Private Investment on growth in Sub Saharan Africa between 1990-2008
Author: Tamba Fillie Komeh
Tutor: Lars Pettersson and and PH.D. Candidate Hyunjo Kim Karlsson Date: June 2012
Subject terms: Sub Saharan Africa (SSA), Developing countries,Growth, Private Investment, Public Investment.
ii
Acknowledgement
I am grateful to many people for their contribution towards the completion of this work. To start with, I am thankful to my supervisors, Lars Pettersson (PhD) and Hyunjoo Kim (PhD) for their pa-tience and guidance during the preparation of this document. I’m indebted to all the lecturers at the department of economics, Jönköping International Business School for the knowledge impacted unto me during the course of this study. My family continues to offer an enduring emotional sup-port filled with love and hope to make this dream a reality. Therefore, I am thankful to my wife Marter Tanjah and Children for their courage and inspiration. I am also grateful to my father, mother, sister and other family members for their continuous prayers and words of comfort. I sin-cerely appreciate the support and courage of my dear friend Reginald Kelechi at the beginning of the study.
Lastly, I am grateful to all those who supported me in diverse ways during this study, but I could not mention their names. Though, I have you at heart and will not forget your kindness.
iii
Abstract
This paper investigates the effects of private investment on growth in sub Saharan Africa between 1990-2008 .The study aims to contribute to the existing literature on private investment. A neo – classical growth model was formulated which consist of the annual real growth rate as the depend-ent variable, public and private investmdepend-ent, labour participation rate, growth of exports and im-ports in real terms are the independent variables. The data is transformed into panel data and re-gressed using the random effects regression model. A unit root test was conducted on the variables using the Fisher-type augmented Dickey-Fuller tests and found that the variables are stationary. The estimation results suggest that private investment largely influence growth in SSA countries than public investment during the period under study. Based on the estimation results, labour has insignificant effects on growth. The study found that imports and exports are essential and have significant effects on growth.
While similar studies suggests that the influence of public investment on growth is larger than pri-vate investments, this study contradicts that concept and supports related studies which suggests that private investment has greater influences on growth than public investment. This result sug-gests that private sector should be a priority in the development strategies of developing countries in SSA. There is a need for policy makers in this region to focus much attention on development policies that geared towards private investment.
iv
Table of Contents
Acknowledgement ... ii
Abstract ... iii
Table of Figures ... vi 2.1 Problem Statement ... 12.2 Purpose of The Study ... 1
2.3 Rationale ... 1
2.4 Structure of the Thesis ... 2
2.1 Infrastructural Development ... 3
2.2 Education ... 4
2.3 Foreign debts ... 4
2.4 Poverty ... 4
2.6 Rate of Growth of Gross Domestic Product ... 9
2.7 Corruption ... 10
2.8 Policy Recommendations by the IMF Chief Economist for ... 13
Developing Countries. ... 13
2.8.1 Fiscal Policy ... 13
2.8.2 Monetary Policy ... 14
2.8.3 Financial Development. ... 14
2.8.4 Foreign Capital ... 15
2.8.5 Property Right Discussion ... 15
2.8.6 Foreign Trade ... 16
2.8.7 Human Capital Development... 16
3.1 The Harrod –Domar Growth Model ... 17
3.1The Neoclassical Growth Model ... 18
3.3 New Growth Model ... 20
3.4 A Model on Investment. ... 21
3. 5 Relationship between Private Investment and the Growth Models ... 23
3.6 Empirical Literature Review ... 24
4.1 Data and Estimation Technique ... 27
4.2 Model Specification ... 28
4.3 Data Estimation Procedure ... 29
v
5.1 Hausman Test Result ... 31 5.2 Unit Root Test Results ... 31 5.3 Table of Summary Statistics ... 32 6.2 What Needs To Be Done for Countries In Sub Saharan Africa In Order To Attract
Foreign Investment? ... 39
References ... 41
vi
Table of Figures
Table 1: Multi-Dimensional Poverty Index (2010) ... 6
Table 2 : Macroeconomic Aggregates for Sub Saharan Africa, 2004 -2012 ... 10
Table 3: Transparency International Corruption perception index 2011 ... 11
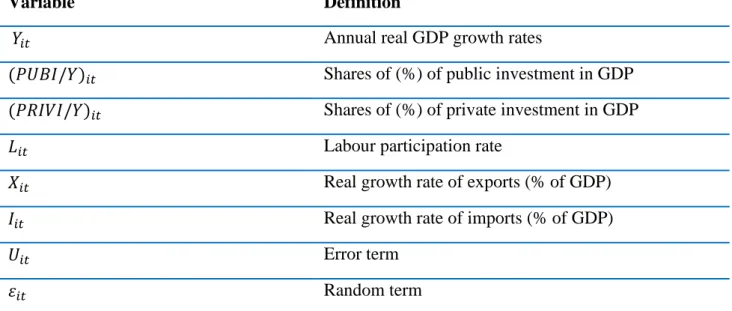
Table 4: Summary Description of Variables in the Regression Model. ... 29
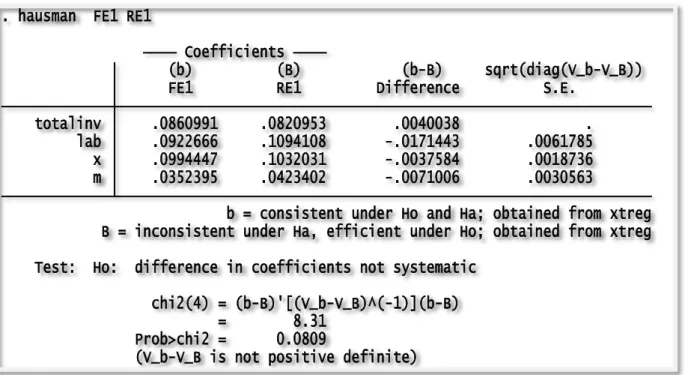
Table 5: Hausman Test Result ... 31
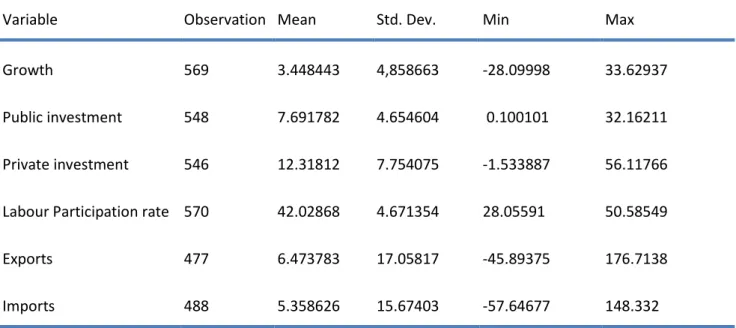
Table 6: Summary Statistics of Regression Variables ... 32
Table 7 : Regression Estimation Results ... 37
1
CHAPTER 1
INTRODUCTION
Since the beginning of human civilization, growth has been acknowledged as the necessary achievement by nations to alleviate poverty and attain a better standard of living for its populace. The Global Social Change Research Project, 2007)
“Growth represents an expansion of a country’s potential GDP or national output. Put differently, growth occurs when a nation’s production possibility frontier (PPF) shift outwards. According to Samu-elsson, an associated perception of growth is the growth rate of output per person. Since it determines the rate at which the country’s living standards are rising. (Samuelson et al. 2010)”. It is an accepted fact that investment in the private sector of an economy can increase productivity, boost exports, create jobs and growth etc. The World Bank (2010) report submits that sub Saharan African region lags behind oth-er regions in human and economic development and it’s consistent with the IMF regional outlook (2010) for sub Saharan Africa and UNDP world development index (2011) report. What this region needs now most is the acceleration of private sector investment that would lead to job creation and sus-tainable growth. Meanwhile, it is important to determine what the effects of private investment on growth have been over the past years. In finding an answer to that question, this study seeks to investi-gate the effects of private investment on growth in Sub Saharan African from 1990-2008.
2.1 Problem Statement
There are on-going discussions in the international community that private investment is the main in-strument that can be used by developing countries to be able to achieve growth, create jobs, increase savings and reduce poverty. The problem is that one cannot completely agree or support the assertions of the international community. There is a need to investigate and establish the facts that private invest-ment had significant or no effects on growth in SSA countries over the past years before one can assume a position on the issue.
2.2
Purpose of The Study
The purpose of this study is to investigate the effects of private investment on growth in Sub Saharan African from 1990-2008.
2.3
Rationale
There are empirical studies undertaken by Khan (1989), Ghali (1998) and Bouton and Sumlinski (2000) to investigate effects of private investment in developing countries. Research samples for these studies were collected mainly from developing countries in Africa, Asia and Latin America. Certainly, these are
2
combination of countries with different political and economic activities background. Moreover, the level of private investment in some of these countries in Asia and Latin America are larger than that of SSA due to infrastructural and technological development. This study will be using a neo classical growth model used by Ghali (1998) to investigate the effects of private investment on growth in devel-oping countries.
What makes this study different from previous ones is that it apparently consists of developing countries from the same region (SSA). They exhibit similarities in political, economic, infrastructure and techno-logical development.
The outcome of this investigation would help policy makers in the formulation of economic policies that could create attractive business environment. Such policies could encourage private investment that would facilitate increases in economic activities for sustainable growth.
This study will enhance the relatively scarce empirical literature on the effects of private investment on growth in this region. Moreover, it will help determine whether private investment has more influence on growth than public investment in SSA countries or the opposite. The result would be important for policy makers in the formulation and implementation of public policies on private investment, which is badly needed for sustainable growth.
The findings would provide information and motivate prospective investors that might want to invest. It would help to agree or disagree with the propositions of some empirical findings that private investment has more influence on growth than public investment. The findings from this study would possibly in-cite further research.
2.4
Structure of the Thesis
The following section presents a background of SSA and will be followed the third section which re-views related literature on the effects of private investment on growth in SSA countries which includes growth model/theories and the empirical literature on public vs. private investment. The fourth section describes how the study will be conducted, outlining the description of data, data and estimation tech-nique, data and estimation procedure and the model specification. The fifth section is about the analysis of data and the interpretation of results. Finally section 6 summarizes the key findings and recommenda-tions for the course of action for the development of the private sector in SSA.
3
Chapter 2
BACKGROUND OF SUB SAHARAN AFRICA
Sub Saharan Africa consists of 48 countries from Africa and some of these countries are within the de-sert (intra Saharan) area. Based on the World Bank report (2011), this region has an estimated popula-tion of 819 million. Sub Saharan Africa have the highest poverty levels among other regions in the world with an estimated population of 300 million people living on less than $1.25 dollar a day in 1990 and this number increased to 388 million in 2005. Over the period 1970 to 2007, growth was attained in every regional economy of the world, even though some economies grew faster and others at a slower pace. Sub Saharan achieved modest growth in the 1980s. This period was therefore referred to as a lost decade in the development process of this region (Ghali 1998). Consequently, structural adjustment pro-grams were designed by the World Bank and International Monetary Fund which included macroeco-nomic stabilization measures to restore confidence in countries in SSA (World Bank 1990a). The United Nations Development Programme multi-dimensional poverty index report (2011) indicates that the re-gion has made modest progress in poverty reduction over the years. The assertion is also confirmed by the IMF regional outlook report on SSA.
Johnson, Ostry and Subramanian (2007) suggest that countries in SSA have achieved considerable im-provement in economic performance due to the macroeconomic stabilization measures that were imple-mented in the 1990s. However, SSA still lags behind other regions in the level of economic and human development (WDI 2010). Major concerns that have deterred this region from catching up with the rest of the world are weak infrastructural development, low level of education, huge foreign debts and a high poverty level, moderate growth and corruption.
2.1 Infrastructural Development
Based on the findings of The International Bank for Reconstruction and Development and The World Bank (2010) on Africa’s Infrastructure edited by Vivien Foster and Cecilia Briceño-Garmendia, weak infrastructural development is the major constraint deterring the expansion of private investment. Key among other infrastructural development is the energy sector. The power sector is paramount for all sec-tors of the economy and its limited supply is holding back the expansion of businesses. The World Bank estimates that power supply is a hindrance for half of firms in half of the region. Most SSA countries power supply cannot generate the required generation capacity, coupled with frequent power cuts. The inadequate power generation is limiting firm productivity by 40%. The lower income countries among this group are the ones most affected.
SSA has not constructed enough roads that match its gigantic size. Its roads are sparsely located and one third of its population residing in the rural areas is within two kilometers from main access roads.
4
The information and communication technologies sectors are much established than the power supply sector. Over the last decade, there has been a steady increase in GSM connections throughout the region. SSA experienced as increase in GSM connections from 5% in 1999 to 57 % in 2006. Within the same period, an estimated 100 million people in Africa became mobile subscribers. It is documented that the negative effect of underprovided infrastructure in SSA is almost at the same level with corrupt practices, crime and financial market constraints.
2.2
Education
This region also lags behind on primary school completion rate. The World Bank African development indicators shows that only 60% of children from SSA completed primary school in 2006, lagging behind by 20 percentage points lower than other regions. (World Development Indicator 2009 and IMF; Re-gional Outlook of SSA 2010)
2.3 Foreign debts
The external debt burden of SSA increased from $172 in billion in 2006 to $195 billion in 2007, which is equivalent to 25% of the region’s gross national income (GNI). The region’s external debt to GNI is 41% percentage points lesser than the level in 2000 and then experienced a decline in the debt service ratio to exports ratio from 12 percent in 2000 to 5 percentage point in 2007.This development was achieved due to numerous factors including the increase in GNI and export revenues, debt relief under the highly indebted poor countries (HIPC) initiative and the multilateral debt relief initiative (MDRI). A total of 29 highly indebted poor countries (HIPCs) in SSA benefitted from the program. The debt can-cellation for (HIPCs) in SSA amounted to $45.5 billion at the end of 2007. In addition, another 20 high-ly indebted countries (HIPCs) in SSA received debt relief by the end of 2007 through the (MDRI). The-se programmes are implemented to reduce the debt burdens of highly indebted poor countries, especially SSA and help create an enabling business environment that attracts investment and to put the region back on the path to economic recovery and growth (World Development Indicator 2009)
2.4 Poverty
overty reduction continues to be serious challenge for developing countries in SSA. The end of pov-erty by Jeffrey Sachs (2005), states that povpov-erty trap is an issue brought about by man and therefore can be solve by man. Richer countries have to increase the amount of aid resources that is contributed to-wards poverty reduction in poor countries.
The table below shows the multidimensional poverty index from the United Nations Development Pro-gramme from 2010 for 30 countries in this study. It also includes the standard of living index and other issues that are used to measure living standards across the world which includes the accessibility to clean water and environmental sanitation
5
The economies of countries in the medium human development group including Gabon, Ghana, Cape Verde and Botswana have performing remarkably well over the last decade. Countries characterize in the class of low development on human development and poverty index and at the bottom are Burundi, Niger and the Democratic Republic of Congo. These countries have faced numerous challenges includ-ing civil war, famine and political unrest and Niger among others continues to be threateninclud-ing by famine William Easterly (2006) “The White Man’s Burden” states that a problem with regards to aid and devel-opment policies from the West to the rest of the world and poverty gap between rich and poor is grow-ing. Therefore, the West should increase and continue to provide aid to only poor countries that have embraced political reforms and are in a democratic process.
Such countries should be practicing good governance, transparency, accountable to their own people, freedom of the press and speech, free markets reforms to attract investments political tolerance. A poor country that makes these reforms should be provided aid.
In addition, poor countries should be allowed to design their own development strategies. Development strategies like the PRSP which IMF and the World Bank are now supporting in developing countries like Sierra Leone. Finally, there should an increase in project support to nongovernmental organizations in agriculture, health and education since it does directly benefit the poor.
6 Table 1: Multi-Dimensional Poverty Index (2010)
United Nations Development Programme Multi-Dimensional Poverty Index 2010
HDI Country Multi-dimensional poverty count Headcount Intensity of Depriva-tion Population vulnerable to poverty Population in severe pov-erty Clean water Improved sanitation Modern fuels PPP $1.25 a day % National pov-erty line % MEDIUM HUMAN DEVELOPMENT
Year Value % Thousands % % % % % % % %
2000-2009 2000_2009 106 Gabon 2000 (D) 0.161 d 35.4 d 437 d 45.5 d 22.4 d 13.2 d 19.4 32.6 26.9 4.8 32.7 118 Botswana .. .. .. .. .. .. .. .. .. .. .. 30.6 133 Cape Verde .. .. .. .. .. .. .. .. .. .. 21.0 26.6 135 Ghana 2008 (D) 0.144 31.2 7,258 46.2 21.6 11.4 12.2 29.9 31.0 30.0 28.5 140 Swaziland 2007 (D) 0.184 41.4 469 44.5 24.4 13.0 24.0 37.8 37.8 62.9 69.2 LOW HUMAN DEVELOPMENT 143 Kenya 2009 (D) 0.229 47.8 18,863 48.0 27.4 19.8 30.8 42.6 47.6 19.7 45.9 150 Cameroon 2004 (D) 0.287 53.3 9,149 53.9 19.3 30.4 32.5 48.5 52.5 9.6 39.9 151 Madagascar 2009 (D) 0.357 66.9 13,463 53.3 17.9 35.4 49.4 66.5 66.9 67.8 68.7 152 Tanzania, United Repub-lic of 2008 (D) 0.367 65.2 27,559 56.3 23.0 43.7 47.3 64.1 65.0 67.9 33.4 155 Senegal 2005 (D) 0.384 66.9 7,273 57.4 11.6 44.4 31.7 51.4 53.2 33.5 50.8 160 Lesotho 2009 (D) 0.156 35.3 759 44.1 26.7 11.1 18.4 31.2 32.8 43.4 56.6 161 Uganda 2006 (D) 0.367 72.3 21,235 50.7 19.4 39.7 60.3 69.1 72.3 28.7 24.5 162 Togo 2006 (M) 0.284 54.3 3,003 52.4 21.6 28.7 33.4 52.9 54.2 38.7 61.7 163 Comoros 2000 (M) 0.408 d 73.9 d 416 d 55.2 d 16.0 d 43.8 d 45.0 72.8 72.3 46.1 44.8 164 Zambia 2007 (D) 0.328 64.2 7,74 51.2 17.2 34.8 49.8 57.4 63.0 64.3 59.3 165 Djibouti 2006 (M) 0.139 29.3 241 47.3 16.1 12.5 6.7 16.3 8.8 18.8 .. 167 Benin 2006 (D) 0.412 71.8 5,652 57.4 13.2 47.2 33.2 69.5 71.3 47.3 39.0
7 168 Gambia 2006 (M) 0.324 60.4 935 53.6 17.6 35.5 20.8 32.1 60.3 34.3 58.0 171 Malawi 2004 (D) 0.381 72.1 8,993 52.8 20.0 40.4 44.0 71.6 72.0 73.9 52.4 173 Zimbabwe 2006 (D) 0.180 39.7 4,974 45.3 24.0 14.8 24.2 31.6 39.0 .. 72.0 174 Ethiopia 2005 (D) 0.562 88.6 65,798 63.5 6.1 72.3 53.8 83.7 88.3 39.0 38.9 175 Mali 2006 (D) 0.558 86.6 11,771 64.4 7.6 68.4 43.7 79.5 86.5 51.4 47.4 176 Guinea-Bissau .. .. .. .. .. .. .. .. .. .. 48.8 64.7 178 Guinea 2005 (D) 0.506 82.5 7,459 61.3 9.3 62.3 37.7 75.6 82.5 43.3 53.0 179 Central Afri-can Republic 2000 (M) 0.512 86.4 3,198 59.3 11.8 55.4 53.6 53.3 86.1 62.8 62.0 181 Burkina Faso 2006 (M) 0.536 82.6 12,078 64.9 8.6 65.8 43.0 69.6 82.4 56.5 46.4 183 Chad 2003 (W) 0.344 62.9 5,758 54.7 28.2 44.1 42.9 58.4 61.3 61.9 55.0 184 Mozambique 2009 (D) 0.512 79.3 18,127 64.6 9.5 60.7 44.1 63.2 78.7 60.0 54.7 185 Burundi 2005 (M) 0.530 84.5 6,127 62.7 12.2 61.9 51.6 63.1 84.3 81.3 66.9 186 Niger 2006 (D) 0.642 92.4 12,437 69.4 4.0 81.8 64.1 89.3 92.3 43.1 59.5 187 Congo, Demo-cratic Republic of the 2007 (D) 0.393 73.2 44,485 53.7 16.1 46.5 55.5 62.0 72.8 59.2 71.3 173 Zimbabwe 2006 (D) 0.180 39.7 4,974 45.3 24.0 14.8 24.2 31.6 39.0 .. 72.0 174 Ethiopia 2005 (D) 0.562 88.6 65,798 63.5 6.1 72.3 53.8 83.7 88.3 39.0 38.9 175 Mali 2006 (D) 0.558 86.6 11,771 64.4 7.6 68.4 43.7 79.5 86.5 51.4 47.4 176 Guinea-Bissau .. .. .. .. .. .. .. .. .. .. 48.8 64.7 178 Guinea 2005 (D) 0.506 82.5 7,459 61.3 9.3 62.3 37.7 75.6 82.5 43.3 53.0 179 Central African Republic 2000 (M) 0.512 86.4 3,198 59.3 11.8 55.4 53.6 53.3 86.1 62.8 62.0 181 Burkina Faso 2006 (M) 0.536 82.6 12,078 64.9 8.6 65.8 43.0 69.6 82.4 56.5 46.4 183 Chad 2003 (W) 0.344 62.9 5,758 54.7 28.2 44.1 42.9 58.4 61.3 61.9 55.0 184 Mozambique 2009 (D) 0.512 79.3 18,127 64.6 9.5 60.7 44.1 63.2 78.7 60.0 54.7 185 Burundi 2005 (M) 0.530 84.5 6,127 62.7 12.2 61.9 51.6 63.1 84.3 81.3 66.9
8 186 Niger 2006 (D) 0.642 92.4 12,437 69.4 4.0 81.8 64.1 89.3 92.3 43.1 59.5 187 Congo, Demo-cratic Republic of the 2007 (D) 0.393 73.2 44,485 53.7 16.1 46.5 55.5 62.0 72.8 59.2 71.3
9
2.6 Rate of Growth of Gross Domestic Product
It is widely acknowledged amongst economists that a rebound in growth for developing countries would help to create jobs, increase savings, and reduce poverty. The IMF SSA regional outlook report (2011) indicates that the region achieved a growth rate of % from 2000 to 2010 com-pared to % from 1980 to 1995. There are positive indications that the region is on track towards economic recovery and development.
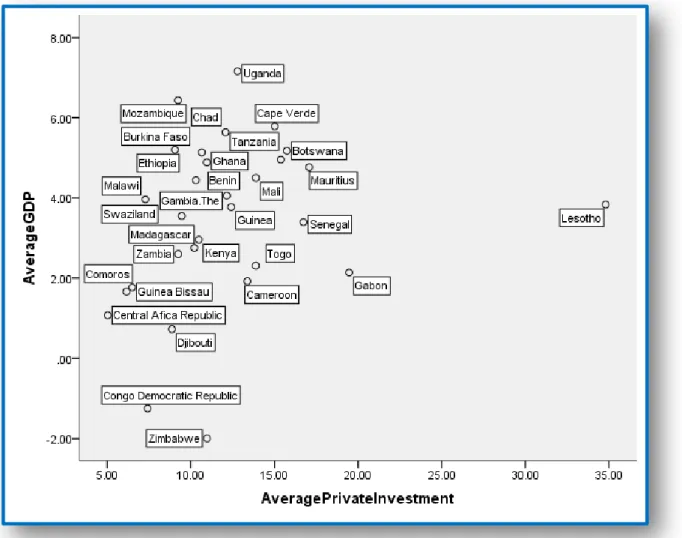
Table 2 below shows the rate of growth percentage of gross domestic product (GDP) in 30 coun-tries from SSA from the period 1990 to 2008. There is a missing value for Djibouti for the year1990.
The table shows that in the early 1990s, countries including Democratic Republic of Congo, Zam-bia, Central African Republic, Togo, Cameroon and Djibouti experienced a negative rate of growth in their GDP. The dropped in the rate of growth for some of these countries can be at-tributed to civil war, political instability and inappropriate microeconomic policies. Congo Demo-cratic Republic had a prolonged civil war that seriously incapacitated the growth of the economy. As the economy struggled to cope with the challenges it faced, there was also high inflation which still continues as the country recovers. The world saw a similar problem in Zimbabwe in early 21st century. There was a higher inflation in this country that brought the country’s economy to its knees. Investors lost confidence in the economy, businesses closed down and we saw a mass exo-dus of Zimbabweans to other African countries as economic refugees.
A majority of countries in the table managed to grow at an average growth rate of 4.5% overall during the period 1990-2008. The weak economic performance of these countries can be attributed to the unsteady growth pattern they experienced; with fluctuations in the rate of growth as can be noticed from the table above. However, the economies of some these countries have been making positive economic gains over the years, despite the economic down turn in 2008 that originated from the United States, World Bank (2011). Some of these countries including Benin, Botswana, Cape Verde, Ethiopia, Kenya, Lesotho, Mauritius, Uganda, Tanzania, and The Gambia and Ghana etc.
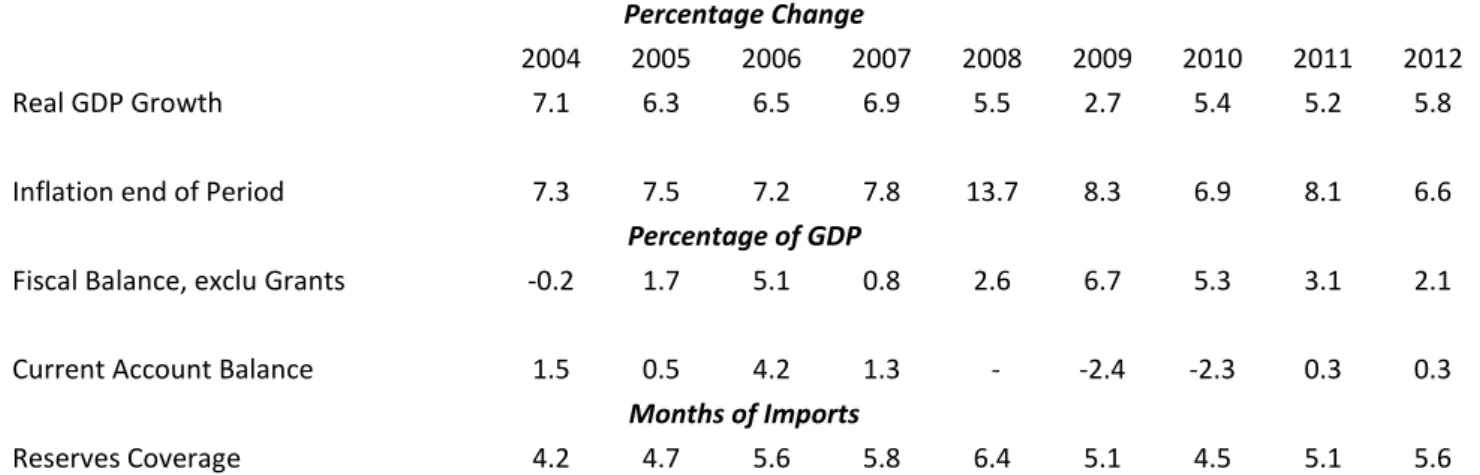
The Regional outlook on Sub Saharan Africa 2011 suggests that modest gains have been achieved by the region over the past decade. The table below shows the macroeconomic aggregates from 2004 to 2012
10
Table 2 : Macroeconomic Aggregates for Sub Saharan Africa, 2004 -2012
Percentage Change
2004 2005 2006 2007 2008 2009 2010 2011 2012
Real GDP Growth 7.1 6.3 6.5 6.9 5.5 2.7 5.4 5.2 5.8
Inflation end of Period 7.3 7.5 7.2 7.8 13.7 8.3 6.9 8.1 6.6
Percentage of GDP
Fiscal Balance, exclu Grants -0.2 1.7 5.1 0.8 2.6 6.7 5.3 3.1 2.1
Current Account Balance 1.5 0.5 4.2 1.3 - -2.4 -2.3 0.3 0.3
Months of Imports
Reserves Coverage 4.2 4.7 5.6 5.8 6.4 5.1 4.5 5.1 5.6
Source: IMF, Sub Saharan Africa Regional Economic Outlook April 2008
Table shows a percentage change in the rate of growth achieved by SSA from 2004 to 2008. The achieved a modest growth from 2004 to 2008 by 6.5 percentage point .There was a rebound in 2009 with a growth rate of 2.7% This figure doubled itself in 2010 to 5.4 and a slight drop by 0.2% in 2011. Although the drop by 0.2 % in 2011, there are positive indicators that growth rate in the region is stronger in 2012 and up to 5.8%.
Inflation is another cause for the weak performance of the economy of SSA. Based on the table above one can conclude that inflation was much higher in 2009 and 2011.The table show a change from 6.9% in 2010 to 9.4% in 2011percent of GDP, indicating a percent change of 2.5%. The fiscal balance, excluding grants are all negative except for 2004 to 08.This explains that the government revenues do not match expenditures. Hence, the region needs budgetary assistance in the form of grants to compensate for the budgetary gap. The region’s current account balance for 2009 and 2012 are negative and positive for 2004/ 2008 and 2011. The commodities that are exported from SSA are mainly unfinished products since its manufacturing sector is underdeveloped and therefore, its im-ports more commodities than exim-ports.
2.7 Corruption
Corrupt practices in public sectors are one of the major factors responsible for backwardness for countries in SSA. It can affect service delivery in the health, education, agriculture and infrastructural development sectors. Transparency International (2010) conducted surveys and assessment in coun-tries through the administering of questionnaires to the public by asking questions relating to the bribery of public officials, kickbacks in public procurement, embezzlement of public funds, and questions that probe the strength and effectiveness of public-sector anti-corruption efforts. The scores are given over 10. Countries with higher score show a lower level of corruption and countries with
11
lower score indicates higher level of corruption. Corruption in public sectors of SSA countries is one of the underlying factors for its underdevelopment. Corruption in the public sector affects service de-livery in all sectors of government including health, education, agriculture, and infrastructural devel-opment etc. In recent years, governments of SSA countries have taken bold steps to combat corrup-tion, by creating anti-corruption commissions. In addicorrup-tion, majority of SSA countries have introduced governance reform activities in order to minimize or eradicate corruption in the public sector. Cor-ruption in a country affects investment in both the public and private sectors of an economy. Public officials in a corrupt system create longer than usual business application processing times waiting to be bribe. In addition, frequent visits to private business owners, unnecessary demands documents. The table above shows the Transparency International perceptions index report 2011 for SSA coun-tries in this study, showing the rank and score in the overall world corruption perceptions index. Table 3: Transparency International Corruption perception index 2011
Corruption Perception Index 2011 Ranked 10-0
Rank Country Name Score
32 Botswana 6.1 41 Cape Verde 5.5 46 Mauritius 5.1 69 Ghana 3.9 77 Gambia 3.5 77 Lesotho 3.5 91 Zambia 3.2 95 Swaziland 3.1 100 Benin 3.0 100 Burkina Faso 3.0 100 Djibouti 3.0 100 Gabon 3.0 100 Tanzania 3.0 100 Madagascar 3.0 100 Malawi 3.0 112 Senegal 2.9 118 Mali 2.8 120 Ethiopia 2.7 120 Mozambique 2.7
12
134 Cameroon 2.5
143 Comoros 2.4
143 Togo 2.4
143 Uganda 2.4
154 Central African Republic 2.2
154 Guinea Bissau 2.2
154 Kenya 2.2
154 Zimbabwe 2.2
164 Guinea 2.1
168 Chad 2.0
168 Democratic Republic of Congo 2.0 Source: Transparency International 2011.
13
Although there are positive signs of growth and economic recovery in SSA, they are not strong enough to produce significant effects on the reduction of the current level of poverty. Much higher growth rates are needed for poverty reduction and for the region to attain the millennium develop-ment goals by 2015. What is needed most to achieve these goals in an acceleration of private sector investment.
2.8 Policy Recommendations by the IMF Chief Economist for
Developing Countries.
An important question that continues to linger in the minds of economists and the international community, for which various answers have been provided, is whether countries in SSA can achieve growth.
The World Bank Chief Economist Justin Yifu Lin in his New Structural Economics (2011) present-ed an article titlpresent-ed “A Framework for Rethinking Development Policy”. According to this paper, there are prospects for all developing countries including countries from SSA to grow at a rate of 8% continuously over a longer period which will considerably reduce poverty. Moreover, they will be able achieve a middle income level or even become a high income country over the period of one or two generations. This depends on governments in developing countries to adopt and implement the right economic policy framework that will facilitate the development of the private sector in the line of comparative cost advantages.
The chief economist attempts to presents the views of the new structural economics under rethink-ing development policy in developrethink-ing countries such as countries in SSA. The key areas of policy insights in the framework of rethinking development policy are; fiscal policy, monetary policy, fi-nancial development, foreign capital, trade policy and human development.
2.8.1 Fiscal Policy
In accordance with the new structural economics, there are disparities among developed and devel-oping countries on the effects of fiscal policy due to dissimilarities of opportunities in using recur-rent expenditures to boost productivity and augment investment. Serious policy considerations should be attached to infrastructural development in developing countries since it’s a binding con-straint and therefore essential for growth and economic development. The new structural economics argues that government should take advantage during the period of recessions and invest in the de-velopment of infrastructure since such investments boost short term demand and promote long term growth. Secondly, the investment cost can be cheaper than normal times.
14
It can help to escape the Ricardian equivalence trap since an increase in the rate of growth and fis-cal revenues can reimburse the actual cost of these investments in the future. This type of public vestment can boost the economy’s growth potential, ease transaction costs on the private sector, in-crease the rate of return on private investment, and generate maximum tax revenues in the future that can offset the initial costs.
In SSA countries where there is natural resource abundance, the new structural economics recom-mends that a substantial percentage of revenues accumulated from the sale of natural resources be used to invest in human capital, infrastructure, social capital, and to provide for resettlement in are-as that are non-resourceful to the new settlers in order to facilitate structural transformation. These type of fiscal policy will can provide jobs, growth and poverty reduction. Fiscal policy should be geared towards the use of a substantial amount of natural resource revenues to finance critical structural projects that relates directly to economic development. The public should invest in infra-structural projects that stimulate the establishment of new manufacturing industries expand the economy and create jobs.
2.8.2 Monetary Policy
The new structural economics predict the prospect of utilizing interest rate policy in developing countries as a counter-cyclical tool and as a mechanism to encourage infrastructure and promote in-dustrial investments during recessions. These types of policy measures might contribute to produc-tivity and growth. In most cases, monetary policy cannot be an effective policy tool for stimulating investment and consumption during the period of recessions and excess capacity situations in de-veloped countries. More so, when nominal interest rates approaches zero due to limited returns on investment opportunities. The negative expectations on investment results to high unemployment rates, less confidence about the future and the possibility of liquidity traps. However, it should be noted that developing countries have lesser chances to bump into such liquidity traps. In such sce-narios, domestic industries can be face with excess capacity; meanwhile, their potential for industri-al improvement and modification is great. During recessions when interest rates can be low, firms have the incentive to expand productivity and investment. Low interest rate can also attract invest-ment in the public sector.
2.8.3 Financial Development.
Majority of economist do agree that financial development is crucial for a sustainable growth. Capi-tal accumulation is a binding constraint for a majority of developing countries in SSA. There is fi-nancial suppression in developing countries aim at protecting non-viable firms in the priority sec-tors. The new structural economics argues that in such situations, liberalization policies in domestic finance and foreign trade should be undertaken in an orderly manner so as to achieve stability
15
and growth at the same time during a transition period. The new structural economics argues that the ideal financial structure at certain stages in developing countries should be determined by the principal industrial structure. These includes the normal size of firms, the type of risk that confronts them, endogenous factors in the economy’ endowment existing at that level. The financial systems in low developing countries like SSA should be provided by local banks rather than admire large banks from advanced industrialised countries. Such policies will favour small firms in the agricul-ture and other sectors of the economy to access adequate financial services.
2.8.4 Foreign Capital
The insignificant inflow of foreign capital into developing countries especially in SSA is partly re-sponsible for the slow rate of growth. The new structural economics method favours foreign direct investment over other sources of foreign capital inflow. This is because foreign direct investment is directed at industries that are considered to be reliable with that country’s comparative cost ad-vantage. Such investment cannot be easily withdrawn during volatile, panics or problems of finan-cial crisis like the one experienced in 2008. Direct foreign investment in a country brings technolo-gy, new management skills, and access to markets and social interactions that are often limited in developing countries like SSA. Developing countries should therefore adopt liberalisation policies that encourage inward direct investment as a comprehensive development strategy. Another im-portant concern of the new structural economics is the flow of capital from the scarce developing countries to developed countries with abundance capital. It can emanate from the accumulation of capital in developing countries with low infrastructural development and cannot improve its indus-tries. The capital might face diminishing returns in developing countries and this explains the rea-son for the out flow of capital to developed capital abundance countries.
2.8.5 Property Right Discussion
Camilla Toulmin (2007) reported that among other factors affecting private investment in SSA is property rights. Property right in this region is mainly centred on land ownership. In most pat of the region, land has no registration of who owns it or has rights to use it. Over the years, numerous new initiatives are underway to address this, in the belief that land registration and titling can promote private investment, reduce poverty and inspire better natural-resource management.
The right to land in SSA starts from various different sources, such as earlier settlement, claim by
conquest, through distribution by government and long occupation or market transaction. In some cases in most part of the SSA, these rights are transferable to heirs or can be sold; in others, consent must be sought from the underlying rights-holder or holders.
A typical example is the West African region as a whole, where only about 2 to 3 per cent of land is held by written title, this process is largely restrained to a few major cities and development areas,
regulat-16
ing and administering land rights, due to their significance to the economy, people’s livelihoods and employment, and the stability of the nation.
In SSA, governments controls the economy and owns the almost all of the infrastructures that pro-vide essential services including power supply, water supply, health, education, roads construction and the postal services etc. The private sector has always controlled manufacturing sector which is characterized has weak and lacks the competitive power to compete in the international market. In addition, the private sector has also controlled the mining sectors due to its capital intensiveness and recently, taking over the communication sector. This has resulted in the uninterrupted increase of
mobile phone subscribers in the entire region.
2.8.6 Foreign Trade
Exports and imports of goods and services are the essential components of foreign trade and there-fore endogenous to the comparative advantage controlled by resource structure of developing coun-tries. Developing countries are advice to embraced globalization and exploit the available opportu-nities by liberalizing trade to achieve a faster rate of modernisation and structural change. Reducing trade barriers or free trade is important for developing countries since it serves as means for conver-gence. However, the new structural economics identifies that a majority of developing countries ex-perienced biases based on the old structural economics which argues for import substitution. There-fore, whilst considering trade liberalization in the transition period, developing countries should en-gage in that process on a gradual base. Thereby enhancing and providing protection for firms that are not ready to compete in the country’s comparative advantage, and at the same time providing opportunities for firms that are ready for competition in the globalized markets.
2.8.7 Human Capital Development
Human capital development is a fundamental factor for growth in both developed and developing countries. Over the last decade, a majority of developing countries including those from SSA are experiencing signs of growth and economic development, World Bank (2011). These signs of eco-nomic development come with the need for human and physical capital development that will be commensurate to that country’s investment needs. It is important that governments in developing countries plan ahead in order to provide the level of human capital that necessary in the innovation process. Human capital development should therefore be an integral part of the development strate-gy of countries in SSA. Human capital development can increases the ability of workers to deal with unforeseen circumstances and uncertainties in the process of innovation.
The chief economist argues that developing countries such as countries in SSA needs to structure their development policies based on the once recommended by the new structural economics. By doing so, they could attract foreign investment and be able to achieve long term growth.
17
CHAPTER 3
THEORITICAL FRAMEWORK OF GROWTH
The problem statement of this study is to investigate the effects of private investment on growth in SSA countries and determine the extent at which it influenced growth over the period under study. Economists believe growth is instrumental for human development. Hence, it has been the main fo-cal point for economic debate globally. It is assumed amongst policy makers that in the absence of growth, economies could fail to provide for their citizens and the consequences could be devastat-ing. A typical case of an economy that is facing this kind of situation and in dire need for bailout is Greece. Many economists and financial institutions have established that the antidote for sustaina-ble growth and development for developing countries like SSA is private investment.
Khan and Kumar (1997) and Rati Ram (1996) undertook empirical studies on public and private in-vestment across developing countries to determine the extent at which they influence growth. Re-sults from these empirical studies suggest that private investment is more productive than public in-vestment and largely influences growth in the long term.
This section briefly reviews the relevant literature which is based on the concept of growth, theoret-ical models, and the empirtheoret-ical literature review on the effects of private and public investment on growth in SSA countries
3.1 The Harrod –Domar Growth Model
The Harrod–Domar growth model is based on the Keynesian growth theory developed by Harrod (1939) and Domar (1946). The basic idea behind the development of this growth model is to ex-plain an economy’s growth rate in terms of the level of savings and the productivity of capital. The fundamental assumption of this model is that there are fixed proportions in the combination of capi-tal and labour. The Harrod –Domar theory focuses on the function of money, the principles of effec-tive demand and the savings function. The theory analyses the conversion of savings to investment and its multiplication effects. Harrod (1939) studied the accelerator effect, while Domar focused on the multiplication effect. Harrod and Domar used different approaches to analyse the rate of output growth. Despite different approaches, both of them came to the same conclusion that the rate of growth of output is determined by national savings ratio and the national capital output ratio. The two growth models formulated by these gentlemen are joint models and therefore treated as one in all growth literatures and appear as the Harrod-Domar growth model.
This model assumes that output and capital are proportional or related to each other and therefore, the two variables thus generate equal growth rates. The savings rate multiplied by the marginal
18
product of capital, and less the depreciation rate results to the growth rate. Therefore, increasing the savings rate, increasing the marginal product of capital and decreasing the depreciation rate will in-crease the growth rate of output.
Development economists use the Harrod-Domar model to estimate the financial gap of developing countries. The model claims that growth will be proportional to the rate of investment; meaning that growth is equal to investment divided by the ICOR. The financing gap in this case becomes the gap between the existing financing for investment and the needed investment. This theory is applicable in an economy where a target growth has been set.
A major the criticism of this model is that it economic system has no in-built equilibrating force mechanism used to establish equilibrium in an economy. Private investment and the growth models are all related in the sense that they all provide answers about growth. Private investment is im-portant since it determines output expansion in an economy which brings about growth.
3.1The Neoclassical Growth Model
The neoclassical growth model was developed in the 1950s and 1960s and is based on the classical growth theory developed before Keynes and his followers. A renowned neoclassical growth model is the Solow-Swan growth model (1956), developed as an alternative to the Harrod-Domar growth model. The Solow-Swan model is the bases for all analyses of growth and other models can be best understood by comparing to that of the Solow growth model.
This neoclassical growth model uses four variables from the Cobb Douglas production function to describe the economy: output , capital and knowledge or the effectiveness of la-bour . The variables capital, lala-bour and knowledge are combined to produce output at any one time.
The production function is written as:
)………. (1)
Where t in the function denotes time that only enter through K, L and A. This means that output changes over time when production inputs changes. The model also implies that technological pro-gress only takes place with an increase in knowledge. The long term expansion of these productive inputs and the rise in labour or employment can lead to growth without constraints. The Solow model indicates exactly how changes occur in an economy over time as its approaches the steady state.
The model also explains how capital stock accumulates over time and hence determines the long-term equilibrium in an economy. It also shows the characteristics of savings, population growth, and technology in the long-run in an economy.
19
According to the Solow model, the savings rate determines the level of output per worker and capi-tal stock in a steady state. The higher the savings rate, the higher the level of output per worker and capital stock. Population growth in this model has a negative impact on capital stock accumulation. An increase in the population growth rate decreases the level of output per worker in the steady state.
One of the main assumptions of the Solow model is that if national saving rate rises, growth will al-so temporarily rise above its long-run rate as the economy shifts to its new equilibrium. Meanwhile, the long-run equilibrium growth is not linked to savings rate and population growth rate. In an eco-nomic system wherein all countries have the same opportunity to use the same technology, then every country should have the same growth rate in a steady state in the long run. Increases in the in-vestment rate of a country would lead to higher than normal growth as the economy adjust to its new growth part.
Convergence is another issue discussed by the Solow model. Assuming two countries have similar population growth, savings rate and utilizes the same production function, the Solow-Swan growth model predicts that they will produce the same level of output. This theory implies that small coun-tries are bound to produce less than big councoun-tries because they hold less capital.
Dornbusch and Fischer (1994) wrote that if countries have separate savings rate, they can attain separate output levels in a steady state. Assuming their technological progress rate and population growth rate are the same, their output growth rates will be the identical in steady state.
Population growth has a negative impact on capital accumulation. The higher the population growth rate, the lower the level of steady state.
The Ramsey-Cass-Koopmans growth model is also an essential neoclassical growth model that was developed before the Solow-Swan model. The Ramsey growth model was developed in 1928 before the Solow-Swan model. However, in macroeconomics literature the Solow-Swan model is the bases for the analysis of growth and as such the Ramsey-Cass-Koopmans growth model is an extension of the Solow model introduced after the Solow Model. The main assumption of the Ramsey model is that households optimize their utility over time. Cass and Koopmans (1965) unlike Solow-Swan model treated savings rate as endogenous. In this model, households are hired by firms and they re-ceive wages in return for the labour supply. Households divide their income into consumption and savings and their savings is hired by firms to produce output. Therefore, firms in the Ramsey Koopmans model are owned by households. Although the Cass and Koopmans brought slight changes to the neoclassical growth model, it maintained the assumption of the long-run growth rate on exogenous technological progress (Suma 2007).
The connection between Ramsey Koopmans model and private investment is that the amounts in-vested by firms are important determinants of the growth and productivity of an economy.
20
These investments and the production of outputs come from labour supply and savings of house-holds. Output is produced using capital and labour based on the Cobb Douglas production function. The production function is increasing and concave in both capital (K) and labour (L) and it exhibits a constant returns to scale. It implies that to increase output, firms need to increase the amounts in-vested in order to double both inputs in the production process.
The neoclassical growth model is insightful and credible in explaining growth. However, it fails to explain the possible determinants of technological change since the model distance itself of the de-cisions of economic agents. Another problem with the neoclassical growth model is that it cannot account for the huge difference in residuals across countries using the same technologies. The need to tackle these issues saw the emergence of the new growth model.
3.3 New Growth Model
In Romer (2006), we are informed that the growth models we have discussed had their shortcom-ings since they could not offer accurate explanations on the central questions about growth. Conse-quently, a study was conducted to investigate the fundamental questions associated with long term growth. The investigation prompted the introduction of the new growth model that treats the effec-tiveness of labour as endogenous and this similarly applies to technological progress.
The neoclassical growth model and the new growth model carry identical features, although they differ significantly in their key assumptions. The main differences between them are:
(1) The new growth model removes the diminishing marginal returns to capital assumed by the neoclassical growth model.
(2) The new growth model foresees increasing returns to scale in aggregate production.
(3) Thirdly, the model accepts the function of externalities in determining the rate of return on capital.
The ideas of the new growth model first gain cognizance in Romer,s work on “Increasing Returns and Long-Run Growth” in 1986 and later appeared in the work of Lucas (1988) “Mechanics of Economic Development”.
Romer and Lucas focus on the notion of measuring capital which is divided into physical and hu-man capital. Their assertion is that a gain from capital which comprises the physical and huhu-man as-pect does not represent a decreasing trend. Rather, factors associated with growth exhibit positive externalities from human capital and the transfer knowledge.
The new growth model is the end of all growth models and has made significant contributions in answering the central question about growth.
The research and development and imperfect competition are important part of the new growth model. Basically, economist including P.Romer (1990), Gross and Helpman (1991) and Aghion and Howitt (1992) have made significant contribu- tions on research and development. The
treat-21
ment of technological progress in the new growth model is not just about the addition of inputs to the production function. Rather it is about the distinction among new ideas, knowledge or innova-tions and other inputs to the production function which the model identifies. Individuals in a pro-duction process will always try to invent new ideas to improve on the propro-duction of goods. A typi-cal example cited by Arrow (1962) is that the designing of a frame of a new model aircraft sumes more time. However, production of that model of aircraft will more than double in the con-tinuous production process due to improvement in productivity without innovation. The accumula-tion of knowledge in this type of process is learning by doing which eventually leads to technologi-cal progress through a conventional economic activity.
Investment undertaken by a firm in an economy whether its physical or human investment can lead to an increase in productivity which exceeds private gain. It implies that increase in the physical or human investment rate as a whole can bring about a sustainable growth. Assuming there exist a strong external economies created through investment.
In Suma (2007), the new growth theory offers a substitute to diminishing returns on growth. The endogenous growth model can be used to explain the abnormal international flow of capital to rich countries and thus accounts for the income disparities between developed and developing countries. Furthermore, developing countries should experience a greater return on investment due to the law of diminishing returns. Nonetheless, the low levels of investment in infrastructural development, human capital and research and development as affected returns on investment in developing coun-tries. The endogenous growth model proposes the involvement of governments to promote sustain-able economic development through direct and indirect investment in human capital development and encourage private investment.
3.4 A Model on Investment.
According to Romer (2006), investment is significant to growth since it’s comprises of society’s re-sources that are divided between consumption and investment. The investment components include physical capital, human capital and the resources allocated to research and development. There are two parties associated to investment. The first group includes firms with investment demand and the second group compromises of individual household savings supply. The individual savings supply determines to what extent the society’s output is invested. Hence, investment demand plays a signif-icant role in determining the pattern of standard of living in the long- run.
The neoclassical theory is one of the expectations theories of investment that argues for the signifi-cance of the neo classical cost of capital as a means by which we can determine the level of firm’s investment
22
The neoclassical theory combines the accelerator model of investment and this makes investment a function of output and lagged capital stock. The accelerator model varies from the neoclassical the-ory of investment. The latter makes investment dependent on product price and more so, on the firm detailed cost of capital (Mueller 2003).
Tobin in relation to growth provides explanations about firms’ investment decisions and expecta-tions in a model known as Tobin’s q. The main idea behind q theory is that firms expect amend-ments in their capital stock. As such it provides a valuable tool for studying the issues that affect in-vestment.
The equation below shows that firms would invest to the point where acquiring a unit of capital is equal to the purchase price. Where investment at time t is, is the cost of adjustment of capital and the ratio of the market value to the replacement cost of capital at time t.
( ) ………. (4)
One of the variables derived in this monetary theory is marginal , which represent the marginal unit of capital to its replacement cost. Tobin’s provides the necessary information that determines firm’s investment decision and indicates how an extra dollar affects firm’s profits. The value of To-bin’s determines whether firms should invest or disinvest. Hence, firms would want to invest if increases and a decrease if the value of falls.
Moreover, growth in the value of firm’s capital stock leads to an increase in firm’s profit by and in turn increases the value of the firm by . Consequently, is the market value of the firm and in a market where shares are sold, the value of one firm exceeds other firms by .
Mueller (2003), “the corporation: investment mergers and growth” also discusses the q-theory of investment. Based on this book, the motive of today’s investment is for tomorrow’s output. Firms with larger amount of output today are bound to produce larger amount of output tomorrow. It im-plies that firms with a low level of output today will produce the same level of output in the near fu-ture. The book affirms the importance of q theory by stating that most economic theories that use the market value of firms to provide detailed information about investment does so using q theory. The production function is linear homogenous and Cobb-Douglas in the form:
……… (5)
……… (6)
Where
M represents the market value of the firm K is the replacement cost of its capital
23
In this model, capital and labour are the only factors of production, in which the market value of the firm is payments to its capital. Based on this book, the q-theory of investment combines the funda-mental assumptions and conditions of the neo-classical model. The two models assumed that dispar-ities in q across firms reproduce the same dispardispar-ities in the desired capital stock comparatively to the actual capital stocks. Therefore, these assumptions provides an explanation for the differences in firms investment and the bases upon which we can measure the cost of capital for individual firms. The neoclassical and the q theory present positive assumptions in relation to capital markets and its consequences on investment decision.
Abel, et al. (1982) developed a marginal q model of investment with adjustment costs. This model assumed the adjustment cost to be internal. The basic ideology of this model is that firms have to incur cost of adjusting in their capital stock. The adjustment costs constitute a u-shaped function of the rate of change of the firm’s capital stocks. The model implies that it difficult for firms to in-crease or dein-crease their capital stock due to the huge adjustment cost involve. Moreover, the size of the adjustment leads to an increase in the marginal adjustment cost. This model assumes that the procurement price of capital goods is fixed and equal to 1; depreciation is believed to be 0. The pre-sent value of the firm’s profit is maximized using the equation below.
Ε (π ∫ -rt [ ( ) ( )] where
K is the industries wide capital stock; I is the firm’s investment;
C is the cost of adjustment.
3. 5 Relationship between Private Investment and the Growth Models
The relationship between the growth models and private investment is that they all attempts to pro-vide answers to the central question about growth. The Harrod-Domar and the neo-classical growth models are primarily concerned with output expansion or productivity in an economy. Romer (1986), new growth model treats technological progress as endogenous and that private investment contributes significantly towards the increase in the level of technology for the entire economy. The levels of investment by firms are important determinants of the growth and productivity of an econ-omy. Private investment necessitates the creation of a production function that allows increasing in returns to scale and it accelerates growth. Meanwhile, the new growth model is largely concern with human capital development and research and development. Lucas (1988), states that investment in human capital development has a positive impact that brings about sustained growth. Private in-vestment offers a connection between technolo- gy and growth.24
3.6 Empirical Literature Review
Although theoretical growth models make no distinction between public and private, (Solow growth model 1956), quite significant empirical studies of investment have attempted to do so. Distinguish-ing between private and public investment and determine their specific effects on growth usDistinguish-ing a variety of explanatory variables. A significant number of these empirical studies agreeably suggest that private and public investments are complementary to each other and both important for growth. However, some of the empirical studies agree that private investment has more influence on growth in the long run. In this section, some of these empirical studies on private versus public investment are reviewed.
Bouton and Sumlinski (2000) undertook a research to investigate the distinctive effects of public and private investment on growth in 50 developing countries. This study attempted to separate in-vestment into public and private in order to ascertain their distinctive effect on growth. The study accepts that public and private investment have distinctive relationships with growth. They found empirical evidence to support theoretical hypothesis that the level of private investment in an econ-omy is crucial for private sector development, since it determines the measure of technological pro-gress in an economy. Moreover, greater shares of private investment in a competitive economy re-sult to a positive physical capital accumulation. The increase in physical capital accumulation en-courages newer technologies which increases the productivity of capital and hence influence growth in the long run.
Khan and Kumar (1997) undertook an empirical study of 95 developing countries on the effects of public and private investment on growth across the period of 1970-1990. The paper stated that the sample of developing countries used in public and private investment study was the largest and ac-counted for more than 90% of GDP of developing countries in the late 1980s. The study investigat-ed the regional effects of private and public investment in developing countries from Africa, Asia, Europe, Middle East and Latin America. Other factors including human capital formation, popula-tion growth, macroeconomic instability, and trade were considered to be important determinants of per capita growth.
The analysis from this study revealed a significant disparity on the impact of public and private in-vestment on growth, with private inin-vestment exhibiting greater impact on growth. The study also shows that private investment has a higher rate of return and increasing over time. Conclusions from the study show dissimilarity in the effect of public and private investment on growth and their specific rates of return. The result clearly shows that the effects of private investment on growth is larger than public investment in Latin America and Asia and less pronounced for Africa, Europe and Middle East country groupings.
25
Calamistsis, Basu and Ghura (1999), undertook a study to investigate “adjustment and growth in sub Saharan Africa”. Their main objective was to investigate the impact of adjustment on growth, using an expanded growth model designed by Mankiw, Romer, and Weil (1992). The study was conducted for 32 sub Saharan Africa countries over the period 1981 to 1997 with special focus on 1995 to 1997. The variables that were included in their research model for analysis included private and public investment, human capital accumulation and macroeconomic policies since it also affect economic performance. One of the variables the study found to have significant influence on growth is private investment. The study therefore recommended that the level of private invest-ment in developing countries should be double in the coming years in order to achieve a more dy-namic and sustainable growth and reduce poverty in poor countries. To achieve this, policy makers need to create an enabling and attractive business environment for private investment. There should be an enabling business environment that allows basic property rights, contracts enforcement, an ef-ficient justice system, perfect competition and the development of the infrastructure. Moreover, the study shows that investment in human capital development is paramount for growth.
Ram Rati (1994) carried out a study into the relative productivity of public and private investment in developing countries. His source of data on aggregate public and private investment for 46 de-veloping countries came from the previous study done by Miller and Sumlinski (1994). Data esti-mation was prepared for 41 countries over the period ranging from 1973-1980. In addition, the study also covered the period from 1980-1990, and separate estimations were done for sub- periods from 1980-1985 and 1985-1990. Econometric results from this study revealed great disparity be-tween the study period 1970 and 1980. For the 1970s, private investment appears to be relatively productivity than public investment supporting the empirical findings of Khan and Reinhart (1997). On the contrary, public investment was more productivity in the 1980s than private investment. Ac-cording to the study, it implied that public resources were invested in productive activities of the economy and a slowdown of balancing inputs for the private investment. The study advised re-searchers to be cautious in claiming that private investment is more productive than public invest-ment.
Ghali (1998) conducted a research on Tunisia using Johansen (1988, 1992) and Johansen and Juse-lius (1990) multivariate co- integration techniques and in which a vector error-correction model of growth was developed to study the temporal causal dynamics between the private and public in-vestment. The study period range from 1963-1993 using real GDP, real private investment and real government investment in the estimation. The Gali study found a negative reaction on private in-vestment whenever there is change in public in- vestment with two time intervals. It Implied that
26
investment in the public sector of the economy had a crowding –out effect on private investment. This finding was backed by evidence of government investment in public sectors claimed to be weak including agriculture, manufacturing, energy, banking and financial services) which reduced the chances for private investment.
The findings of the study where based on two different stochastic trends and one combine vector on GDP, private investment and public investment. The stochastic trends are that public investment in the long run has a negative impact on growth and private investment. This trend changes in the long- run where public investment negatively affects only private investment and not growth.
Greene and Villanueva (1991) undertook a study of private investment in developing countries. The aim of the study was to learn about the empirical determinants of private investment in 23 develop-ing countries durdevelop-ing the post 1974 period. In dodevelop-ing so, the paper studied on how various macroeco-nomic factors influence private investment in developing countries. Among the macroecomacroeco-nomic variables are (1) growth and per capita income level; (2) macroeconomic stability (as represented by low inflation rates); (3) the level of real interest rates; (4) the size of debt-service burdens (as meas-ured by debt-service ratios and the magnitude of external debt relative to GDP); and (5) the rate of public sector investment. The study confirmed that it was difficult for them to identify the correct model specification and the necessary data for such study. However, the study found evidence con-firming that GDP growth and level of private investment have a positive relationship, followed by the rate of public sector investment. In addition, there is a positive relationship among saving, pri-vate investment, and growth.
Mohsin and Carmen (1989) analyzed the effect of private investment on growth in developing countries. This paper states that popular growth models like Harrod-Domar and Solow model make no distinction between public and private investment and their definite effect on growth. Rather, they are both treated as investment. Meanwhile, this paper indicated that theoretical hypothesis sup-ports the notion that private sector investment has more effect on growth than public investment. However, there are scarce proven empirical evidences to support these facts. The purpose of their paper is to investigate the issue by expressing a simple growth model that divides the public and private sector investment. The estimation was conducted for 24 developing countries over the 1970s.The results support the concept that private investment has a greater effects on growth than public investment and therefore significant for growth.