WELL-TO-WHEEL EFFICIENCY
For alternative fuels from
natural gas or biomass
Titel: Well-To Wheel Efficiency for alternative fuels from natural gas or biomass
Keywords: alternative fuels, hydrogen, methanol, ethanol, electricity, DME, alcohols, hybrids, fuel cell, Fisher-Tropsch, synthetic gas, biomass, methane, natural gas, CNG
Author: Peter Ahlvik and Åke Brandberg, Ecotraffic R&D3 AB
Contact persons: Olle Hådell and Pär Gustafsson, Swedish National Road Administration, Vehicle Standards Division
Publication number: 2001: 85 ISSN: 1401-9612
Printed: October 2001
Edition: 100 copies. Also available for downloading at http://www.vv.se/publ_blank/bokhylla/miljo/lista.htm
Distributor: SNRA, Head Office, SE-781 87 Borlänge, phone +46 243-755 00, fax +46 243 755 50, e-mail: vagverket.butiken@vv.se
Ecotraffic ERD
3AB
Peter Ahlvik
Åke Brandberg
October 2001
WELL-TO-WHEEL EFFICIENCY
For alternative fuels from
natural gas or biomass
A report for
PREFACE
The emissions of climate gases from the transport sector and the measures that should be taken to reduce these emissions are debated both in Sweden and in Internationally. Alter-native fuels from renewable sources, new powertrains, etc. are discussed as possible op-tions. Since there are only few studies available on this issue, it was of interest to carry out a project that would highlight some of these issues.
In April 2001, the Swedish National Road Administration, SNRA, published a report over a well to wheel efficiency study, which had been carried out by the Swedish consultant company Ecotraffic. The report was published in Swedish. After the report was published, it became clear that there was an international interest for an English version of this report. While the work on the Swedish version of the report was in progress, and after the report was finished, several interesting international reports on the subject were published. There-fore, it was felt that a pure translation of the report without considering the most recent publications would have been somewhat negligent. It was also of interest to make some comparisons with the results from the most interesting studies.
In order to keep the major part of the original Swedish report relatively intact, it was de-cided to translate that report and to put the comparisons in an appendix.
The report has been written by Peter Ahlvik and Åke Brandberg, Ecotraffic ERD3 AB. The authors are liable to the results and the assessments in the report
Borlänge, October 2001
TABLE OF CONTENTS
Page EXECUTIVE SUMMARYSVENSK SAMMANFATTNING (SWEDISH SUMMARY)
1 INTRODUCTION... 1 2 BACKGROUND ... 3 3 METHODOLOGY... 5 3.1 Timeframe... 5 3.2 Literature survey... 6 3.3 Literature evaluation ... 6 3.4 Lifecycle perspective ... 7 3.4.1 Feedstock production ...7 3.4.2 Production processes ...7
3.4.3 Distribution and refuelling ...8
3.4.4 End use ...9
3.5 Examined systems... 9
3.5.1 System definition ...9
3.5.2 Fuel production pathways ...10
3.5.3 Vehicle powertrains...11
3.5.4 System selection ...12
4 RESULTS ... 17
4.1 Feedstock production... 17
4.1.1 Natural gas ...17
4.1.2 Biomass – lignocellulosic matter ...18
4.1.3 Biomass for digestion ...18
4.2 Feedstock transport... 19
4.2.1 Natural gas transport ...19
4.2.2 Transport of biomass – lignocellulosic feedstock...19
4.2.3 Transport of biomass – lucerne...19
4.3 Fuel production... 19 4.3.1 Methane...20 4.3.2 Methanol...20 4.3.3 DME...21 4.3.4 Ethanol ...21 4.3.5 Synthetic hydrocarbons ...22 4.3.6 Hydrogen...23
4.4 Distribution and reforming ... 24
4.4.1 Methane...24 4.4.2 Methanol...24 4.4.3 Ethanol ...24 4.4.4 Synthetic hydrocarbons ...24 4.4.5 Hydrogen...25 4.4.6 Electricity ...25 4.5 Refuelling ... 25 4.5.1 Methane...25 4.5.2 Hydrogen...26
4.6 End use ... 26
4.6.1 Technology shift for gasoline and diesel engines ...26
4.6.2 Choice of vehicle type...29
4.6.3 The otto engine...34
4.6.4 Diesel engine...40
4.6.5 Direct fuel cells...42
4.6.6 Fuel cell hybrids...43
4.6.7 Fuel cell – internal reforming (DMFC) ...43
4.7 Total system efficiency ... 43
4.7.1 Gaseous fuels...44
4.7.2 Liquid fuels ...49
4.7.3 Highest system efficiency ...53
4.7.4 Fossil and non-fossil energy use ...57
5 DISCUSSION AND CONCLUSIONS ... 59
5.1 Results from this study... 59
5.2 Comparison with other studies ... 60
5.2.1 Methodology and assumptions ...60
5.2.2 Powertrains ...61
5.2.3 Well-to-wheel efficiency ...61
5.2.4 Sustainability ...62
6 REFERENCES... 63
LIST OF TABLES
Page Table 1. Composition of Danish natural gas --- 17Table 2. Voluntary limits for CO2 emissions in Europe --- 30
Table 3. Some important vehicle parameters --- 31
Table 4. Aerodynamic drag for some passenger cars --- 32
Table 5. Vehicle weight with various drivetrains and fuels--- 33
Table 6. System efficiency for gaseous fuels from (fossil) natural gas --- 46
Table 7. System efficiency for gaseous fuels from biomass --- 48
Table 8. System efficiency for liquid fuels from fossil natural gas--- 49
Table 9. System efficiency for liquid fuels from biomass--- 51
Table 10. System efficiency for systems based on crude oil and natural gas feedstocks --- 52
Table 11. System efficiency for systems based on biomass feedstocks --- 52
LIST OF FIGURES
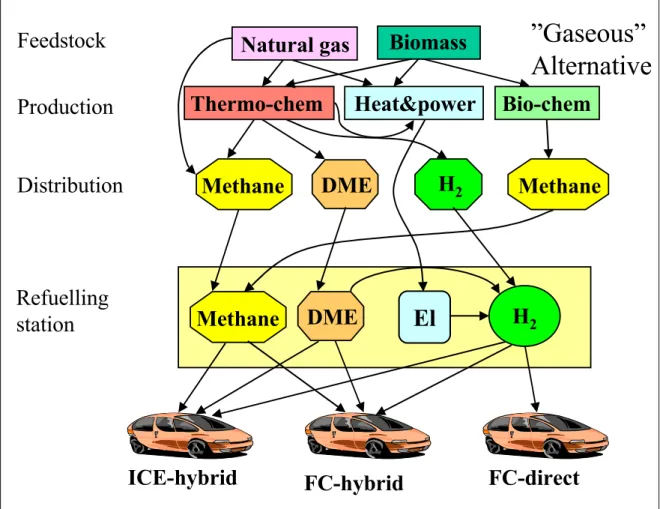
Page Figure 1. Alternative “gaseous” fuels --- 13Figure 2. Alternative “liquid” --- 15
Figure 3. Technology shift--- 27
Figure 4. Fuel consumption potential for various powertrains and fuels (PNGV) --- 29
Figure 5. Reduction of fuel consumption for otto engine in relation to cost (figure adapted from a publication by AVL) --- 34
Figure 7. System efficiency for the 10 best fuel/powertrain combinations. Fuels
from natural gas feedstock.--- 54
Figure 8. System efficiency for the best combinations of fuel/powertrain. Fuels
from natural gas feedstock.--- 54
Figure 9. System efficiency for the 10 best fuel/powertrain combinations. Fuels
from biomass feedstock --- 55
Figure 10. System efficiency for the best combinations of fuel/powertrain. Fuels
from biomass feedstock --- 56
Figure 11. Fossil and non-fossil energy use. --- 58
APPENDICES
Appendix 1: Comparisons with other studies Appendix 2: Results in tables
EXECUTIVE SUMMARY
Introduction
The interest in alternative fuels, and biofuels in particular, appears to be increasing due to the ever-increasing problems associated with the emissions of climate gases from road traf-fic. Eventually, the fossil fuels will also be exhausted and the question is no longer if than
when this will happen. In principle, the fossil fuels will not be completely exhausted but
the cost of exploitation of the resources will become prohibitively high. Alternative fuels are also of interest from an energy security point of view in order to be prepared for a cer-tain crisis.
Two different kinds of feedstocks for the production of alternative fuels are of special in-terest to investigate, i.e. (fossil) natural gas and biomass. The availability of natural gas is vast and in the future, this feedstock could become a substitute for crude oil. On a longer-term horizon, biofuels will be of greater interest in order to decrease the emissions of cli-mate gases. A classification of the fuels in gaseous and liquid fuels has been made to take into account the significant difference in infrastructure for the distribution and refuelling that are needed for these two categories of fuels. A different kind of classification of inter-est would be to classify them according to the potential market penetration (in a fully de-veloped scenario). The following definitions have been used:
• >1% but <10% of the market (niche fuel)
• >10% of the market (principal fuel, i.e. for general use everywhere)
Motor fuels and powertrain combinations with a potential use less than 1% have not been considered as such fuels would be of little interest with regard to effect of greenhouse gases (by definition <1%).
The following types of motor fuels have been considered to be of interest to study for final use (not in priority order but in density order):
• Synthetic hydrocarbon fuels (hereafter referred to as “synfuel”): diesel oil and /or fuel cell fuel, i.e. special quality adapted for fuel cells)
• Ethanol • Methanol
• DME (dimethyl ether) • Methane
• Hydrogen
As reference, petrol and diesel fuel have also been evaluated. Both these fuel qualities have been considered to be reformulated and virtually sulphur-free (<10 ppm). Hence, the pos-sible advances in the refining processes for these fuels will be counteracted by the addi-tional processing that will be necessary to fulfil the anticipated future fuel specifications.
Methodology
Since the production of alternative fuels in several cases still is not fully developed, a fu-ture scenario has been used to show a more realistic potential for this technology in com-parison the conventional fuels. In order to make the comcom-parison of new powertrains, such as fuel cells and hybrid drivetrains more realistic, the focus has to be on a future use of these systems as well. A timeframe of 2012 was chosen as a reasonable compromise be-tween various possible timeframes. First, it was considered essential not to choose a too distant future to make it impossible to predict what could happen within this timeframe. Second, it is also of importance to satisfy the criterion that new technology should have had a development time long enough to mature. It has also been considered that the con-ventional powertrains will be further developed during the timeframe.
The fuel converters investigated have been otto1 (SI) and diesel (CI) engines as well as fuel
cells. The drivetrains have been an automated mechanical gearbox, and electric hybrid systems of parallel (combustion engines) and serial (fuel cells) types. In total, 98 different combinations of fuels, energy converters (“engines”) and drivetrains have been studied. A literature search was carried out to supplement the data that was already available re-garding fuel production and technology for powertrains for light-duty vehicles. Concerning the production of fuels, an update of an earlier study by Ecotraffic, the “Life of Fuels” was made. For the powertrains, input data was collected for the use in simulating the efficiency and fuel consumption for the vehicle. These simulations were carried out in the Advisor® (release 3.0) software package from NREL in the USA.
Results
Powertrains
The results from the study shows that fuel cells and diesel engines are the fuel converters that provide the highest efficiency and that the otto engine has a lower efficiency that these two. A significant improvement of the system efficiency could be achieved if the internal combustion engines are used in hybrid drivetrains. The relative improvement for the fuel cells in a hybrid drivetrain is somewhat smaller. However, the differences between these electric drivetrains are significant, since the fuel cell must use a series hybrid drivetrain (this is the only possible solution), while the internal combustion engines are anticipated to use a parallel hybrid drivetrain. The choice of the latter system was made, since the effi-ciency is higher than for the former.
Well-to-wheel efficiency
In summarising the results on efficiency for the whole system in a lifecycle (well-to-wheel) perspective, two figures are shown. Figure ES-1 shows the results for the best powertrain for each fuel option, where the fuels have been produced from natural gas. Similar results are shown in Figure ES-2, but in this case, the fuels have been produced from biomass. The results for most of the fuel/powertrain combinations are also summarised in Tables ES-1 and ES-2 at the end of the Executive Summary.
1 In general, “otto” is usually written with “O” as a capital letter in English and “diesel” is written with the
To add another dimension to the figures mentioned, a classification of the fuels into four different groups has been made. The first criterion has been to distinguish between the fu-els according to their market potential, i.e. principal fufu-els (>10%) or niche fufu-els (<10%), according to the definition mentioned above. The second criterion has been to differentiate between fuels, which may be “flexible fuels” in any sense and fuels that do not enable this flexibility. Such ones are fuels that can be utilised in FFV (e.g. methanol and petrol) or in dual-fuel vehicles (e.g. biogas and petrol). Another example, which has been included among the flexible fuels, is synthetic hydrocarbons (synfuel), as it is miscible with diesel oil in any proportion. Since no better acronym than “FFV” has been found, this designation has been used although it might be somewhat ambiguous. During an introduction phase for new fuels, fuel flexibility can be an important property, and, therefore, it is of interest to identify such advantages. Since the figures mentioned do shown only a fraction of all in-vestigated combinations, one of the four categories (niche fuel, FFV) is missing in the fig-ures but to make the legend boxes complete, this alternative has been listed anyway.
System efficiency (well-to-wheel) for various fuels and powertrains Best fuel/powertrain combination for each fuel – fuels from natural gas
10,1% 14,9% 15,9% 14,4% 8,5% 15,7% 14,3% 11,7% 0,0% 2,5% 5,0% 7,5% 10,0% 12,5% 15,0% 17,5%
CNG FC-hyb LNG FC-hybDME diesel-hyb GH2 FC-hybMeOH diesel-hybSyn diesel-hyb LH2 FC-hybEl-GH2 FC-hyb
Well-to-wheel efficiency (%)
Principal fuel (FFV) Principal fuel (non-FFV) Niche fuel (FFV) Niche fuel (non-FFV)
Figure ES-1. System efficiency for the best combinations of fuel/powertrain. Fuels from
natural gas feedstock.
The results show that various fossil fuels (from crude oil and natural gas), as could be an-ticipated, have a higher efficiency than the biofuels. This is due to that the latter category is based on original, renewable feedstock but the fossil fuels are made from a “semimanufactured” feedstock. This feedstock is not renewed and therefore, it has an im-pact on the climate change, which the biofuels do have only to a small extent. For the bio-fuels, only about 11% of the energy content of the feedstock is obtain as transport work, which is somewhat lower than for the baseline petrol-fuelled otto-engined passenger cars (model year 2012). In general, it can be stated that the less conversion necessary for the feedstock to receive a useful motor fuel, the higher the efficiency will be. However, this is
only achievable for natural gas and crude oil, since a relatively extensive conversion proc-ess is always necproc-essary for biomass.
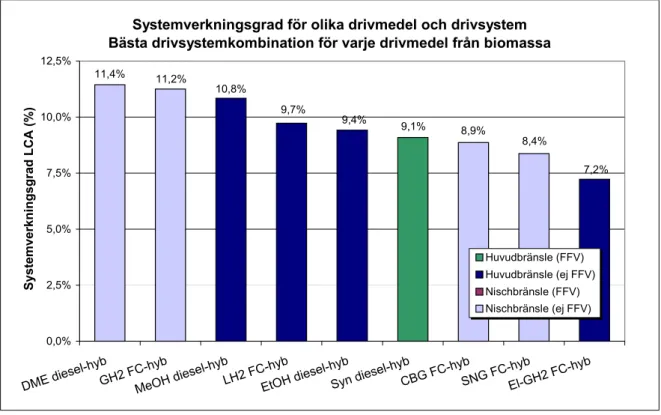
System efficiency (well-to-wheel) for various fuels and powertrains Best fuel/powertrain combination for each fuel – fuels from biomass
8,9% 8,4% 11,2% 11,4% 9,4% 10,8% 7,2% 9,7% 9,1% 0,0% 2,5% 5,0% 7,5% 10,0% 12,5%
DME diesel-hybGH2 FC-hybMeOH diesel-hybLH2 FC-hybEtOH diesel-hybSyn diesel-hybCBG FC-hybSNG FC-hybEl-GH2 FC-hyb
Well-to-wheel efficiency (%)
Principal fuel (FFV) Principal fuel (non-FFV) Niche (FFV)
Niche fuel (non-FFV)
Figure ES-2. System efficiency for the best combinations of fuel/powertrain. Fuels from
biomass feedstock.
The mutual order between the fuels for the best combinations of all fuels is varying de-pending on if the feedstock is fossil natural gas or biomass. Three fuels, DME, GH2 and
methanol (of which two are in gaseous state and one in liquid), have been identified as fu-els that provide high efficiency when produced both from natural gas and from biomass, provided that the best powertrains are used. It could also be mentioned that the feedstock and production processed for DME and methanol are, in principle, similar.
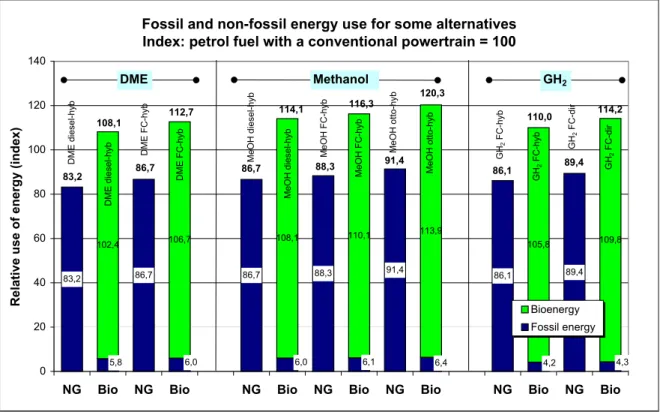
Sustainability
As the issue of sustainability will be more important in the future, it is also of interest to show some results on the use of fossil and non-fossil energy. In Figure ES-3, a split be-tween the two types of energy use has been shown for the three “best” motor fuels (DME, methanol and hydrogen) in combination with the best powertrains (fuel cells and diesel engine hybrids). In addition to the best powertrains, a methanol-fuelled otto engine hybrid is also shown, since this might be an interesting transitional solution (fuel-flexible vehicle). The options mentioned are compared with a conventional petrol-fuelled car (index = 100). As Figure ES-3 shows, and as already has been mentioned, it is not possible to reach the high system efficiencies for biomass based fuels as for fuels from (already partly con-verted) fossil feedstocks. This is quite natural as the conversion path to motor fuels is longer and more complex (and energy demanding) for fuels based on biomass. On the other hand, it is evident that very substantial decrease of the fossil energy use can be ac-complished with the biomass based motor fuels compared to those based on fossil
feed-stocks. The use of fossil fuels in the chain for biomass based between the various alterna-tives, varying between 4,2 and 6,0%. This means that about 95% (93,6-96,2) of the fossil energy could be replaced with bio-energy compared to the reference case.
Fossil and non-fossil energy use for some alternatives Index: petrol fuel with a conventional powertrain = 100
83,2 86,7 86,7 88,3 91,4 86,1 89,4 102,4 106,7 108,1 110,1 113,9 105,8 109,8 5,8 6,0 6,0 6,1 6,4 4,2 4,3 0 20 40 60 80 100 120 140
NG Bio NG Bio NG Bio NG Bio NG Bio NG Bio NG Bio
Relative use of energy (index) Bioenergy
Fossil energy DME Methanol GH2 83,2 108,1 86,7 112,7 86,7 114,1 88,3 116,3 91,4 120,3 86,1 110,0 89,4 114,2 DME diesel-hyb DME diesel-hyb DME FC-hyb DME FC-hyb MeOH diesel-hyb MeOH diesel-hyb MeOH FC-hyb MeOH FC-hyb MeOH otto-hyb MeOH otto-hyb GH 2 FC-hyb GH 2 FC-hyb GH 2 FC-di r GH 2 FC-di r
Figure ES-3. Fossil and non-fossil energy use.
Comparison with other studies
After the Swedish version of this report was published, it was found that an international interest in the report could motivate a translation into English. While the work on the Swedish version of this report was in progress and after the report was finished, several interesting international reports on this subject were published. Therefore, it was felt that a pure translation of the report without considering the most recent publications would be somewhat negligent. It was also of interest to make some comparisons with the results from the most interesting studies. Therefore, a comparison with these results was made separately. This addendum to the Swedish version of this study is attached in Appendix 1. Studies by MIT, GM and a German study were considered of most interest, although the final report was not available in the last case. Several other studies have also been dis-cussed.
Methodology and assumptions
In general, it can be concluded that a comparison of results from different studies is diffi-cult due to the various conditions chosen and the assumptions made. Most studies seems to have the ambition to picture at least a medium term time frame, 2005-2020, and focus on principal motor fuels marketable in large volumes. Not all studies have been successful in
upholding this ambition throughout. Long term sustainability has only been discussed by a few.
The assumptions made for the vehicles and powertrains seems to differ considerably in several cases. Mostly, an evolutionary or advanced (future) vehicle and improvements in conventional drivetrains and, in addition, the option of hybridisation seems to be in com-mon of most studies. Comparisons of relative vehicle weight between the studies by MIT and Ecotraffic showed reasonable agreement in most cases. Vehicle range and assumptions about the drivetrain and fuel converters could explain most of the differences. In some cases, the criteria for vehicle performance showed a considerable difference between vari-ous studies, although most studies have tried to keep the vehicle acceleration constant.
Powertrains
It is trivial to state that that systems based on the diesel engine in all relevant studies are found to have some 21-24% system efficiency advantage over the reference vehicle (evolved petrol driven otto engined vehicle). It is, however, remarkable that no study but Ecotraffic’s has tried to analyse alcohols as fuels (particularly in diesel engine drivetrains), in spite of the potential they have among the alternative fuels and that they can be pro-duced on bio-basis.
Fuel cells are without doubt efficient energy converters, with hydrogen as fuel more than 50% better than the reference vehicle (GM quotes >100%). Fair comparisons cannot, how-ever, be made without considering the energy used for refuelling, which is high for hydro-gen and reduces the powertrain efficiency to be “only” about 25% better. When consider-ing also the production and distribution steps, the efficiency advantage will be further re-duced. Fuels that require onboard-conversion to hydrogen must include this step in the powertrain, which will reduce the energy efficiency advantage to 18-22% (highest for methanol) in the Ecotraffic study. GM quotes higher figures for both petrol and alcohols. The vast difference between the petrol-fuelled (naphtha in one case) fuel cell vehicles in the MIT and GM studies could be noted.
Hybridisation in general, seems to increase the efficiency of the powertrain. The improve-ment potential is at least 20-24% for internal combustion engines and one study (MIT) found an even greater difference. The potential of hybridisation for fuel cells, at 6-12%, seems to be somewhat smaller.
Well-to-wheel efficiency
CNG/LNG systems usually rank high due to the low energy needs to process NG to pipe-line-NG (and to LNG), assuming that large-scale distribution systems are in place. Hydro-gen from NG is also an efficient option due to the high efficiency of the fuel cell power-train. Depending on the assumptions made DME and methanol could be efficient options as well.
Although some fuels in gaseous form (NG, H2) have shown a high efficiency in several
studies, they have also been considered as niche fuels (however, important) in many stud-ies. DME is easier to handle and has almost the same efficiency with NG as feedstock. LNG and LH2 are liquid options but, as cryogenic fuels, increased cost and, in the latter
case, a decrease in efficiency are drawbacks. Methane has the drawback that there does not seem to be any efficient way to produce it from biomass resources (on a large scale).
Liq-uid fuels, easily handled as petrol and diesel oil today, will have a great advantage in dis-tribution and refuelling efficiencies and allow retaining of the refuelling habits of the pub-lic. Of the liquid non-cryogenic fuels, methanol seems to be the fuel that has the highest efficiency. Considering these facts, it seems remarkable that this fuel has not been more thoroughly studied.
Sustainability
To maintain the hydrocarbon base feedstocks in a scenario with great reductions of GHG, sequestration of CO2 in deposits in the crust of the earth would be necessary and is often
discussed as technically not an infeasible solution. The unavoidable consequence is, how-ever, a distribution system for hydrogen, which we cannot see as the general future system (above). For GHG-reductions of the magnitude of 80-90%, only biomass-based fuels have such potential, as has been demonstrated in several of the studies.
Discussion and conclusions
As a summary of the results from this study, it can be stated that it is not trivial to find a final “winner” among the 3 to 5 best candidate fuels. On the contrary, it is easier to exclude some of the options where the system efficiency is comparatively low. Hydrogen produced from electricity is such a case.
It is also of importance to mention that there are various criteria available for choosing fu-els that have not been disseminated in this study. A very important criterion is, for exam-ple, the cost for fuel production, distribution and end use. However, an assessment of this kind has been beyond the scope of this study.
fficiency 3 AB Octo ber 20 01 xi
Table ES-1. Relative system efficiency for systems based on crude oil and natural gas feedstocks
FUEL, fuelled as Petrol Diesel DME Methanol Ethanol FTD CNG CNG GH2 GH2 GH2 GH2 GH2
DISTRIBUTED as Petrol Diesel DME Methanol Ethanol FTD CNG LNG GH2 LH DME Methanol El
Powertrain System efficiency for crude oil / natural gas-based systems in relation to the conventional petrol-fuelled car (=100)
Diesel eng. - hybrid 150,7 120,2 115,4 94,3
Fuel cell - hybrid 115,3 113,2 81,5 128,8 126,6 116,1 81,9 91,7 93,0 68,8
Fuel cell - direct 107,8 107,5 78,5 124,1 122,0 111,9 78,9 88,4 88,3 66,3
Otto engine - hybrid 124,0 109,5 128,1 125,9 90,1 63,5 71,2 70,0 53,4
Diesel eng. – conv. 125,0 99,7 95,7 78,2
DMFC - hybrid 93,8
Otto engine – conv. 100 88,3 104,5 102,7 73,5 51,8 58,1 57,1 43,6
Table ES-2. Relative system efficiency for systems based on biomass feedstocks
FUEL, fuelled as Petrol Diesel DME Methanol Ethanol FTD CNG CNG GH2 GH2 GH2 GH2 GH2
DISTRIBUTED as Petrol Diesel DME Methanol Ethanol FTD CNG LNG GH2 LH DME Methanol El
Powertrain System efficiency for biomass-based systems in relation to the conventional petrol-fuelled car (=100)
Diesel eng. - hybrid 92,5 87,7 76,1 73,5
Fuel cell - hybrid 88,7 86,0 71,2 65,4 71,6 67,6 90,9 78,6 72,4 72,8 58,4
Fuel cell - direct 82,9 81,6 67,6 62,1 69,0 65,2 87,6 75,8 69,7 69,1 56,3
Otto engine - hybrid 83,1 70,7 71,2 67,3 70,5 61,0 56,1 54,8 45,3
Diesel eng. – conv. 76,7 72,7 63,1 61,0
DMFC - hybrid 71,2
SVENSK SAMMANFATTNING (SWEDISH SUMMARY)
Introduktion
Ökade utsläpp av klimatgaser från trafiken har lett till att intresset för alternativa drivmedel och för biodrivmedel i synnerhet ökat. På lång sikt kommer också de fossila drivmedlen att ta slut men innan det händer kommer kostnaderna för att exploatera tillgångarna att öka markant. Rent principiellt kommer inte de fossila bränslena att ta helt slut men kostnaden för att exploatera resurserna kommer att bli oöverkomligt höga. Alternativa drivmedel är också av intresse ur försörjningssynpunkt för att kunna hålla en viss beredskap för en kris-situation.
Två olika typer av råvaror för produktion av alternativa drivmedel är av speciellt intresse att undersöka, nämligen fossil naturgas och biomassa. Tillgången på naturgas är stor och kan i framtiden bli ett komplement till råolja som råvarubas. På längre sikt är dock bio-drivmedel av störst intresse för att minska utsläppen av klimatgaser. En indelning av driv-medlen i gasformiga och flytande drivmedel har gjorts för att ta hänsyn till den väsentliga skillnad i infrastruktur för distribution och tankning som föreligger mellan dessa två kate-gorier av drivmedel. En annan typ av indelning som är av intresse är att dela in bränslena efter deras potential till penetration på marknaden (i ett fullt utbyggt scenario). Följande definitioner har använts:
• >1% men <10% av marknaden (nischbränsle)
• >10% av marknaden (huvudbränsle, dvs. ett bränsle för allmän användning)
Alternativ som inte har potential att klara mer än 1% har uteslutits eftersom en så låg pe-netration är av litet intresse ut klimatgassynpunkt.
Följande olika typer av bränsle har ansetts vara av intresse att studera (ej i prioritetsordning utan i densitetsordning):
• Syntetiska kolvätebränslen (i forts. ofta förkortat till ”syntetiskt bränsle” eller ”synte-tiskt drivmedel”): dieselolja och/eller ”bränslecellsbränsle” (dvs. speciell kvalitet an-passad för bränsleceller) • Etanol • Metanol • DME (dimetyleter) • Metan • Vätgas
Som referens har också bensin och dieselolja utvärderats. Båda dessa drivmedelskvaliteter har ansetts vara ”reformulerade” och praktiskt taget svavelfria (<10ppm). Därför kommer de möjliga förbättringarna i framställningsprocessen för dessa drivmedel att motverkas av den ytterligare raffinering som kommer att vara nödvändig för att uppfylla framtida bräns-lespecifikationerna.
Metodik
Eftersom produktionen av alternativa drivmedel i flera fall ännu inte är fullt utvecklad har ett framtida scenario använts för att visa en mer realistisk potential för denna teknik i jäm-förelse med de konventionella drivmedlen. För att nya drivsystem som bränsleceller och hybriddrift skall vara realistiska alternativ krävs också att en användning av dessa system fokuseras på framtida fordon. En tidshorisont till 2012 har valts som en lämplig kompro-miss mellan olika tänkbara tidshorisonter. För det första har det varit viktigt att inte välja en allför avlägsen framtid för att det skall vara möjligt att förutspå vad som kan tänkas hända. För det andra är det viktigt att tillfredsställa kriteriet att den nya tekniken skall ha haft tillräckligt lång utvecklingstid för att mogna. Hänsyn har naturligtvis tagits till att även de konventionella drivsystemen och motorer kommer att utvecklas vidare under tidsperio-den.
De energiomvandlare som undersökts är otto- och dieselmotorer samt bränsleceller. Driv-systemen har varit en mekanisk växellåda med växlingsautomatik och elhybridsystem av parallell- (för förbränningsmotorerna) och serietyp. Totalt har 98 olika kombinationer av drivmedel, energiomvandlare (”motorer”) och drivsystem studerats.
En litteratursökning har utförts för att komplettera befintligt underlag när det gäller pro-duktion av drivmedel och teknik för drivsystem i lätta fordon. Vad gäller propro-duktionen av drivmedel har en uppdatering av underlag och beräkningar i en tidigare studie från Ecotraf-fic, ”Life of Fuels”, gjorts. För drivsystemen har dataunderlag samlats i för att sedan kunna utföra simuleringar av verkningsgrad och bränsleförbrukning för drivsystemet i fordonet. Dessa simuleringar har utförts i programmet Advisor® (version 3.0) från det federala labo-ratoriet NREL i USA.
Resultat
Drivsystem
Resultaten från studien visar att bränsleceller och dieselmotorer är de energiomvandlare som ger den högsta verkningsgraden och att ottomotorn har en lägre verkningsgrad än des-sa två. En väsentlig förbättring av systemverkningsgraden erhålls om kolvmotorerna an-vänds i ett hybridsystem medan förbättringen av hybridsystemet är mindre för bränslecel-ler. Skillnaderna i eldrivsystemet mellan dessa två alternativ (bränsleceller resp. kolvmoto-rer) är dock stora eftersom bränslecellen använder ett seriehybridsystem (enda möjlighe-ten) och kolvmotorerna förutsätts använda ett parallellhybridsystem. Valet av hybridsystem i det senare fallet har gjorts för att verkningsgraden för detta är högre än för ett seriehyb-ridsystem.
Systemeffektivitet
För att på ett enkelt sätt summera resultaten för hela systemet i ett livscykelperspektiv visas två olika figurer. Figur S-1 visar resultaten för den bästa alternativet av drivsystem för varje bränslealternativ där drivmedlen i detta fall producerats från (fossil) naturgas. Lik-nande resultat visas i Figur S-2 men i detta fall har drivmedlen producerats från biomassa. Resultaten för de flesta bränsle/drivsystem kombinationerna har också summerats i Ta-bellerna S-1 och S-2 i slutet av sammanfattningen.
För att införa ytterligare en dimension i de nämnda figurerna har en klassificering av de olika drivmedlen i 4 olika grupper gjorts. Det första kriteriet har varit att skilja mellan drivmedlen i förhållande till deras marknadspotential, dvs. med en indelning i huvud-bränslen (>10%) och nischhuvud-bränslen (<1%) i enlighet med definitionerna som nämnts ovan. Det andra kriteriet har varit att skilja mellan drivmedel som kan betecknas som ”bränsleflexibla” i någon mening och de som inte tillåter denna flexibilitet. Sådana bräns-len är de som kan användas i FFV (t.ex. metanol och bensin) eller i tvåbränslefordon (t.ex. biogas och bensin). Ett annat exempel på bränslen som har inkluderats bland de flexibla bränslena är syntetiskt dieselbränsle, eftersom det är blandningsbart med dieselolja i god-tyckliga proportioner. Eftersom ingen bättre benämning än ”FFV” har hittats har denna beteckning använts även om den kan tyckas något tvetydig. Under en introduktionsfas av nya drivmedel är bränsleflexibiliteten en viktig egenskap och därför är det av intresse att identifiera sådana fördelar. Eftersom de nämnda figurerna visar endast en bråkdel av alla undersökta kombinationer saknas en av de 4 kategorierna (nischbränsle, FFV) i figurerna, men för att göra förklaringsrutorna kompletta har detta alternativ listats i alla fall.
Systemverkningsgrad för olika drivmedel och drivsystem Bästa drivsystemkombination för varje drivmedel från naturgas
10,1% 14,9% 15,9% 14,4% 8,5% 15,7% 14,3% 11,7% 0,0% 2,5% 5,0% 7,5% 10,0% 12,5% 15,0% 17,5%
CNG FC-hybLNG FC-hybDME diesel-hybGH2 FC-hybMeOH diesel-hybSyn diesel-hyb LH2 FC-hybEl-GH2 FC-hyb
Systemverkningsgrad LCA (%)
Huvudbränsle (FFV) Huvudbränsle (ej FFV) Nischbränsle (FFV) Nischbränsle (ej FFV)
Figur S-1. Systemverkningsgrad för den bästa kombination för respektive drivmedel.
Drivmedel med naturgas som råvara
Resultaten för de olika drivmedlen visar att de på fossil bas (råolja, naturgas) självfallet uppvisar högre systemverkningsgrader än de på biomassebas beroende på att de senare utgår från en ursprunglig, förnybar råvara medan de fossila startar från ett ”halvfabrikat”, som ej återbildas och därför påverkar växthuseffekten, vilket de biomassabaserade gör bara i mycket liten grad. För de sistnämnda erhålls i bästa fall drygt 11% av råvarans energiin-nehåll som utfört transportarbete, vilket är något lägre än för bilar med bensindrivna otto-motorer (modellår 2012). Generellt gäller att ju mindre konvertering som behövs för råva-ran för att få användbart drivmedel desto högre är verkningsgraden. Detta är dock bara
aktuellt för fossilgas och råolja eftersom en relativt sett mer omfattande konvertering alltid är fallet för biomassa.
Systemverkningsgrad för olika drivmedel och drivsystem Bästa drivsystemkombination för varje drivmedel från biomassa
8,9% 8,4% 11,2% 11,4% 9,4% 10,8% 7,2% 9,7% 9,1% 0,0% 2,5% 5,0% 7,5% 10,0% 12,5%
DME diesel-hybGH2 FC-hybMeOH diesel-hybLH2 FC-hybEtOH diesel-hybSyn diesel-hybCBG FC-hybSNG FC-hybEl-GH2 FC-hyb
Systemverkningsgrad LCA (%)
Huvudbränsle (FFV) Huvudbränsle (ej FFV) Nischbränsle (FFV) Nischbränsle (ej FFV)
Figur S-2. Systemverkningsgrad för den bästa kombination för respektive drivmedel.
Drivmedel med biomassa som råvara
Den inbördes ordningen mellan drivmedlen för de bästa kombinationerna av alla drivmedel varierar beroende på om råvaran är fossil naturgas eller biomassa. Tre drivmedel, DME, GH2 och metanol (varav två är gasformiga och ett är flytande), har identifierats som
driv-medel som har hög systemverkningsgrad då både fossil naturgas och biomassa används som råvara förutsatt att bästa drivsystem används. Det kan också nämnas att råvara och produktionssystem för DME och metanol i princip är desamma.
Långsiktig hållbarhet
Eftersom frågan om långsiktig hållbarhet kommer att bli alltmer viktig i framtiden är det också av intresse att visa några resultat om användningen av fossil och icke-fossil energi. I Figur S-3 visas en uppdelning av de två olika typerna av energianvändning för de tre ”bästa” drivmedlen (DME, metanol och vätgas) i kombination med de bästa drivsystemen (bränsleceller och dieselhybrider). Som komplement till de bästa drivsystemen visas också en metanoldriven ottomotorhybrid, eftersom detta kan vara en intressant övergångslösning (en bränsleflexibel bil). De nämnda alternativen har normerats i förhållande till en konven-tionell bensindriven bil (index = 100).
Som framgår av Figur S-3, och som redan tidigare påpekats, är det inte möjligt att erhålla lika hög systemverkningsgrad för de bränslen som framställs från biomassa som för de fossila bränslena. Detta är naturligt eftersom konverteringen till ett drivmedel är mer komplicerad (och energikrävande) för de bränslen som framställs från biomassa. Däremot är det uppenbart att en väsentlig minskning av den fossila energianvändningen kan
åstad-kommas med biomassebaserade bränslen jämfört med de som baserats på fossil råvara. Användningen av fossila bränslen skiljer sig inte speciellt mycket mellan de olika alterna-tiven emedan variationen är mellan 4,2 och 6,0%. Detta innebär att ca 95% (93,6%-96,2%) av den fossila energin kan ersättas med bioenergi i jämförelse med referensfallet.
Användning av fossil respektive icke fossil energi för några olika alternativ Index: bensindrift i konventionellt drivsystem = 100
83,2 86,7 86,7 88,3 91,4 86,1 89,4 102,4 106,7 108,1 110,1 113,9 105,8 109,8 5,8 6,0 6,0 6,1 6,4 4,2 4,3 0 20 40 60 80 100 120 140
NG Bio NG Bio NG Bio NG Bio NG Bio NG Bio NG Bio
Relativ användning av energi (index)
Bioenergi Fossil energi DME Metanol GH2 83,2 108,1 86,7 112,7 86,7 114,1 88,3 116,3 91,4 120,3 86,1 110,0 89,4 114,2 DME diesel-hyb DME diesel-hyb DME FC-hyb DME FC-hyb MeOH diesel-hyb MeOH diesel-hyb MeOH FC-hyb MeOH FC-hyb MeOH otto-hyb MeOH otto-hyb GH 2 FC-hyb GH 2 FC-hyb GH 2 FC-di r GH 2 FC-di r
Figur S-3. Fossil respektive icke fossil energi
Jämförelse med andra studier
Efter det att den svenska versionen av denna rapport publicerats kunde man notera ett in-ternationellt intresse som motiverade en översättning till engelska. Medan arbetet med den svenska versionen pågick och efter att rapporten färdigställts, publicerades flera intressanta internationella rapporter inom detta område. Därför ansågs att enbart en översättning av rapporten utan att ta hänsyn till de senaste publikationerna vore något nonchalant. Det var också av intresse att göra några jämförelser med resultaten från vår studie och de mest in-tressanta studierna. Därför gjordes en jämförelse med dessa resultat separat. Denna utök-ning av den svenska versionen av studien finns i Appendix 1. Studier utförda av MIT, GM och en tysk studie ansågs som de mest intressanta, även om slutrapporten inte fanns till-gänglig ännu i det sista fallet. Ett antal andra studier har också diskuterats.
Metodik och förutsättningar
Generellt kan man konstatera att en jämförelse mellan resultat från olika studier är vansklig eftersom förutsättningar och antaganden varierar kraftigt. De flesta studierna verkar ha haft ambitionen att beskriva ett scenario på minst medellång sikt, 2005-2020, och har en fo-kusering på huvudbränslen som kan kommersialiseras i stor skala. Alla studier har inte
kunnat upprätthålla denna ambition fullt ut. Långsiktig hållbarhet har bara diskuterats av några få.
De antaganden som gjorts för fordon och drivsystem verkar skilja sig åt påtagligt i flera fall. För det mesta har ett vidareutvecklat eller avancerat (framtida) fordon med förbätt-ringar av drivsystemet, och som dessutom ofta utnyttjar möjligheterna till hybridisering, varit gemensamma förutsättningar för de flesta studierna. Jämförelser av den relativa vik-ten för fordonen i MIT och Ecotraffic studierna visade en rimlig överensstämmelse i de flesta fall. Fordonens räckvidd och antaganden för drivsystem och energiomvandlare kan förklara de flesta av skillnaderna. I några fall uppvisar kriterierna för fordonens prestanda stora skillnader mellan olika studier, även om de flesta studierna har valt att försöka hålla accelerationen konstant.
Drivsystem
Det är trivialt att hävda att system som baseras på dieselmotorer i de flesta studier har vi-sats ha en fördel på 21-24% jämfört med referensfordonet (en utvecklad bensindriven bil med ottomotor). Det är emellertid anmärkningsvärt att ingen studie utom Ecotraffics har närmare försökt analysera alkoholbränslen (framförallt i drivsystem baserade på diesel-motorer), trots den potential de har bland de alternativa drivmedlen och att de kan produce-ras från bioråvara.
Bränsleceller är utan tvekan energiomvandlare med hög verkningsgrad, med vätgas som bränsle mer än 50% bättre än referensfordonet (GM anger >100%). Rättvisande jämförel-ser kan emellertid inte göras utan att ta hänsyn till den energi som används vid tankningen, vilken är hög för vätgas, och detta minskar fördelen till ”endast” omkring 25%. När också produktion och distribution tas hänsyn till minskar fördelen ytterligare. Bränslen som krä-ver en reformering i fordonet måste inkludera detta steg i drivsystemet, vilket minskar för-delen vad gäller verkningsgraden till 18-22% (högst för metanol) i Ecotraffics studie. GM anger högre värden för både bensin och alkoholer. Den stora skillnaden mellan den bensin-drivna (nafta i ett fall) bränslecellfordonen i MIT och GM studierna kan noteras.
Hybridisering verkar generellt öka effektiviteten för drivsystemen. Förbättringspotentialen är åtminstone 20-24% för förbränningsmotorer och en studie (MIT) har visat en ännu hög-re skillnad. Potentialen för hybridisering av drivsystem baserade på bränsleceller är 6-12% och verkar därför något mindre än i det förra fallet.
Systemverkningsgrad
CNG/LNG baserade system ligger bra till på grund av de låga energibehoven för att om-vandla naturgas till en kvalitet för rörtransport (och till LNG), förutsatt att storskaliga dist-ributionssystem finns tillgängliga. Vätgas från naturgas är också ett effektivt alternativ på grund av den höga verkningsgraden för bränslecelldrivsystemet. Beroende på valda förut-sättningar kan även DME och metanol vara alternativ med hög verkningsgrad.
Även om vissa drivmedel i gasform (metan och vätgas) kan ha en hög verkningsgrad enligt flera studier har de också blivit beaktade som nischbränslen (även om viktiga sådana) i många studier. DME är enklare att hantera och har nästan samma verkningsgrad med na-turgas som råvarubas. LNG och LH2 är flytande alternativ men, eftersom de är kryogeniska
bränslen, medför de nackdelar som ökade kostnader, och i det sista fallet även en minsk-ning av verkminsk-ningsgraden. Metan har nackdelen att det inte verkar finnas någon effektiv
metod att producerad den från biomassa (i stor skala). Flytande bränslen som enkelt kan hanteras som bensin och dieselolja i dag kommer att ha en stor fördel i effektivitet vid dist-ribution och tankning och tillåter att allmänheten kan behålla sina vanor för tankning av fordonen. Av de icke-kryogeniska flytande bränslena verkar metanol vara det bränsle som ger den högsta verkningsgraden. Vid beaktande av dessa fakta verkar det förvånande att detta drivmedel inte har studerats mer noggrant.
Långsiktig hållbarhet
För att kunna behålla kolvätebaserade råvaror i ett scenario med stora reduktioner av växt-husgaser torde deponering av CO2 i jordskorpan vara nödvändigt och det har ofta ansetts
att detta inte är någon omöjlighet. Den oundvikliga konsekvensen är emellertid att detta nödvändiggör ett distributionssystem för vätgas, vilket vi inte kan se som ett generellt framtida system för allmän användning (se ovan). För att minska växthusgaserna med i storleksordningen 80-90% har endast biomassebaserade bränslen en sådan potential, vilket också visats i flera av studierna.
Diskussion och slutsatser
Som sammanfattning av resultaten från denna studie kan man säga att det inte är trivialt att hitta någon definitiv “vinnare” bland de 3-5 främsta kandidaterna till drivmedel. Däremot är det lättare att utesluta något alternativ där systemverkningsgraden är förhållandevis låg. Vätgas från el är ett sådant fall.
Det förtjänar också att nämnas att det finns ett flertal olika kriterier för val av drivmedel som inte berörts i denna rapport. Ett mycket viktigt kriterium är t.ex. kostnaden för pro-duktion, distribution och användning. Sådana analyser har emellertid legat utanför ramarna för denna studie.
fficiency 3 AB Octo ber 20 01 xx
Tabell S-1. Relativ systemverkningsgrad för system baserade på råolja och fossil
DRIVMEDEL, tankat Bensin Dieselolja DME Metanol Etanol FT-brän CNG CNG GH2 GH2 GH2 GH2 GH2
DISTRIBUERAT som Bensin Dieselolja DME Metanol Etanol FT-brän CNG LNG GH2 LH DME Metanol El
Drivsystem Systemverkningsgrad för råolje-/fossilgasbaserade system relativt den för konventionell bil med bensindriven ottomotor (=100)
Dieselmotor - hybrid 150,7 120,2 115,4 94,3 Bränslecell - hybrid 115,3 113,2 81,5 128,8 126,6 116,1 81,9 91,7 93,0 68,8 Bränslecell - direkt 107,8 107,5 78,5 124,1 122,0 111,9 78,9 88,4 88,3 66,3 Ottomotor - hybrid 124,0 109,5 128,1 125,9 90,1 63,5 71,2 70,0 53,4 Dieselmotor – konv. 125,0 99,7 95,7 78,2 DMFC - hybrid 93,8 Ottomotor – konv. 100 88,3 104,5 102,7 73,5 51,8 58,1 57,1 43,6
Tabell S-2. Relativ systemverkningsgrad för biomassabaserade system
DRIVMEDEL, tankat Bensin Dieselolja DME Metanol Etanol FT-brän CBG SNG GH2 GH2 GH2 GH2 GH2
DISTRIBUERAT som Bensin Dieselolja DME Metanol Etanol FT-brän CBG SNG GH2 LH DME Metanol El
Drivsystem Systemverkningsgrad för biomassabaserade system relativt den för konventionell bil med bensindriven ottomotor (=100)
Dieselmotor - hybrid 92,5 87,7 76,1 73,5 Bränslecell - hybrid 88,7 86,0 71,2 65,4 71,6 67,6 90,9 78,6 72,4 72,8 58,4 Bränslecell - direkt 82,9 81,6 67,6 62,1 69,0 65,2 87,6 75,8 69,7 69,1 56,3 Ottomotor - hybrid 83,1 70,7 71,2 67,3 70,5 61,0 56,1 54,8 45,3 Dieselmotor – konv. 76,7 72,7 63,1 61,0 DMFC - hybrid 71,2 Ottomotor – konv. 67,0 57,0 58,1 54,9 57,5 49,8 45,8 44,7 37,0
1 INTRODUCTION
The interest in alternative fuels, and biofuels in particular, appears to be increasing due to the ever-increasing problems associated with the emissions of climate gases from road traf-fic. Eventually, the fossil fuels will also be exhausted and the question is no longer if than
when this will happen. In principle, the fossil fuels will not be exhausted but the cost of
exploitation of the resources will become prohibitively high. A scenario of this kind is of course very far in the future (~50 years) and consequently, the present generation will not be particularly affected by these problems.
Alternative fuels are also of interest regarding the energy supply in order to be prepared for a crisis situation. This could refer to smaller crises as, e.g. a crisis related to political rea-sons, such as a war in the Middle East. Longer and deeper crises are also likely to occur emerging from a demand that is higher than the production capacity. Under such as sce-nario – that presumably should be referred to as a price crisis – will of course lead to an increase in the fuel price until demand and supply meet. During 2000 and part of 2001 such a crisis (though relatively mild) was experienced. The energy crisis that were seen twice in the 1970’s, the first in the beginning of the 1970’s and the second in the later part of that decade, could also be regarded to be of this character. In the relative near term (this decade), larger crisis of this kind might be expected since the production capacity, and not the energy resources, are the problem. Calculations show that the current production rate can only be increased up to a certain maximum level. The production (pumping rate) from an oil well simply cannot be increased more than up to a certain level without interruptions in the production. This is due to the physical limitations in the oil containing layers in the bedrock, which in this case sets the maximum production rate (with current technology). A similar scenario, as described above could, according to reliable calculations, occur already between 2010 and 2015. The result of this crisis could be significantly increased cost and/or a temporary lack of crude oil and oil products with a corresponding risk for a de-cline in the world economy. An interesting study that elaborates these problems in more detail is a report by US Department of Energy (DOE) and several of its national laborato-ries and other organisations [1]2. Although, at this date (September 2001), the report is only available as a draft report, it is plausible that the report, and the subsequent studies that are planned, will have a significant impact on the energy policy in the USA.
Due to the reasons mentioned above, it could be strategically advisable (to secure the en-ergy supply) and economically profitable (bearing in mind the international competition) to invest in an increased knowledge in this area. In a somewhat longer perspective, the in-vestment in production and distribution capacity for alternative fuels might be an issue to consider.
In the debate about alternative fuels, the question about which fuel is the best is frequently asked. The alternative fuels can be divided into two different categories. The first category is fuels produced from fossil feedstock and the second category is fuels produced from biomass. Even if many countries in Europe, and the Nordic countries, such as Sweden in particular, have a surplus of biomass, the same conditions do not exist for all countries. There is also a competition about the biomass on a local level and likewise, it is not eco-nomically feasible to collect all available biomass (e.g. such as remote biomass). However,
the competition regarding the available biomass is not so though as it seems, since the pulp and paper industry and the energy sector do not have the same demands (fibres contra en-ergy). In summary, the limitations imposed as described, implying that the commercially available biomass would be substantially lower than the theoretically possible.
Since the automotive and fuel industries are international, it is not plausible that Sweden, or any other country in Europe, would be able to introduce a fuel on a large scale that is not used in the rest of the world. Consequently, this reality imposes several limitations on the near-term fuel candidates. A possibility to broaden the feedstock base for new fuels would be if fossil, in addition to non-fossil, feedstock could be used.
A very important factor in the choice between fuels will be the total efficiency for the complete system (on a well-to-wheel basis). This is usually referred to as a life-cycle per-spective. The distinction in this study is though, that the vehicle production and the scrap-ping of the vehicles have not been taken into account. The reason for that these stages have been omitted is twofold. First, the energy use in these stages is relatively small in compari-son to the fuel energy used. Second, no significant differences could be expected between the various powertrains investigated in this study. It has been of interest to elucidate the differences between the options but not necessarily the absolute level.
In addition to the factors mentioned above, cost is the most important factor to consider. However, in order to impose some limitations on the volume of the work, this factor has been omitted from the study. An expansion of the work reported here could be added later where this is taken into account.
The scope of the work reported here has been to elucidate the system efficiency for alter-native fuels, taking into account that this comparison is to be carried out according to a simplified life-cycle perspective. In order to be able to consider future improvements in the processes for fuel production and distribution of the fuels for the least developed fuels, it is necessary to use a reasonably long time horizon for the study. A scenario that could occur between 2010 and 2015 has been chosen as a realistic timeframe. The real outcome will, of course, be dependant on a number of various factors – among them e.g. political decisions – but what was important in this study, was to show the technical possibilities that might be applicable in the future. In view of the large number of combinations studied, it should be noted that, in practice, only a few of them would be commercially exploited in the fu-ture. Obviously, there is no need either to develop options that have considerable draw-backs. By using the results generated in this study, it will be possible to make rough as-sessments between the various alternatives (i.e. excluding the least favourable alternatives) and consequently, this has been the main goal of the study.
In order to provide a better overview of the main results, short summaries has been made in special summary boxes (see example below) in the main chapters.
In the summary boxes a synopsis of the conclusions that can be drawn from the results generated in this study, or the results from other studies cited, is made.
2 BACKGROUND
In the past, Ecotraffic has carried out several studies of relevance to the work reported here. The first, and probably the most important study that could be mentioned in this re-spect is the life-cycle analysis, “Life of Fuels” (in the following abbreviated LoF), which was one of the first more comprehensive studies in this area [2]. Several of the fuel and powertrain combinations assessed in the present study were also studied in the LoF study. Within the framework of an earlier work for the Swedish Communications and Transpor-tation Research Board (KFB), and with some additional internally funded work, the com-putational model used in the LoF study3 has been implemented in MS Excel [3]. Conse-quently, alterations can now be made considerably easier than before. In general, it can be stated that input data and results from the study regarding fuel production and distribution still are reasonably valid for some fuels, whereas additional work is needed for other fuels. However, data for vehicle energy use and exhaust emissions are outdated. In a report that Ecotraffic carried out for KFB, the impact on environment and health were investigated [3]. Some prognoses for exhaust emissions from various fuels were also made in that re-port, which gives some guidance for the assumptions made in this report. A more general report about alternative fuels commissioned by the Swedish EPA [4], and report carried out for MTC [5, 6] have also been useful as the basis for this study.
The Swedish National Energy Administration (STEM) and its predecessors4 in the field of energy research have been responsible for the governmental support in the field of re-search, development and demonstration regarding energy supply and energy use. Among the incentives made by STEM, a multiyear support for research and development in the area of ethanol production from cellulosic matter could be mentioned. Similar support for developing production methods for methanol from biomass has also recently been dis-cussed by STEM. Support for production of biogas has also been granted and a continuous support in this area by STEM and other authorities can be anticipated in the future. In ad-dition to the support for the production of biofuels, STEM has also granted support for re-search, development and demonstration in fields as increased energy efficiency, new drivetrain concepts, etc.
The Swedish governmental agency KFB had a 6-year program (1992-1998) with the aim of demonstrating the use of biofuels, the so-called Biofuels programme. Similar support has also been granted for electric and electric hybrid vehicles in a separate programme. The new Governmental Agency Vinnova, which was created in 2001 through the merger of KFB with several other governmental agencies, is likely to continue these efforts.
Several other incentives and support in the area of alternative fuels and powertrains of in-terest in this respect could also be mentioned, but have been left out in this summary. Some of these measures have also included fossil alternative fuels, such as e.g. natural gas. No overview of these programmes and projects will be made here but it is worth mentioning that there is some documentation available that could be referred to if there is an interest in these fields.
In summary, it can be that concluded that considerable efforts have been made in this area in Sweden. For example, Stockholm has the largest fleet of ethanol-fuelled buses. A
3 The calculations in the LoF study were carried out without any computer spreadsheet. 4 Previous Swedish governmental agencies in this field were NUTEK and STU.
nology procurement of about 3 500 fuel-flexible cars has been made and the delivery of these vehicles will start in the fall of 2001. The result of these efforts will be that Sweden will have one of the largest fleets of this kind of vehicles in the world5. An important
in-gredient, which is still missing, is an introduction strategy for alternative fuels in Sweden. A decision on this important matter could provide vastly improved conditions for long-term investments in alternative fuels. The reasons why this strategy is still missing is sub-ject to speculation but the opinion of the authors is that the necessary documentation for such a strategy is still not comprehensive enough for the development of a detailed plan. The rules and regulations within the EU are also potential barriers of non-technical char-acter that could be problematic in this respect. It is conceivable that this type of regulations will be at least as difficult to change as it will be to find solutions to the technical problems that still are unsolved.
The work described in this report has been carried out for the Swedish National Road Ad-ministration (SNRA). In the spring of 2001, a Swedish version of the report was published. Due to the considerable interest the report, it was decided to make an English version6. This version also contains a comparison with some findings in reports that have been pub-lished lately on this subject (see Appendix 1). The main scope of the present work has been to address some of the issues described above.
5 One could add that the number of FFVs in the USA is significantly greater but on the other hand, many of
these vehicles are running on petrol
6 Two minor errors have been found in the previous Swedish version of the report and corrections have been
made in this report. First, there was a small numerical error regarding hydrogen produced from electricity. Second, there was an error in Figures 8 regarding the results for LH2, since a direct drive fuel cell had been
3 METHODOLOGY
The scope of the study was to generate data that could be used to make a rough ranking between the selected alternative motor fuels based on the well-to-wheel efficiency for the total system. The definition used by the authors for this efficiency is the efficiency in the full fuel cycle from the production of the feedstock for the fuel to the end use in the vehi-cle. As mentioned before, the production, scrapping, maintenance etc. of the vehicle is not included in the analysis.
The strategy in the study has been to, in as many cases as could be applicable, use results from earlier studied and data that has been collected earlier. Such examples are life-cycle analyses, strategies for the introduction of new motor fuels, studies on vehicle technology, and so on. However, the collection of new data has also been necessary in several cases. Through literature search in databases, the essential literature has been found and subse-quently ordered from the publishing organisations.
In the case of the efficiency of various powertrain concepts, the primary problem is that data in the literature in general is based on different presumptions in various studies. Con-sequently, it is difficult to make correct comparisons based on using available data. The vast number of variations for the technology used add further complication and this high-lights the difficulties of comparing data from different studies. Instead of attempting to collect and assess all this information, another approach has been used. The simulation software Advisor®, release 3.07 (an application in Matlab/Simulink™) from the US Na-tional Laboratory NREL has been used to simulate the energy use for the various power-train and fuel combinations. The necessary input data have been collected from this pro-gramme and from other sources in the literature. In addition, some careful considerations of the authors have been used to make some modifications when necessary.
3.1
Timeframe
The choice of timeframe for the analysis is a very important consideration for a study of this kind. First, it is essential that the technology for production, distribution, end use etc. must be fully developed for the alternative fuels in order to make the comparison as neutral as possible. Unless this approach is used, the comparisons will not be relevant. Undoubt-edly, this implies that the comparison have to be carried out for future systems, as many of the combinations studied are not fully developed yet. Certainly some of the systems could be compared on the present commercial level, e.g. such as vehicle emissions, but to make the comparison more relevant, a future perspective is essential. The time horizon of 2010 to 2015 has been chosen due to two main reasons. First, the timeframe is not distant enough to preclude extrapolations of known technology and the presumed commercialisa-tion of advanced research results. Second, the timeframe must be set distant enough to al-low a relevant comparison of mature commercial systems according to the discussion above. This is of relevance for, e.g. several biofuels, where the production technology is not fully developed today. An example is the previously cited LoF report [2], where sev-eral of the production processes had to be regarded as technologies that were not fully
7 After the simulations were carried out, version 3.1 was released and the current version of Advisor®, as this
veloped at that time. In the present study, we have of course taken into account that these production processes will be further developed in the future and that the processes antici-pated will be possible to commercialise within the timeframe foreseen.
In Europe, the present situation is that emission limits for passenger cars have been set for a time horizon of 2005/2006 (Euro IV). In the USA and in California, the limits are more far-reaching8. In view of these limits, it is likely that the future emission limits in Europe will be more stringent as well. It is also likely that the difference in emission limits be-tween fuels (petrol and diesel fuel) will become smaller or diminish, as in the USA. Con-sequently, the difference in emission level (in absolute levels) between various engine/fuel combinations will be of less importance in the future. This is of course on the condition that it will be possible to meet the emission limits from a technical standpoint and that this could be made at a reasonable cost. However, with the timeframe of the study, the authors
have not been able to conclude that this would be impossible for any of the engine/fuel combinations assessed.
3.2
Literature survey
Since a couple of years, Ecotraffic has had access to the “Global Mobility Database” (GMD) from SAE, which is a very valuable tool in this kind of work. The database con-tains abstracts and biographies from more than 105 000 papers and articles published by SAE, its sister organisations world-wide and other partners of SAE. The GMD database is available in two versions, one on CD-ROM and the other with Internet access. Ecotraffic use the latter version, since it has a decisive advantage due to the monthly update instead of a yearly update for the former version. As SAE is an organisation for engineers in vehi-cle technology, the database is dominated by literature within this area. However, some literature on the production of fuels and on life-cycle analysis is also available. These areas have received an increased interest during the past years.
Besides the SAE database, other literature sources must also be used, since this area is somewhat broader than the main focus of the database. Therefore, a limited search has been made at organisations that are active in this area. This search has mainly been per-formed on the Internet. Literature of basic interest has been the literature used as input data for similar studies as the one reported here.
3.3
Literature evaluation
A comprehensive summary of the literature found in the search has not been made, since this work could not be accomplished within the limitations of the study. Instead, the most important studies that have been used as input data for the calculations have been cited. Assessments and considerations of the authors have been made in the cases where the input data have been scarce or missing. Comments about these estimates have been made when necessary.
3.4
Lifecycle perspective
The production processes for some the alternative motor fuels, bio-based fuels in particu-lar, still are underdeveloped. In extreme cases, production schemes for bio-fuels may even lead to increases of emissions of greenhouse gases. Such schemes, which have often been implemented by agri-political reasons, have lead to an undeserved bad reputation for bio-fuels. Such projects had probably not been implemented if adequate knowledge had been available before the decisions were taken. It is therefore important to improve the proc-esses to attain commercial status.
3.4.1 Feedstock production
Crude oil and natural gas (fossil gas) have been formed from dead plants and marine or-ganisms. The energy use to exploit these resources is thus limited to exploration and re-covery. Moreover, crude oil as liquid (sometimes after heating) can be easily transported in bulk. This is also a condition required for the comprehensive world trade of the feedstocks. The conditions are, of course, entirely different for bio-feedstocks. The highest efficiency in the production is attained by extensive cultivation while intensive cultivation (farming) by definition is worse in this respect. Conventional forestry (silviculture) exemplifies ex-tensive cultivation and SRF (short rotation forestry) takes an intermediate position to farming. These lignocellulosic feedstocks are more difficult to convert to motor fuels than for example feedstocks from fatty oil plants (to RME) or sugar and starch containing plants (to ethanol). The transport of the bio-feedstocks to conversion plants naturally is more cumbersome and expensive compared to crude oil. It might be of some advantage if con-version plants could be situated to minimise transports from the cultivation areas compared to remote oil fields.
3.4.2 Production processes
During millions of years, crude oil has been converted in the crust of the earth to a compo-sition that allows conversion (refining) to motor fuels (and other products) in an efficient way. For example, petrol can be produced with an efficiency of around 80% (crude oil re-covery included) and diesel oil with around 90% efficiency.
One reason for the relatively low efficiency in the production of many alternative motor fuels is the lower system efficiency of the conversion process compared to the conven-tional fossil fuels. The background is that the conversion of, for example, a bio-feedstock is more far-going in a process chain that is more energy demanding than the refining of crude oil, and the production of the feedstock itself requires energy. Crude oil can be con-sidered as an intermediate conversion product from the alterations of the virgin raw mate-rial in the crust during millions of years that is favourable at the following refining. Moreover, in several of the process steps in the production of bio-fuels, fossil auxiliary fuels may be used. These may be replaced by bio-fuels but the basic problem with low ef-ficiency in the entire process chain remains. Simply put, low efef-ficiency in the production leads to lower yield of motor fuel and less fossil fuel can be replaced. It therefore is as im-portant to have as high system efficiency for alternative motor fuels as for the conventional motor fuels. An exception from low efficiency is illustrated by rapeseed-oil-methyl-ester, RME (and other fatty acid products), for which the production mainly involves only a re-esterification of primary oil obtained by mechanical pressing. The disadvantage for RME