Mapping evapotranspiration with the remote sensing ET algorithms
METRIC and SEBAL under advective and non-advective conditions:
accuracy determination with weighing lysimeters
Mcebisi M. Mkhwanazi1, José L. Chávez
Civil and Environmental Engineering Department, Colorado State University
Abstract. The Surface Energy Balance Algorithm for Land (SEBAL) is one of several remote sensing-based crop evapotranspiration (ET) models. One advantage that SEBAL has is its minimal requirement for ground-based weather data. However, its downside is that in the presence of advection it may underestimate ET. This is due to the use of a fixed evaporative fraction (EF) for the entire day. The EF value is used to extrapolate instantaneous ET to daily ET values, based on the assumption that EF at the time of satellite overpass is the same (remains constant) as for the rest of the day, and therefore can be used to estimate daily ET. METRIC on the other hand, uses the reference ET fraction ETrF, which is a ratio of actual crop ET to alfalfa reference ET. A study was therefore carried out to compare these two models under advective and non-advective conditions. A total of 9 Landsat 7 ETM+ images (2010-2012) were processed using both models, and ET was estimated for two alfalfa fields near Rocky Ford in Eastern Colorado. Both fields were equipped with precision monolithic weighing lysimeters. The remote sensing estimated daily ET was compared with lysimeter-based ET measurements. Results showed that there were larger errors in SEBAL than in METRIC, with errors up to 45 % for the former and up to 25 % for the latter. The largest errors occurred on windy and hot days when there was advection.
1. Introduction
Several remote sensing (RS) models have been developed to estimate
evapotranspiration; SEBAL (Bastiaanssen et al., 1998), METRIC (Allen et al., 2007), Remote Sensing of Evapotranspiration (ReSET; Elhaddad and Garcia, 2008), Analytical Land Atmosphere Radiometer Model (ALARM; Suleiman et al., 2009), Surface
Aerodynamic Temperature (Chávez, et al., 2005), and many other methods. Most RS models use the land surface energy balance equation.
Rn = LE + G + H (1) where Rn is net radiation, LE is latent heat flux, G is soil heat flux and H is sensible heat flux. When using satellite imagery, the sensed surface radiances are converted into surface properties such as albedo, vegetation indices, surface emissivity and surface temperature. These products are used to estimate the various components of the surface energy balance in equation 1 (Gowda et al., 2011).
SEBAL is capable of estimating ET without prior knowledge of the soil, crop and management conditions (Bastiaanssen et al., 2005). METRIC is a modification of SEBAL and is based on the same principles, and both make use of the near surface temperature
1 Civil and Environmental Engineering Department Colorado State University
Fort Collins, CO 80523 Tel: (970) 818-1159
Email: mcebisi.mkhwanazi@colostate.edu
gradient (dT) function as proposed by Bastiaanssen (Singh et al., 2008). As mentioned, the algorithms used in METRIC for Rn and G are similar to those used in SEBAL (Allen et al., 2005). The two models differ in the calculation of H, and also in the extrapolation of ET from instantaneous to daily values (Allen et al., 2005). A detailed description of the Rn, G and H algorithms can be obtained from Tasumi et al. (2005).
On the difference in the extrapolation of instantaneous ET to 24-hr ET, SEBAL uses evaporative fraction (EF) which is defined as the ratio of LE to available energy (AE), where AE is net radiation less soil heat flux (Rn – G). This ratio is assumed to be constant throughout the day, so the EF determined at time of overpass would be used as for the whole day. This assumption has been accepted and generally used (Nichols and Cuenca, 1993; Crago and Brutsaert, 1996; Gowda et al., 2008; Suleiman et al., 2009). However, Gentine et al. (2007) showed that EF is rarely constant; stating that daytime EF has a typical parabolic shape and the assumption of a constant EF does not hold especially with windy and warm conditions. Such an assumption may result in larger errors when using SEBAL under advective conditions.
Instead of EF, METRIC uses the alfalfa evapotranspiration fraction (ETrF). This fraction is defined as the ratio of the actual crop ET to ETr (ETr being alfalfa reference ET). It is also assumed to be constant throughout the day, yet capable of capturing the changing weather conditions (e.g. wind, cloud cover) during the day. The extent to which METRIC through the ETrF function captures the effects of advection depends on the responsiveness of the Penman-Monteith equation to advective conditions, as it is the method used to determine ETr.
1.1 EF self-preservation
Stewart (1996) as cited in Lhomme and Elguero (1999) points out that using EF constancy as an extrapolation method may be erroneous in some cases. In his study, he mentions that in fair-weather, EF has a typical concave-up shape during the day, with the EF in central hours of noon lower than the daytime average. He also states that soil water content, incoming short wave solar energy, and to some extent saturation vapor pressure deficit influence the EF constancy. Gentine et al. (2011) observed that EF was only constant for values of higher relative humidity, implying that a constant EF would apply better in humid than arid and semi-arid conditions. Suleiman et al. (2009) on a particular day, in Blythe, California, found EF to be fairly constant at 1.08 from 7 am to 2 pm then it increased until it reached 1.35 by 7 pm. According to Lhomme and Elguero (1999), the non-constancy of diurnal EF has been observed under calm conditions, and stressing that in conditions of advection, the results may be worse.
This paper therefore discusses the accuracy of SEBAL and METRIC under advective and non-advective conditions. This will be achieved by comparing the modeled ET values with measured ET using a precision monolithic weighing lysimeter in eastern Colorado.
2. Materials And Methods 2.1 Study area
This research was carried out at the Colorado State University (CSU) Arkansas Valley Research Center (AVRC) near Rocky Ford, in eastern Colorado. The area has geographic coordinates 38° 02 'N, 103° 41' W, with an elevation of 1,274 m above mean sea level (amsl). The area receives an average annual precipitation of about 300 mm, with 65 %
falling in May through September. The summer average temperature is 23.6 °C, and the average daily maximum is 33 °C. The average relative humidity in the mid-afternoon is 25% in summer, and average wind speed is 4.4 m s-1
(www.wcc.nrcs.usda.gov/ftpref/support/climate/soil.../mlra-‐69.doc).
The field of study is planted to alfalfa which is irrigated with furrow irrigation system using siphons and a head ditch. The field is 160 m by 250 m. Close to the center of the field is a large monolith weighing lysimeter (3 m x 3 m x 2.4 m). The field is also equipped with a net radiometer (REBS, CSI, Logan, Utah, U.S.A.). There is also an infra-red
thermometer (IRT, Apogee model S1-111, CSI, Logan, Utah, U.S.A.) to measure crop radiometric surface temperature. Soil heat plates (REBS model HFT3, CSI, Logan, Utah, U.S.A.) are buried in the ground at locations proximal to the measurements of net radiation with depth of about 10 cm, along with soil temperature and soil water content sensors, for the estimation of soil heat flux.
2.2 Landsat Satellite Datasets and Processing
Landsat 7 Enhanced Thematic Mapper Plus (ETM+) cloud free satellite images were downloaded from the USGS Earth Explorer site
[(http://edcsns17.cr.usgs.gov/NewEarthExplorer/)] for the 2010-2012 growing seasons. The acquisition dates were as follows: July 1, August 2, August 18, September 19 and October 5 for 2010, then July 4, August 5 and August 2 for 2011, then June 20 for 2012. The images were processed using the ERDAS Imagine 2010 software (ERDAS, Norcross, Georgia, U.S.A.).
2.3 SEBAL and METRIC ET24 Algorithms
In both methods, when Rn, G and the final value of H have been established, the latter after an iterative process to consider atmospheric stability effects, LE is then calculated as a residual. This is the energy equivalent of the instantaneous ET at the time of satellite overpass. Then the evaporative fraction (EF) for each pixel is calculated where:
EF = !"
!"!! (2)
All the fluxes are instantaneous. Since this fraction is assumed to remain constant throughout the day, it is then used in the extrapolation of LE obtained for short periods to daily values, therefore giving the daily ET to be:
ET24 = !",!""×!"×(!"! !"!!!") (3) The 86,400 is conversion from seconds to a 24 hour day. Rn24 is the average net radiation for the day; λ is the latent heat of vaporization used to convert the energy to mm of evaporation and is a function of temperature. G24 is assumed to be zero for vegetation and soil surfaces.
METRIC on the other hand determines the ratio of the actual ET to ETr at short time-step (ETrF), and then estimate the 24-hr ET by multiplying ETrF by ETr for the day, the latter obtained by summing up hourly reference ET.
2.4 Data Analysis
To measure the performance of these models under varying advective conditions, the model error was determined for each date. The model error was calculated as the predicted (model) ET minus the measured ET (from lysimetric data). A positive error means the
model is overestimating and a negative error means the model is underestimating. Then daily averages of Rn, G and LE were determined. These were obtained using the net radiometer, soil heat flux plates and lysimeter installed in the field. The sensible heat flux (H) was then calculated as a residual using the energy balance equation. A relationship was then established between the H values and the model errors to determine the coefficient of determination (R2). Another relationship established was between H and advective
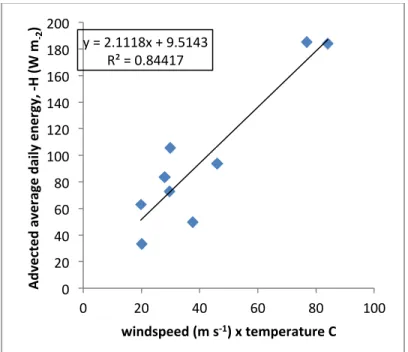
indicators; in this case wind and temperature were used, to determine any correlation between the H and the advective indicators.
3. Results And Discussion
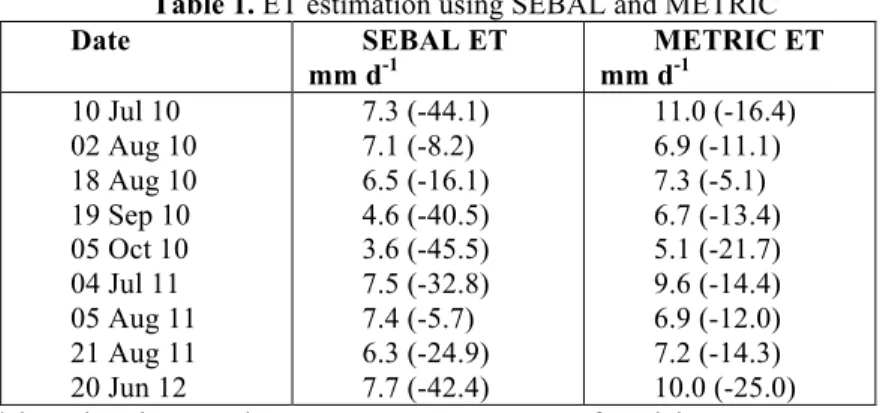
In general, METRIC performed better than SEBAL, although both underestimated ET in all cases, with the latter underestimating significantly more. According to results
presented on Table 1, when using SEBAL, the error ranged between 5 and 46 %, averaging 29%, while the error ranged from 5 to 25% for METRIC and averaged 15 %. These errors seem too large when compared to previous experiments. Singh et al., (2008) only observed an error of up to 28 % for SEBAL, and attributed such larger error to advection, otherwise on average SEBAL estimated within 5 % of the measured ETc.
Table 1. ET estimation using SEBAL and METRIC
Date SEBAL ET mm d-1 METRIC ET mm d-1 10 Jul 10 02 Aug 10 18 Aug 10 19 Sep 10 05 Oct 10 04 Jul 11 05 Aug 11 21 Aug 11 20 Jun 12 7.3 (-44.1) 7.1 (-8.2) 6.5 (-16.1) 4.6 (-40.5) 3.6 (-45.5) 7.5 (-32.8) 7.4 (-5.7) 6.3 (-24.9) 7.7 (-42.4) 11.0 (-16.4) 6.9 (-11.1) 7.3 (-5.1) 6.7 (-13.4) 5.1 (-21.7) 9.6 (-14.4) 6.9 (-12.0) 7.2 (-14.3) 10.0 (-25.0) *the values in parentheses are percentage errors of models
In Table 1, all the percentage errors are negative a consistent underestimation of ET by both SEBAL and METRIC although to a lesser degree with METRIC. The range of errors in METRIC is unexpected, as according to Tasumi et al. (2005), the effect of advection should be incorporated into the ETr value, which is determined based on local weather data.
An attempt to determine the source of error, especially in SEBAL was made by relating advected heat flux to the observed daily errors. Using the lysimeter ET results, and the observed Rn and G, an energy balance equation was used to obtain H. In all cases, LE exceeded the available energy (Rn-G), therefore giving a negative H. This is a reasonable occurrence seeing that the days selected for study were days when the alfalfa was not short of water, with the instantaneous EF being at least 0.95, and the irrigated areas in Rocky Ford are surrounded by a vast dry area. Figure 1 suggests that the errors incurred using SEBAL are strongly correlated to the negative H values obtained using the energy balance equation based on data collected at the lysimeter (R2 = 0.96) which suggest that the errors were largely due to advection.
To further indicate the presence of advection, a relationship was drawn between the H (negative assumedly because of advection) and the product of wind and temperature, parameters that De Bruin et al. (2005) referred to as advection indicators. An R2 of 0.84 in Figure 4 to some extent supports the assumption that the H values shown on Figure 3 and in extension the SEBAL model errors are as a result of advection.
Figure 1. Relationship between advected energy and model error
Figure 2. Relationship between the product of wind speed and temperature and advected heat energy y = 0.0354x -‐ 0.5791 R² = 0.95514 0 1 2 3 4 5 6 7 0 50 100 150 200 SE BAL m od el e rr or (m m d -‐1)
Advected average daily energy, -‐H (W m-‐2)
y = 2.1118x + 9.5143 R² = 0.84417 0 20 40 60 80 100 120 140 160 180 200 0 20 40 60 80 100 Ad ve ct ed a ve ra ge d ai ly e ne rg y, -‐H (W m-‐2 ) windspeed (m s-‐1) x temperature C
4. Conclusions
In this study, METRIC generally performed better than SEBAL, with the latter model having significantly larger errors under windy and warm conditions which indicated advection. METRIC, due to the ETrF function capable of incorporating the effects of advection had smaller errors.
Acknowledgments. This study was possible thanks to the support of Colorado State Agricultural Experiment
Station and Fulbright. We also want to thank the following individuals for their collaboration in the project: Lane Simmons, Dale Straw, Abhinaya Subedi and Dr. Allan Andales.
References
Allen RG, Tasumi M, Morse A, Trezza R, 2005: Satellite-based evapotranspiration by energy balance for Western states water management. Proceedings of World Water and Environmental Resource Congress: Impacts of Global change. ASCE.
Allen RG, Tasumi M, Trezza R, 2007: Satellite-based energy balance for mapping evapotranspiration with internalized calibration (METRIC) model. ASCE J Irrig Drain Eng 133(4):380-394.
Bastiaanssen WGM, Menenti M, Feddes RA and Holtslag AAM, 1998: Remote sensing surface energy balance algorithm for land (SEBAL): 1. Formulation. J. Hydrol., 212-213(1-4), 198-212.
Bastiaanssen WGM, Noordman EJM, Pelgrum H, Davids G, Thoreson BP, Allen RG, 2005: SEBAL Model with remotely sensed data to improve water resources management under actual field conditions. Journal of Irrigation and Drainage Engineering, 131 (1):85-93.
Chávez, J.L., Neale, C.M.U., Hipps, L.E., Prueger, J.H., and Kustas, W.P. (2005). “Comparing aircraft-based remotely sensed energy balance fluxes with eddy covariance tower data using heat flux source area functions.” J. of Hydromet. 6(6),923-940.
Crago RD and Brutsaert W, 1996: Daytime evaporation and the self-preservation of the evaporative fraction and the Bowen ratio. J. Hydrol., 178, 241-255.
De Bruin HAR, Hartogensis OK, Allen RG, Kramer JWJL, 2005: Regional Advection Pertubations in an Irrigated Desert (RAPID) experiment. Theor. Appl. Climatol. 80, 143-152.
Elhaddad A and Garcia LA, 2008: Surface energy balance-based model for estimating evapotranspiration taking into account spatial variability in weather. Journal of Irrigation and Drainage Engineering, 134 (6):681-689.
Gentine P, Entekhabi D, Chehbouni A, Boulet G, Duchemin B, 2007: Analysis of evaporative fraction diurnal behavior. Agricultural and Forest Metereology 143. 13-19.
Gentine P, Entekhabi D, Polcher J, 2011: The Diurnal Behaviour of Evaporative Fraction in the Soil-Vegetation-Atmospheric Boundary Layer Continuum. Journal of Hydrometeorology.
Gowda PH, Chavez JL, Colaizzi PD, Evett SR, Howell TA, Tolk AT, 2008: ET mapping for agricultural water management: present status and challenges. Irrigation Science. 26: 223-237.
Gowda PH, Howell TA, Paul G, Colaizzi PD, Marek TH, 2011: SEBAL for estimating hourly ET fluxes over irrigated and dryland cotton during BEAREX08. World Environmental and Water Resources Congress. ASCE.
Lhomme JP and Elguero E, 1999: Examination of evaporative fraction diurnal behavior using a soil-vegetation model coupled with a mixed-layer model. Hydrology and Earth System Sciences, 3(2):259-270.
Nichols WE and Cuenca RH, 1993: Evaluation of the evaporative fraction for parameterization of the surface energy balance. Wat. Resour. Res., 29, 3681-3690.
Singh RK, Irmak A, Irmak S, Martin DL, 2008: Application of SEBAL Model for mapping
evapotranspiration and estimating surface energy fluxes in South-Central Nebraska. Journal of Irrigation and Drainage Engineering, 134 (3): 273-285
Stewart JB, 1996: Extrapolation of evaporation at time of satellite overpass to daily totals. In: J.B. Stewart et al. (editors) Scaling up in Hydrology using Remote Sensing. Wiley, Chichester, UK.
Suleiman AA, Bali KM, Kleissl J, 2009: Comparison of ALARM and SEBAL Evapotranspiration of Irrigated Alfalfa. 2009 ASABE Annual International Meeting.
Tasumi M, Trezza T, Allen RG, Wright JL, 2005: Operational aspects of satellite-based energy balance models for irrigated crops in the semi-arid US. J. of Irrig. and Drain. Sys. 19:355-376.