Traffic and drowning incidents with
emphasis on the presence of alcohol
and drugs
Kristin Ahlm
Department of Community Medicine and Rehabilitation, Section of Forensic Medicine, Umeå University 2014
Responsible publisher under Swedish law: the Dean of the Medical Faculty This work is protected by the Swedish Copyright Legislation (Act 1960:729) © Kristin Ahlm, 2014
New series No 1662 ISBN: 978-91-7601-095-2 ISSN: 0346-6612
Cover photo: Kristoffer Ahlm
Electronic version available at http://umu.diva-portal.org/ Printed by: Print och Media, Umeå, Sweden 2014
In memory of my grandmother Anse
“All truly wise thoughts have been thought already thousands of times but to make them truly ours, we must think them over again honestly, until they take root in our personal experience”.
Table of Contents
Table of Contents I
Abstract III
Abbreviations IV
Svensk sammanfattning V
Original Papers VII
Background 1
Traffic injuries and deaths 1
Passengers 2
Risk factors 2
Drowning 3
Risk factors 4
Suicidal drowning 5
Definitions and pathophysiology 6
Definition of injury 6
Effects of alcohol and drugs 7
Alcohol 7
Drugs 7
Alcohol and drugs in traffic 8
Alcohol and boating 9
Forensic Medicine 9
Aims 11
Materials and methods 12
Data sources 12
National Board of Forensic Medicine Database (Paper I-IV) 12
Police reports (Paper I) 12
Toxicological analyses (Paper I-IV) 12
Inpatient register (Paper IV) 12
Driver’s alcohol and passenger’s death (Paper I) 15 Alcohol and drugs in fatally and non-fatally injured drivers (Paper II) 15
Drowning deaths in Sweden (Paper III) 16
Suicidal drowning in Northern Sweden (Paper IV) 16
Classification of diseases 17
Classification of pharmaceuticals and illicit drugs 17
Ethical permission and considerations 17
Statistical analyses 18
Results 19
Driver’s alcohol and passenger’s death (Paper I) 19 Alcohol and drugs in fatally and non-fatally injured drivers (Paper II) 21
Suicidal drowning deaths in Northern Sweden (Paper IV) 24
Discussion 26
Prevalence of alcohol in traffic incidents 26
Driver’s alcohol and passengers’ death 26
Fatally and non-fatally injured drivers 27
Young drivers 27
Alcohol consumption and relation to drunk driving 28 Presence of high blood alcohol concentration 29
Drugs 30 Pharmaceutical drugs 30 Illicit drugs 30 Culpability 31 Unintentional drowning 33 Suicidal drowning 34 Prevention 37
Environmental and vehicle/agent factors for traffic injuries and drowning 37
Traffic 37
Drowning 38
Human factors for traffic injuries and drowning 39
Traffic injuries 39
Drowning 41
Suicidal drowning 41
Concluding remarks and future perspectives 42
Acknowledgements 44
Abstract
Worldwide, fatal traffic injuries and drowning deaths are important problems. The aim of this thesis was to investigate the circumstances of fatal and non-fatal traffic injuries and drowning deaths in Sweden including analysis of the presence of alcohol and drugs, which are considered to be major risk factors for these events. Data where obtained from the database of National Board of Forensic Medicine.
In the first study, we investigated 420 passenger deaths from 372 crashes during 1993-1996. There were 594 drivers involved. In total, 21% of the drivers at fault were alcohol positive compared to 2% of drivers not at fault (p<0.001) (Paper I). During 2004-2007, crashes involving 56 fatally and 144 non-fatally injured drivers were investigated in a prospective study from Northern Sweden (Paper II). The drivers were alcohol positive in 38% and 21%, respectively. Psychoactive drugs were found in 7% and 13%, respectively. Benzodiazepines, opiates and antidepressants were the most frequent drugs found in drivers. Illicit drugs were found 9% and 4% respectively, with tetrahydrocannabinol being the most frequent of these drugs (Paper II).
We investigated 5,125 drowning deaths in Sweden during 1992-2009 (Paper III). The incidence decreased on average by about 2% each year (p<0.001). Unintentional drowning was most common (50%). Alcohol was found in 44% of unintentional, 24% of intentional, and 45% of undetermined drowning deaths. Psychoactive substances were detected in 40% and benzodiazepines was the most common substance. Illicit drugs were detected in 10%. Of all drowning deaths, a significantly higher proportion females committed suicide compared with males (55% vs. 21%, p<0.001). Suicidal drowning deaths (n = 129) in Northern Sweden were studied further in detail (Paper IV). Of these, 53% had been hospitalized due to a psychiatric diagnosis within five years prior to the suicide. Affective and psychotic disorders were the most common psychiatric diagnoses. Almost one third had performed a previous suicide attempt. One fourth had committed suicide after less than one week of discharge from hospital. Alcohol was found in 16% and psychoactive drugs in 62% of these cases, respectively.
In conclusion, alcohol and psychoactive drugs are commonly detected among injured drivers and drowning victims, and probably play a role in these events. Most of the individuals that tested positive for alcohol had high blood concentrations, indicating alcohol dependence or abuse. This association warrants further attention when planning future prevention.
Abbreviations
AIS Abbreviated Injury Scale
ATC WHO`s Anatomical Therapeutic Chemical codes BAC Blood alcohol concentration
CNS Central nervous system
ICD International Classification of Diseases
D1 Driver in vehicle where one or more passenger were killed D2 Driver in other car involved in a collision
MAIS Maximum Abbreviated Injury Scale SV Single vehicle
MV Multi vehicle
THC Tetrahydrocannabinol WHO World Health Organization
Svensk sammanfattning
Onaturlig död utgör en betydande andel av dödsfallen både globalt och i Sverige. Trafikskador och drunkning orsakar 7% respektive 5% av onaturliga dödsfall i Sverige. Alkohol, läkemedel och andra droger är en bidragande orsak till dessa dödsfall. En tidigare svensk studie visade att uppskattnings-vis 28% av onaturliga dödsfall var alkohol och/eller drogrelaterade.
Syftet med denna avhandling var att undersöka omständigheterna för dödliga och icke dödliga trafikskador och dödsfall genom drunkning i Sverige, samt förekomsten av alkohol och droger. Uppgifter om de avlidna samt toxikolog-iska data har hämtats från Rättsmedicinalverkets databas.
Trafikskador är ett stort hälsoproblem och förändringar i samhället såsom fler bilar och utbyggt trafiknät kan leda till fler trafikhändelser och person-skador. I Sverige dör ca 300 människor i trafiken varje år varav en femtedel är passagerare i motorfordon. Denna grupp är inte lika uppmärksammad som förarna. För att undersöka relationen mellan avlidna passagerare och alkohol-förekomst hos ansvariga förare undersöktes 420 avlidna passagerare under 1993-1996 i studie I. Medelåldern var 35 år för de avlidna passagerna och 57% var kvinnor. Totalt 594 förare var inblandade i 372 krascher. De flesta passagerare avled på olycksplatsen och 70% av passagerarna hade suttit i framsätet. Av de förare som var vållande till kraschen hade 21% alkohol i blodet jämfört med endast 2% hos förarna som inte var vållande.
Under åren 2004-2007 genomfördes en prospektiv studie med 56 avlidna och 144 skadade förare från norra Sverige (studie II). Uppgifter om de skadade förarna erhölls från Norrlands Universitetssjukhus. I gruppen avlidna förare hade 38% alkohol i blodet jämfört med 21% i gruppen skadade förare. Den högsta andelen alkohol påvisades hos de yngsta förarna och hos förarna i åldersgruppen 50-59 år. Psykoaktiva substanser påträffades hos 7% respektive 13%. Bensodiazepiner, opiater och antidepressiva var de vanligaste substanserna. Illegal narkotika hittades i respektive 9% mot 4%. Tetrahydrocannabinol var den mest förekommande illegala substansen. Drunkning är bland de ledande dödsorsakerna i världen, speciellt bland barn. Internationella studier visar att drunkning är vanligare i låg-inkomstländer, bland barn och bland missgynnande grupper. Internationellt drunknar dubbelt så många män jämfört med kvinnor. I Sverige har antalet drunkningar (enbart dödsolyckor) sjunkit från 356 år 1960 till 92 år 2012.
I studie III undersöktes 5 125 drunkningsdödsfall i Sverige under 1992-2009. Incidensen hade minskat med i genomsnitt ca 2% per år (p<0.001). Oavsiktlig drunkning var det vanligaste dödssättet (50% av alla drunknade). Alkohol visades hos 44% av dem som dött genom oavsiktlig drunkning, hos 24% av dem som begått självmord (suicid) och hos 45% av de individer där det var svårt att avgöra om det var oavsiktlig eller avsiktlig drunkning. Självmord utgör en tredjedel av alla dödsfall genom drunkning i Sverige. Av alla drunkningsdödsfall begick en betydligt större andel av kvinnorna självmord jämfört med männen (55% jämfört med 21%, p < 0,001). Denna observation ledde till att vi genomförde en studie av 129 fall av självmord genom drunkning som inträffat i norra Sverige (studie IV). Tidigare självmordsförsök och vård för psykiatrisk sjukdom undersöktes med hjälp av slutenvårdsregister. Femtiotre procent av individerna hade vårdats på sjukhus på grund av en psykiatrisk diagnos under de senaste fem åren före dödsfallet, varav affektiva och psykotiska störningar var de vanligaste. Cirka en tredjedel hade genomfört minst ett tidigare självmordsförsök. Alkohol fanns i blodet hos 16% och psykoaktiva droger hos 62% av individerna. Endast ett fåtal testades för narkotika och ingen av dessa testade positivt. En tredjedel hade begått självmord inom en vecka efter utskrivning från sjukhus.
För att minska antalet svårt skadade och döda i trafiken på sikt till noll har Trafikverket sedan år 1997 arbetat efter den så kallade ”nollvisionen”. Detta arbete har inneburit flera olika förebyggande åtgärder vilka lett till en klar minskning av döda i trafiken. Många åtgärder rör förbättringar i trafikmiljön och fordonen. Dock sker fortfarande många dödsfall på grund av mänskliga faktorer som risktagande, alkohol och droger. Passagerare skulle kunna spela en viktig roll genom att ingripa och förhindra alkoholpåverkade förare att köra.
En liknande nollvision har lanserats också för drunkning och självmord men det är oklart om den fått samma genomslagskraft. Många självmord genom drunkning är associerad med tidigare vård för psykisk sjukdom och tidigare självmordsförsök vilket pekar på vikten av adekvat eftervård för psykiskt sjuka.
Sammanfattningsvis visar våra studier att alkohol och andra psykoaktiva substanser är ett vanligt fynd bland såväl dödligt och icke dödligt skadade förare som bland drunkningsoffer och drogpåverkan kan ha haft betydelse för dessa händelser. I våra studier hade de personer som testade positivt för alkohol ofta hög blodkoncentration vilket indikerar alkoholberoende eller missbruk. För att undvika dessa dödsfall bör alkoholens roll ytterligare
Original Papers
I. Ahlm K, Eriksson A. Driver’s alcohol and passenger's death in motor vehicle crashes. Traffic Injury Prevention 2006; 7(3):219-23.
II. Ahlm K, Björnstig U, Öström M. Alcohol and drugs among fatally and non-fatally injured motor vehicle drivers in Northern Sweden.
Accident Analysis and Prevention 2009; 41(1):129-36.
III. Ahlm K, Saveman B-I, Björnstig U. Drowning in Sweden with emphasis on the presence of alcohol and drugs - a retrospective study 1992-2009. BMC Public Health 2013; 11; 13:216.
IV. Ahlm K, Lindqvist P, Saveman B-I, Björnstig U. Suicidal drowning in Northern Sweden 1992-2009 (manuscript).
Background
Unnatural deaths constitute approximately 12% of all deaths in the world (WHO, 2004, WHO 2013, Lozano et al. 2012). The most common groups among unintentional deaths are traffic injuries, drowning, falls, and intoxications (WHO 2002). Notably, alcohol has a significant role in unnatural deaths (Sjögren et al. 2000, WHO 2011). Fatal injuries due to road traffic are estimated to rise from the 9th rank in mortality rate in 2004 to 5th rank in 2030. For suicide, the rank is estimated to change from 16th to 12th position (WHO 2010). Effective prevention and treatment is needed and may reduce injuries, costs and save lives (Robertson 2007).
Traffic injuries and deaths
Traffic injuries is a major public health problem and traffic fatalities consti-tute 23% of unnatural deaths in the world (TRB 2005, Peden et al. 2004). There were 1.24 million deaths in traffic incidents in the world in 2010. Middle-income countries have the highest traffic fatality rate (20.1/100,000 inhabitants) compared to 8.7/100,000 in high-income countries) (WHO 2013). According to WHO, half of the countries (with 1.6 billion people) will reduce the number of traffic deaths, whereas in the remaining 87 countries the number of traffic deaths will increase (WHO 2013). In certain age groups, road fatalities may constitute an even higher problem. For instance, the age group 30-44 years had the highest number of road fatalities and was ranked the third most common cause of death in the world (Peden et al. 2004). Three-quarters of the traffic deaths were males (WHO 2013). Notably, to every fatal case there are hundreds/thousands of injured indivi-duals that may suffer from disabling/ debilitating sequelae (WHO 2004). In Sweden, traffic fatalities represent 7% of all unnatural deaths (Swedish National Board of Health and Welfare 2007). Around 300 people are killed each year on the roads and one fifth are passengers of motor vehicles (Trafa Statistics 2014).
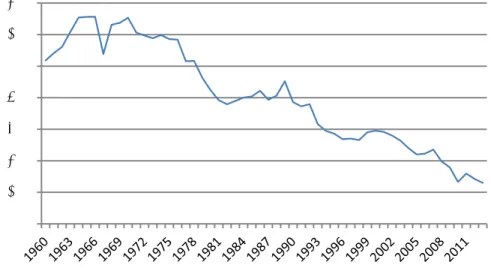
In Sweden, a long-term goal has been to reduce injuries in the road traffic system, which has been successful (Figure 1). Since 1997, The Swedish National Road Administration has worked according to “Vision zero”, which is a preventive strategy to reduce the number of injured and fatally injured persons in traffic (Swedish Traffic Road Administration 2010). This strategy has helped to reduce the number of road deaths even further, from 541 in 1997 to 260 deaths in 2013 (Trafa Statistics 2014).
Figure 1. Number of persons killed in road traffic incidents 1960-2013, Sweden (Trafa 2014).
Passengers
In crashes with motor vehicles, the focus has almost exclusively been on the drivers. The passengers’ situation in the crash event is less recognized. Only few studies focused on passenger injuries and deaths. In motor vehicles, passengers have an exposed position and therefore constitute a vulnerable group in a crash. Consequently, passengers are often at risk for severe or fatal injuries when a car crash occurs. The front seat passengers have a higher risk than rear seat passengers (Smith & Cummings 2006, Evans 2006). In several countries, the legislation regarding seat belt use is limited to the driver (Weiss et al. 2006).
Risk factors
Even at the beginning of mass transportation/motorization, there were concerns about the risk for injuries. A growing number of motor vehicles and higher speed have forced society to modernize the traffic infrastructure and implement various regulations (Robertson 2007). In Sweden, the first legislation concerning high speed and drunk driving was implemented already 1923 (Trafa 2014).
Today, the risk factors for road traffic injuries can be classified into four groups. The first group of risk factors is the exposure, the amount of move-ment in traffic environmove-ment i.e. urbanisation, mobility, public transportation etc. (Robertson 2007, Peden et al. 2004). Secondly, factors that influence the
0 200 400 600 800 1000 1200 1400
pre-event phase; e.g. the infrastructure of roads, pavements, condition of the vehicle, speeding, driving at night, tiredness, and presence of alcohol and drugs (Haddon 1972). Thirdly, factors that influence the event and severity of injuries; e.g. speed, protection for occupants, seat belts, and use of helmets (Haddon 1972). Fourthly, in the post event phase; detection of the event, rescue, ambulance services, pre-hospital and hospital care (Haddon 1972).
The risk for traffic injury events may increase with increasing age since older drivers have impaired perception, slower reaction time, and poorer performance than younger drivers (Evans 1991, Evans 2006). However, even though young drivers have the best performance including visual ability and short reaction time, they tend to have the highest crash rates (Evans 1991). This paradox can be explained by the fact that young drivers tend to have higher risk-taking and drive at higher speed, which result in an increased risk for involvement in crashes.
Drowning
Drowning is the third leading cause of unnatural deaths in the world (WHO 2004), and especially affects children (Peden & McGee 2003). Globally, it is estimated that as many as 388,000 individuals drown each year, of which two thirds are males (WHO 2004). Drowning deaths are more common in low-income countries (Peden & McGee 2003, Hyder et al. 2008) and among disadvantaged groups (Irwin et al. 2009). The official statistics in low-, middle- and high-income countries are believed to underestimate the true number of drowning fatalities (WHO 2004, Lunetta et al. 2004).
The activities and places where the drowning incidents occur differ in relation to age and sex, e.g. drowning in a pool, bathtub, or open water (Quan & Cummings 2003). Changes in society, e.g. through increased presence of ponds and pools, may influence the incidence of drowning, especially among children (Björnstig et al. 2006; Schyllander et al. 2013). The relationship between swimming ability and the risk of drowning is a relatively unexplored area (Brenner et al. 2003). An American study has shown that swimming ability is correlated to socio-economic aspects, age and ethnicity (Irwan et al. 2009).
Drowning can occur due to a variety of external factors such as unintentional, for instance, incidents with boat, snowmobile and road vehicles (Stjernbrandt et al. 2008, Öström & Eriksson 2002). Intentional drowning, i.e. suicide is related to psychiatric illness (Tidemalm et al. 2008,
Runesson et al. 2010, Wahlbeck et al. 2011). Disease, such as epilepsy, can be an additional risk factor (Jansson & Ahmed 2002, Bell et al. 2008). Of unnatural deaths in Sweden, drowning represents 6% of all cases (Swedish National Board of Health and Welfare 2007). The number of unintentional drowning has decreased from 356 individuals in 1960 to 92 in 2012 (Swedish National Board of Health and Welfare 2012). However, Swedish studies on the incidence of drowning and the circumstances surrounding the drowning are limited. Furthermore, statistics regarding drowning varies between different data sources. Previous Swedish studies have investigated cardiac arrest and resuscitation in drowning victims (Claesson et al. 2012, Claesson et al. 2013), and drowning in children (Andersson 2010, Schyllander et al. 2013). Over time, drowning in Sweden has declined, especially among children. Hence, it is important to investigate the circumstances in other age groups.
Risk factors
Risk factors for drowning can be divided into three groups; demographic, environmental, and behavioural factors. Demographic factors such as age and gender influence the risk. Children under 5 years of age have the highest incidence of drowning deaths worldwide (WHO 2010). These drowning events often happen when children are unsupervised or left alone with other children. In the age groups 15-44 years, drowning is the 10th leading cause of death and more males drowned worldwide which has been explained by the notion that they take more risks and also have occupational hazards when working, e.g. as fishermen (Szpilman et al. 2012, WHO 2004).
Environmental factors such as access to water sources and climate are of importance for the risk of drowning (WHO 2011). Sweden, especially the northern part, has a cold climate. The water temperature is important for the outcome of the event because of the risk for hypothermia in cold water (Brändström et al. 2014). Cold water drowning is defined when temperature is below +15 °C. (Deakin 2012, Brändström et al. 2014). A longer period in the water is associated with hypothermia, i.e. a core temperature of the body below +35 °C (Schilling & Bortolin 2012, Brändström et al. 2012). On the other hand, the prognosis is better for a person that is rescued following a drowning incident in cold water with a temperature of less than +5 °C, since the detected lower metabolism can protect the brain. The need for oxygen decreases 7-9% for each degree C decrease in body temperature (Tsokos 2004). The time in water and time for arrival of rescue service are major determinants for survival (Suominen et al. 2002, Szpilman et al. 2012). For those suffering cardiac arrest from drowning, a quick body recovery and
professional resuscitation is important (Claesson et al. 2012, Claesson et al. 2014).
Behavioural factors such as risk-taking when swimming and diving, and drunk boating can increase the risk for drowning. Several studies have confirmed the importance of alcohol in drowning (Lunetta et al. 1998, Wintemute et al. 1990, Brownie et al. 2003, Lunetta et al. 2004, Gorniak et al. 2005). In many studies, however, data concerning the involvement of drugs is lacking (Driscoll et al. 2004).
The presence of alcohol and drugs may impair judgement, coordination, and ability to survive when falling into the water. Alcohol is a factor associated with hypothermia when drowning since alcohol affects the central heat regulatory mechanism causing vasodilatation in the skin, which in turn leads to loss of heat, and hypothermia (Saukko & Knight 2004, Brändström et al. 2014).
Suicidal drowning
When analysing the national data for drowning, a large proportion of drowning deaths were found to be intentionally self-inflicted (Paper III). The focus in the fourth study was suicidal drowning deaths.
Suicide, besides fatal traffic injuries and drowning deaths, is an important and common external cause of unnatural deaths. Globally, one million people commit suicide every year (WHO 2012). Suicidal methods have changed during the last century e.g. due to access to different methods and restrictions of firearms (Hepp et al. 2010, Thomas et al. 2013). In several studies, it has been shown that mental illness is associated with suicide (Qin et al. 2000, Pirkola et al. 2005, Tidemalm et al. 2008, Runesson et al. 2010, Wahlbeck et al. 2011), and involvement of alcohol and drugs (Öhberg et al. 1996, Gorniak et al. 2005).
Some authors argue that psychoactive drugs and alcohol may lower the threshold for a suicide attempt (Öhberg et al. 1996). Interestingly, of all suicide victims in Sweden, 34% had alcohol detectable in blood (Holmgren & Jones 2010).
In 16 European countries, suicidal drowning was the method of choice in, on average, 4% of the suicides (Värnik et al. 2008). Among females, it was the most common suicidal method (Baumert et al. 2008). Studies on circumstances surrounding suicidal drowning are limited.
Definitions and pathophysiology
What is drowning? The definition of drowning varies and 33 different definitions were found in a review of Papa et al. (Papa et al. 2005). The Word Congress on Drowning in Amsterdam 2002 recommended a new and more precise definition of drowning, which is now used. The present definition of drowning is “a process with respiratory impairment from sub-mersion/ immersion in water/liquid” (van Beck et al. 2005). Immersion is when at least the face and airway are immersed and submersion means when the whole body is under the surface (Idris et al. 2003). Immersion or submersion are used regardless whether the victim survived or died after the event (van Beck et al. 2005). This definition differs from the previous definitions, which included many pathophysiological classifications (van Beck et al. 2005).
Drowning leads to hypoxia, which has several pathophysiological conse-quences (Saukko & Knight 2004). When the victim is in the water/liquid and starts to hyperventilate (cold water) or when the victim can no longer hold his/her breaths, the water enters the mouth (Bierens 2006, Schilling & Bortolin 2012). The swallowing of a small amount of water causes aspi-ration, which leads to initiation of reflex-mediated laryngospasm with a consequent major aspiration that fills the airways with water (Szpilman et al. 2012, Schilling & Bortolin 2012). This leads to hypoxia, loss of conscious-ness and to cardiac arrest (Bierens 2006). If not resuscitated rapidly, the outcome will be cerebral hypoxia and death (Schilling & Bortolin 2012). Definition of injury
In this thesis the word “injury” will be used, and the origin of this term is
injuria “not right” which means harm, hurt, loss or wrong.
Injury is a physical damage to a person caused by a transfer of energy from acute exposure to energy (mechanical, thermal, electrical, chemical or radiation) in amounts that exceed the threshold of physiological tolerance (Robertson 2007). Among all injured and fatally injured individuals in this thesis, two type of energy/absence of energy were present; the involvement of mechanical energy in traffic incidents (Paper I and II) and the absence of oxygen, leading to asphyxiation in drowning (Paper III, IV).
In vehicles crashes, the relative risk depends on the mechanical energy, i.e. speed and mass (Evans 1991). The tolerance to such energy exposure varies among individuals by age and gender (Robertson 2007).
Effects of alcohol and drugs
Alcohol
Alcohol (ethanol) affects the central nervous system and depresses all brain functions through interaction with neurotransmittors that act as messengers between different neuronal cells (Eckardt et al. 1998). Alcohol especially affects the cerebral cortex where higher functions such as problem-solving and decision making takes place. Hippocampus is another affected area, important for memory and learning. Alcohol also affects cerebellum that regulates the movements and coordination. Depending on the concentration of alcohol in blood, the effect is first euphoria and excitement at concen-trations up to 0.24 g/l (Tsokos 2004). After the intake of alcohol, the reaction time is extended and coordination between the muscles and nerves deterio-rate. Distance assessment and eye coordination skills are reduced by increased blood alcohol concentration (Kunsman 2006). When the alcohol content in the blood increases, the attention span is impaired and the brain cannot handle detailed information, which may result in increased risk for accidents (Tsokos 2004). Accordingly, studies show that driving skills deteriorate already at 0.2-0.4 g/l (Zador et al. 2000, Jongen et al. 2014). Even the day after intake of alcohol when alcohol concentration in blood is at zero, the driving performance can be impaired (Karadayin & Cutera 2013, Verster et al. 2014).
In addition, behaviour is affected. The judgement is reduced, performance impaired and inhibitions reduced, leading to risk taking (Evans 2006). These behavioural changes together with impaired motor reaction time and coordination, creates an unreliable driver with false security that could lead to high risk for involvement in crashes (Evans 2006).
After intake of the same amount of alcohol, individual factors as gender, body weight, intake of food, will result in different blood alcohol concen-tration (Hunsaker 2004). The relative water content is higher in males than females (68% vs. 55%), which results in a higher ethanol concentration when the same amount of alcohol is consumed (Levine & Caplan 2006). The absorption rate of ethanol depends on ingestion of food in stomach, which delays absorption. The peak ethanol concentration occurs within one hour and the blood concentration is higher when taking in alcohol on an empty stomach (Levine & Caplan 2006). Elimination of the ethanol occurs mainly by metabolism in the liver (Levine & Caplan 2006).
Drugs
2006). How affected you get after intake of a drug is difficult to predict. Many factors are important, e.g. age, body weight, duration of the intake, tolerance level, and interaction between different substances (Kunsman 2006).
Barbiturates, benzodiazepines, antidepressants and antipsychotics drugs are CNS depressants and have behavioural and psychological effects. Together with alcohol, these effects are pronounced (Jufer-Phipps & Levine 2006). These drugs typically slow the reaction time, impair attention, and judgement, and increase risk-taking behaviours (Levine & Kunsman 2006). Even recommended doses of benzodiazepines can affect the psychomotor function (Jufer-Phipps & Levine, 2006). Moreover, many of the legal drugs can lead to drug dependence.
The most used illegal drug is cannabis (tetrahydrocannabiol, THC) that leads to loss of cognitive functions such as attention and affected reaction time (Hartman & Huestis 2013). Amphetamine, cocaine and heroin change important mental functions such as tuning mode aggressiveness, perception, alertness, and pain reaction (Gillet et al. 2001, Levine 2006).
In Sweden until 2005, a red triangle was present as a warning on pharma-ceuticals that could impair driving. Later, this warning triangle was excluded because many other drugs were not marked even though they could affect the performance (FASS 2006).
Alcohol and drugs in traffic
Driving under the influence of alcohol increases the crash risk (Blomberg et al. 2009) and other drugs can also form a contributing factor to the crash (Longo et al. 2000, Movig et al. 2004, Drummer et al. 2004, Laumon et al. 2005, Grotenhermen et al. 2007, Mørland et al. 2011, Gjerde et al. 2011). The alcohol can influence the driver and other occupants in three ways, viz. behaviour, performance, and survivability (Evans 1991). With a high blood alcohol concentration, the driver’s behaviour is changed, including risk-taking and the performance in traffic is impaired. Furthermore, injuries tend to be more severe with higher blood concentration of alcohol (Evans 1991). Alcohol concentration is measured in blood by mass of alcohol per volume as a proportion (0.02%=0.2‰) or as milligram/litre in breath test (Evans 2006). The legal limit for driving a vehicle in Sweden is 0.2 g/l alcohol in blood and 0.1 mg alcohol/l in breath test (SFS 1951:649). In Sweden, routine breath alcohol testing is commonly used in road surveys.
Toxicological analyses in blood are obtained for other drugs when the driver tests negative for alcohol (≤0.1mg/l breath alcohol) but shows signs and symptoms of impaired driving. The police routinely check the driver’s reaction to light, pupil size, test of nystagmus, slurred speech, and the balance to stand and walk (Jones et al. 2004).
Legislation against driving under influence of narcotic drugs was implemen-ted in Sweden 1999 (see SFS 2006:46). After the law had changed 1999, the police increased their surveillance and sent more samples for toxicological analyses (Jones et al. 2009). Presence of narcotic drugs is not allowed in the driver’s blood. One exception is if a person is driving after taking a drug in accordance to prescription by a physician and with normal therapeutic usage.
Alcohol and boating
Alcohol impairs judgement and coordination, both necessary for safe boating. Consequently, many countries have regulations and limitations regarding alcohol and boating. In Sweden, the limit for drunk boating is an alcohol concentration of 0.2 g/l in the blood or 0.1 mg alcohol/l of exhaled air for the driver of boats that can have a speed greater than 15 knots or has a full length of more than 10 meters. Aggravated drunk boating is above 1.0 g/l alcohol in blood or 0.5 mg/l in breath test. The Swedish Coast Guard, Swedish Customs, and the Swedish Police conduct breath tests at sea (SFS 1994:1009, SFS 2008:322).
Forensic Medicine
To understand the cause of death, autopsy is an important source of information that not only determines the cause of death for an individual but also provides a basis for mortality statistics. Mortality statistics can be used by decision-makers, cause public awareness, and lead to priorities and prevention programs.
According to legislation in Sweden, cases of unnatural deaths should be autopsied at one of the six Departments of Forensic Medicine (Figure 2). The National Board of Forensic Medicine in Sweden is responsible for the medical and laboratory investigations of the around 5,500 autopsies that are performed every year (National Board of Forensic Medicine 2011).
Since 1992, the data obtained from autopsies are collected in the National Board of Forensic Medicine database, an invaluable resource to study the incidence and trends of unnatural deaths in Sweden. These data together with medical records, police reports, and toxicological results provide
unique possibilities to explore and identify relevant factors concerning unnatural deaths, which is the focus of this PhD project.
Figure 2. The map displays the catchment areas of the six Departments of Forensic Medicine in Sweden (Paper I and Paper III). The Department of Forensic Medicine in Umeå includes the four northernmost counties (Paper II and IV). Source: The Grafisk Et Original Forma Viva, Linköping/lennart Rammer, National Board of Forensic Medicine.
Aims
The overall aims of this thesis were to describe the epidemiology and circumstances for traffic incidents and drowning deaths, especially the presence of alcohol and drugs in these events. Increased knowledge may lead to identification of appropriate means for prevention.
Specific aims were to investigate
- the relationship between passenger’s death, the presence of alcohol in the driver and the role of alcohol as the cause of the crash (Paper I).
- the presence of alcohol and drugs in both fatally and hospitalized non-fatally injured drivers of motor vehicles in northern Sweden (Paper II). - the epidemiology of drowning deaths in Sweden and to highlight important factors for the events including the presence of alcohol and drugs (Paper III). - the circumstances of suicidal drowning deaths in northern Sweden in relation to mental disorder and the presence of alcohol and drugs (Paper IV).
Materials and methods
The study design, time frame, sources and subjects used in the four papers are summarized in Table 1.
Data sources
National Board of Forensic Medicine Database (Paper I-IV)
The data for all included lethal cases were collected from the database of National Board of Forensic Medicine which covers all medico-legal autopsies from the six departments in Sweden; Umeå, Uppsala, Stockholm, Linköping, Göteborg, and Lund (Figure 2). In paper I and III, national data for fatally injured passengers and drowning deaths were used (Table 1). In paper II and IV, fatally injured drivers and suicidal drowning deaths were included only from Northern Sweden (the catchment area of the Department of Forensic Medicine in Umeå).
Detailed information were obtained from the database regarding demographic data, circumstances of the incident, manner of death, cause of death, and information from the autopsy (Figure 3).
Police reports (Paper I)
To judge who was responsible for the crashes where passengers died (Paper I), police reports (circumstances about incidents and witnesses) were obtained from all involved police districts.
Toxicological analyses (Paper I-IV)
Samples for toxicological analyses were collected from femoral venous blood, urine and occasionally from vitreous liquid.
Analyses of alcohol, pharmaceuticals and illicit drugs were performed at the Department of Forensic Toxicology, Linköping, by gas chromatography (Jones & Shuberth 1989, Druid & Holmberg 1997)
Inpatient register (Paper IV)
The Inpatient register from the National Board of Health and Welfare contains patient data including information about hospital care for both somatic and psychiatric diseases defined as ICD diagnoses.
To find previous somatic and mental disorders among the suicidal drowning deaths, the unique Swedish ten-digit personal identity number was used (paper IV).
Figure 3. Data sources that were used for the four studies included in the thesis.
Table 1. Overview of the studies included in the thesis (Paper I-IV). Paper Study design
and area Subjects (Number) Years Sources I Retrospective national register study, Sweden Fatally injured passengers (n=420) Drivers (n=594) 1993-1996 National Board of Forensic Medicine database II Prospective study, register and hospital data, Northern Sweden Non-fatally injured hospitalized drivers (n=144) Fatally injured drivers (n=56) 2005-2007 2004-2006 Information from injury database, University Hospital of Umeå National Board of Forensic Medicine database III Retrospective national register study, Sweden Drowning deaths (n=5,125) 1992-2009 National Board of Forensic Medicine database IV Retrospective register study Northern Sweden Suicidal drowning deaths (n=129) 1992-2009 Forensic Medicine database The National Inpatient register* * obtained from the National Board of Health and Welfare
Driver’s alcohol and passenger’s death (Paper I)
To investigate passenger's deaths in relation to alcohol inebriation of the driver, all motor vehicle passengers who died in a crash in Sweden 1993-1996 registered in the National Board of Forensic Medicine database (n=420) were included (Table 1). Autopsy, police and medical reports were obtained from the six Departments of Forensic Medicine in Sweden. Data on alcohol and illicit drugs were obtained from the autopsy reports. Data on surviving drivers were obtained from police reports. Presence of alcohol was detected by blood or breath tests and registered in the police reports.
In addition, to gain complete information on the crash event, reports from the 372 crashes were requested from the police. This comprehensive material together with toxicological analyses were carefully investigated. To judge whether the driver was at fault or not, a specific data collection protocol was used, including details on the the crash event. The protocol was modified from a previously used procedure to judge responsibilty in traffic crashes (Sjögren et al. 1997). The judgement was done by the author for all crashes.
The drivers of the vehicles where the killed passenger(s) were riding (D1) were analysed separately from drivers without passengers (D2).
Alcohol and drugs in fatally and non-fatally injured drivers (Paper II) We performed a prospective study during 2004-2006 to investigate the presence of alcohol and drugs in both hospitalized non-fatally and fatally injured drivers of motor vehicles in northern Sweden. Hospitalized non-fatally injured drivers (n=144) were recruited in the emergency room, University Hospital of Umeå and were tested for alcohol and drugs by blood test (Table 1). During the same period, 56 fatally injured motor vehicle drivers were registered at the Department of Forensic Medicine in Umeå with a catchment area of Northern Sweden (Fig 2). For all injured drivers, medical records, information from the injury database (IDB), police reports, and toxicological analyses were evaluated. In addition, for the fatal cases we assessed the autopsy reports.
Blood and urine were collected at the autopsy of fatally injured drivers. The non-fatally injured drivers blood was collected in the emergency room. Samples for alcohol, pharmaceuticals and illicit drugs from both fatally and non-fatally drivers were all analyzed at the Department of Forensic Toxicology in Linköping. The number of drivers tested positive for alcohol
Furthermore, each crash was classified as a single vehicle (SV) crash with one vehicle involved in crash or a multiple vehicles (MV) crash when two or more vehicles were involved. Injury severity was measured using the Abbreviated Injury Scale (AIS) which is a six-point scale. In each individual, the maximum score (MAIS) was calculated (Association for the Advancement of Automobile Medicine 2005).
Drowning deaths in Sweden (Paper III)
To study drowning deaths in Sweden, all individuals who had undergone an autopsy with the cause of death identified as drowning during the period 1992-2009 were included. This information was collected from the database at the National Board of Forensic Medicine. The direct or underlying cause of death in these cases was drowning (unintentional, intentional and undetermined deaths) (ICD9 994B, Swedish National Board of Health and Welfare 1987). In total, 5,125 individuals drowned during the 18-year period in Sweden. Information including demographic and temporal data, location, cause of death, manner of death, and circumstances of the event were obtained from the database. In addition, toxicological data on alcohol, pharmaceuticals and illicit drugs was obtained from Forensic Toxicology, National Board of Forensic Medicine, Linköping.
Suicidal drowning in Northern Sweden (Paper IV)
Of the drowned persons during the period 1992-2009 obtained in study III, 642 individuals belonged to the catchment area of the Department of Forensic Medicine in Umeå (Norrbotten, Västernorrland, Västerbotten and Jämtland county i.e. Northern Sweden). When analysing these cases, 129 were suicidal drowning deaths and these were further analyzed in detail.
Data of the incident was obtained from police reports, medical records, autopsy protocols and reports. Toxicological data on alcohol, pharmaceutical and illicit drugs were obtained from Forensic Toxicology, National Board of Forensic Medicine, Linköping.
Information regarding the event, how the person was found, witnesses of the event, how long time the person was in the water was collected together with information on previous suicide attempts and contact with psychiatric/health care centres, and weariness of life.
In addition, data on medical treatment and hospitalization was obtained from the Inpatient register, the National Board of Health and Welfare. For identification of psychiatric disorders, all hospital admissions and discharge diagnoses for a period of 5 years prior to death were analysed.
Classification of diseases
The International Classification of Diseases (ICD) is a standard classifi-cation for mortality and morbidity statistics. This system is used by WHO and in more than 100 countries to define diseases. In Paper I, II, and III we obtained data from the Forensic Medicine database for the classification of the diagnoses that were based on ICD9 (WHO 1977, Swedish National Board of Health and Welfare 1987). In Paper IV both ICD9 and ICD10 were used since the Inpatient register uses ICD10 after 1997 (WHO 2010). In the study of suicidal drowning deaths (Paper IV), mental disorders were grouped into the following categories; psychotic, affective, anxiety, substance abuse, and other disorders (see Paper IV, Table 1).
Classification of pharmaceuticals and illicit drugs
For the classification of pharmaceuticals, the WHO’s Anatomical Thera-peutic Chemical (ATC) codes were used (WHO 2013). Psychoactive drugs were grouped into the following groups antidepressants, benzodiazepines, opiates, neuroleptics, and antiepileptics (Paper II, III and IV).
For drivers with detected pharmaceuticals, which had a notification or warning to impair driving (FASS 2006) we compared the concentrations to the therapeutic levels according to the Drug and Chemical blood-level data (Winek et al. 2001) and the International Association of Forensic Toxicolo-gist (TIAFT 2007) (Paper II).
Illicit drugs were defined as those that are included in the Swedish law (SFS 2014:103). Illicit substances i.e. amphetamines, opiates, heroin, cocaine, ecstasy and tetrahydrocannabinol were analysed in Forensic Toxicology, National Board of Forensic Medicine in Linköping.
Ethical permission and considerations
According to Swedish regulations, no formal ethical approval is required when performing research on deceased persons or register research on de-ceased persons (2003:204 Law, Ethical Permission, 1998:204, Law, Personal Data Act). This regulation is applicable for study III and study IV. In study I, an ethical approval was obtained (Dnr 01-215), and for study II (Dnr AL90B 2003:31496/decision §117/91). Information from Inpatient register required approval from the Ethical Review Board (Dnr 25940/2013 (Paper IV). In all the studies, we coded and analysed the data anonymously. The deceased persons are only presented as groups and not as individuals.
Statistical analyses
All data were processed in SPSS version 11.5, 14 and IBM SPSS version 19 (Paper I-IV). Descriptive statistics such as mean, median and standard deviation was used in Paper I-IV. Comparison of groups (manner of deaths) in relation to the categories sex, presence of alcohol, pharmaceuticals, illicit drugs were estimated by Chi-square test for proportion in Epi Info 3.4 and 6 (Paper I-IV). To considered the level of statistically significance a p-value <0.05 was chosen (Paper I-IV).
To handle the missing values in Paper I we used a multiple imputation. Firstly, we assumed that missing values were “alcohol negative” and then tested that missing values were “alcohol positive”. The result from impu-tation was given as relative risk (RR) and with 95% confidence intervals (CI) (Paper I). Binary logistic regression and MannWhitney U-test were used for analyses of variance. To test for drop outs, a comparison of characteristic of not tested cases in relation to included drivers were used (Paper II). Poisson regression model was used to analyse time trend, age effect and differences in sex. Incidence rate ratios (IRR) and 95% confidence intervals (CI) were given as a result from Poisson regression (Paper III). Incidence per 100,000 inhabitants in the mean population were used for age groups and sex, alcohol and drugs/100,000 inhabitants and alcohol/drugs 100,000 cars (Paper III).
Results
Driver’s alcohol and passenger’s death (Paper I)
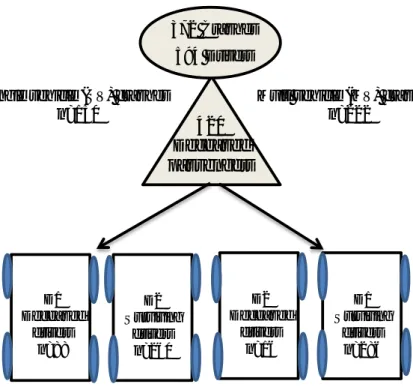
In Sweden, 420 passenger died in 372 motorvehicle cashes during the 4-year period 1993-1996. There were 594 drivers involved in these events (Figure 4). Most of the fatally injuried passengers died at the scene of the incident and one-fifth of the passengers died in hospital. Of the passengers, 57% were females and the median age was 35 years. The passenger was sitting in the front seat in 70% of the crashes.
Figure 4. Overview of 372 crashes resulting in 420 passenger’s deaths in Sweden, 1992-2006 (Paper I).
Of the 594 drivers, 80% were males,and the mean age was 38 years. In 40% of the crashes only one vehicle (SV) was involved while in the remaining 60% there were two or more vehicles (MV). Alcohol involvement was significantly more common in drivers in SV crashes than in MV crashes (38% vs 6%, p<0.001). Notably, no inebriated female driver involved in an incident causing a fatally injured passenger’s death (Paper I).
Multi vehicle (MV) crashes n=222 372 Crashes 594 Drivers 420 Deceased passengers
Single vehicle (SV) crashes n=150 D1 Deceased drivers n=88 D2 Surviving drivers n=260 D2 Deceased drivers n=16 D1 Surviving drivers n=286
Of the fatally injured passengers, 15% (n=63) were children below 16 years. Notably, the drivers carrying a child in their vehicle were alcohol positive in 13% of the cases.
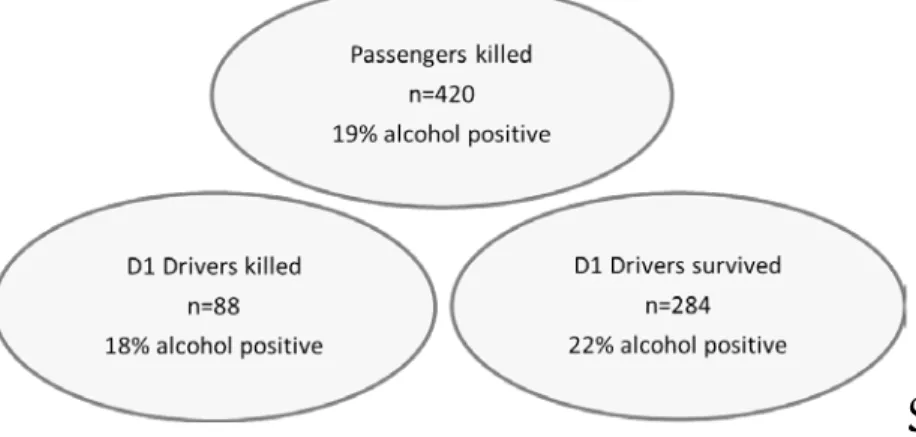
For comparison, alcohol was detected in 19% of the passengers and significantly more males had alcohol in the blood than to females (37% vs. 5%, p<0.001). In 102 of the crashes both the passenger and the driver in the same car were tested for alcohol and 19 of the driver/passenger pairs tested positive. Of these, 10 drivers had a higher alcohol concentration than the deceased passenger in the same car. Of the surving 284 D1 drivers 22% tested positive for alcohol. Of the 88 D1 drivers who died 18% were alcohol positive (Figure 5). The highest proportion of alcohol positive individuals was seen in age group 20-29 years.
In the single vehicle crashes where a passenger died, 38% of the drivers at fault were alcohol positive. Drivers at fault in both SV and MV crashes, had a significantly higher proportion of alcohol than to drivers not at fault (21% vs. 2%, p<0.001) (Table 2).
Figure 5. Presence of alcohol in blood and breath test among killed passenger and drivers
A relatively large proportion of drivers were not tested for alcohol. When analysing these missing values regarding alcohol with multiple imputation, the association between drivers at fault and positive alcohol test did not change. The relative risk (RR) for the original presence of alcohol was 1.50, when assuming missing equals alcohol negative results in RR 1.55, whereas assuming missing equals alcohol positive results in RR 1.0.
Alcohol and drugs in fatally and non-fatally injured drivers (Paper II) In this prospective study in Northern Sweden, 144 non-fatally and 56 fatally injured drivers were identified during the 2-year period 2004-2006 (Table 1). Among non-fatally injured drivers, males constituted 71% and the mean age was 36 years. Of fatally injured drivers, 89% were males and the mean age was 42 years. Crashes involving cars were most frequent in both non-fatally and fatally injured drivers (67% vs. 71%). Of the non-fatally injured drivers, 68% were involved in single vehicle (SV) crashes compared to 57% of the fatally injured drivers.
Eighty-nine per cent of the fatally injured drivers died at the scene of the crash and the remaining drivers after 30 minutes to 5 hours. Alcohol was detected in 38% of the fatally injured drivers compared to 21% of the non-fatally injured drivers (Table 2). Of those with critical and maximal injuries (MAIS 5+), alcohol was found in 41% and among non-fatally injured drivers (MAIS 3+) in 24%. The proportion of alcohol positive drivers was significantly higher in evening/night crashes in both fatally and non-fatally injured drivers (p=0.001).
Pharmaceuticals that come with a warning for impairing driving were found in 7% of the fatally injured drivers and in 13% of the surviving drivers, respectively. Benzodiazepines were the most frequent pharmaceuticals, followed by opiates and antidepressants. Illicit drugs, of which tetrahydro-cannabinol was most common were detected in 9% of fatally injured drivers and in to 4% of non-fatally injured drivers.
Drowning deaths in Sweden (Paper III)
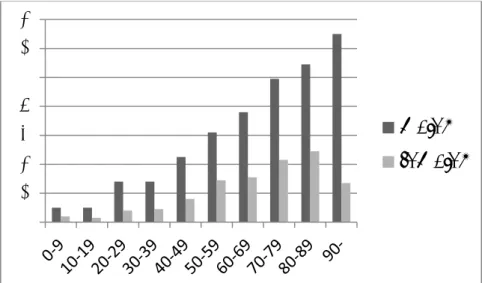
During the 18-year study period 5,125 drowning deaths occurred. Of these, unintentional drowning constituted 50%, suicidal drowning 31%, homicide 1%, and undetermined cases 18%. Notably, 70% were males and for all cate-gories of drowning deaths, the incidence were higher in older age groups and increased 3% for each year of age (Figure 6). Children (≤18 years) consti-tuted 5% of the drowning deaths in Sweden. Of all drowning deaths, a significantly higher proportion of females had committed suicide; 55% (847/1,547) compared to males; 21% (763/3,578) (p<0.001). The mean incidence of drowning deaths was 3.1/100,000 inhabitants per year during the study period. On average, the incidence decreased by 2% each year (p<0.001).
Figure 6. Incidence of drowning deaths/100,000 inhabitants per year in Sweden related to age and sex, 1992-2009.
Unintentional drowning caused 2,585 deaths of which 84% were males with a mean age of 54 years. Unintentional drowning deaths occurred mostly in lakes (32%), in the sea (25%), in streams or rivers (20%), and in bathtubs (12%). In 13% the drowning incidents were caused through thin ice.
The majority of drowning deaths, 70%, occurred during bathing and other unspecified water activities. Boating incidents occurred in 20%, while 3% drove the car into the water, and 2% belonged to each of the following categories; snowmobiles, other vehicles, and aeroplanes.
There were 1,610 suicidal drowning deaths, 53% were females and the incidence was highest in age groups 50-59 and 60-69 years. The incidences of suicidal drowning for both females and males have decreased during the study period (1.6 to 0.7/100,000 and 1.2 to 0.8/100,000, respectively). Suicidal drowning in a bathtub was most frequent among females whereas to males mostly drowned outdoors (p<0.01).
Homicides were identified in 21 cases, and of these seven were children between 0 and 16 years. Bathtub and the sea were the most frequent places for the act of homicide.
Alcohol was detected in 38% of the 4,377 tested persons with a mean concentration in the blood of 1.8 g/l (Table 2). In unintentional drowning
0
2
4
6
8
10
12
14
males
females
deaths, the overall proportion of alcohol positive cases was 44%. For deaths that occurred during boating, alcohol was detected in 54% (see paper III, Table 2). Alcohol was found in 24% of intentional drowning deaths compared to 45% in undetermined drowning deaths (Figure 7, Table 2). One or several psychoactive drugs were present in 42% (Table 2) of all tested persons who died due to drowning. Benzodiazepines were the most common drug (21%) (see Paper III, Table 3). The suicide group and the undetermined group had the highest proportion of psychoactive drugs; 71% and 44%, respectively, compared to 22% in unintentional drowning deaths (see Paper III, Table 3). Combinations of alcohol and drugs were detected in 9-16% depending on manner of drowning death. Illicit drugs were detected in 10% of tested individuals.
Figure 7. Proportion of unintentional (accident), intentional (suicide and homocide), and undetermined drowning deaths in Sweden in relation to presence of alcohol.
Suicidal drowning deaths in Northern Sweden (Paper IV)
During the study period 1992-2009, 129 suicidal drowning deaths occurred in Northern Sweden. Of these, 56% were males. Females were significantly older than males (mean age 59 vs. 52 years, p < 0.05), and no females below 24 years were found in the study. The highest proportion of suicidal drow-ning occurred in the sea, lakes and rivers/streams, and the remaidrow-ning individuals drowned indoors in bathtubs. Of all suicidal drowning, 15% of the events were witnessed.
According to the inpatient register, 68 suicides (53%) had been hospitalized with a diagnosis of a mental disorder. There were more females with mental disorder than to males (67% vs. 42%, p<0.01). Affective disorder or mood disorders (53%) and psychotic disorders as schizophrenia (15%) were most common.
Of all hospitalized with a mental disorder, 22% had committed suicide at the same day of discharge, the 32% within a week and 59% within a month. Alcohol was found in the blood in 16% of those tested and the mean blood concentration was 1.4g/l. There was a significantly higher proportion of alcohol positive males (23%) compared to females (8%) (p<0.05).
Psychoactive substances were detected in the blood in 62% of 117 tested individuals and females had higher frequency of detectable psychoactive substance than males 73% vs. 54% (p< 0.05) and benzodiazepines were more frequently detected in females (44% vs. 17%, p<0.01). Illicit drugs were not found among the cases.
Table 2. The proportion of alcohol and drugs in the groups included in Paper I-IV.
Paper Subjects (n) Alcohol
n pos/n tested (%) Pharmaceuticals n pos/n tested (%) Illicit drugs n pos/n tested (%) I Fatally injured passengers (n=420) *SV Drivers D1 *MV Drivers D1 Drivers at fault Drivers not at fault
55/290 (19%) 28/74 (38%) 7/73 (10%) 37/173 (21%) 2/83 (2%) - All drivers 8/140 (6%) II Fatally injured drivers (n=56) Non-fatally injured hospitalized drivers (n=144) 21/56 (38%) 30/144 (21%) 4/56 (7%) 18/143 (13%) 5/56 (9%) 6/143 (4%)
III All drowning deaths (n=5,125) Unintentional (n=2,585) Intentional, suicide (n=1610) Homicide (n=21) Undetermined (n=909) 1656/437 (38%) 997/2255 (44%) 333/1400 (24%) 7/19 (37%) 319/703 (45%) 1755/4181(42%) 462/2075 (22%) 987/1394 (71%) 2/17 (12%) 304/695 (44%) 82/854 (10) 43/459 (9%) 8/193 (4%) 2/13(15%) 29/189 (15%) IV Suicidal drowning deaths 19/117 (16%) 73/117 (62%) 0/9 (0%)
Discussion
Prevalence of alcohol in traffic incidents
There are different ways to estimate the prevalence of alcohol in traffic incidents. In this thesis, non-fatally and fatally injured drivers have been investigated using both a retrospective and a prospective approach (Paper I-II).
Driver’s alcohol and passengers’ death
In the study of passenger deaths (Paper I), it was noted that one fifth of all tested drivers were positive for alcohol. Even if it is difficult to establish the role of alcohol in these events, drivers at fault had a significantly higher proportion of alcohol positive than to drivers not at fault (21% vs. 2%). A considerable proportion of the drivers, even those responsible for passenger deaths, were not tested for alcohol (Paper I), which is a known problem from previous studies (Öström et al. 1993, Isaac et al. 1995, Margolis et al. 2000, Quinlan et al. 2000, Zador et al. 2000). The missing tests had be due to several reasons, e.g. that the driver was too severely injured or had already has been transported to the hospital when police arrived.
Children below 16 years of age constituted 15% of the fatally injured passengers (Paper I). The proportion of alcohol-inebriated drivers who had a child passenger was 13%, which can be compared to 22-28% in other studies (Margolis et al. 2000, Quinlan et al. 2000). Unrestrained child passengers, high speed, alcohol in the driver, and young drivers increase the risk for fatal outcome (Winston et al. 2008). Drunk drivers are less likely to restrain a child passenger (Voas et al. 2002). Taken together, the risks for child passengers to be involved in fatal crash are considerable when riding with an inebriated driver and not using the safety belt (Kelly-Baker & Romano 2014). In our study, data on whether the children were restrained or not was unfortunately not documented in the police records (Paper I).
Passengers are often recognized as passive and innocent victims in fatal crashes. Importantly, passengers can potentially be central for prevention of drunk driving. An estimated 5-10% reduction of alcohol caused fatal traffic incidents could be achieved by passenger intervention according to Isaac et al. (1995). However, 19% of the passengers were alcohol positive in our study, which may have hampered their ability to assess the risk and intervene (Paper I). Previous studies have found a similar proportion of alcohol-inebriated passengers in crashes (Söderström et al. 1984, Söderström
et al. 1996). In addition, younger passengers may be unconcerned about the risk of riding with a drunk driver. The relation between driver and passenger may be of importance for the passenger to act as an alternative driver (Romano et al. 2012, Kelly-Baker & Romano 2014). Unfortunately, often the most suitable person doesn’t drive and the ownership of the car plays a role for who eventually is driving, be they sober or drunk.
Fatally and non-fatally injured drivers
To investigate the time trend of drunk driving, we performed a prospective study of fatally and non-fatally injured drivers in Northern Sweden 2004-2006 (Paper II). The results were compared with a similar study conducted in the same well-defined geographical areas more than a decade earlier (Sjögren et al. 1997). In comparison, the number of motor vehicle fatalities decreased by one-third but the proportion of alcohol positive drivers increased. Hence, the total annual number of alcohol positive deaths was the same in these two studies despite a reduction of the total number of motor vehicle fatalities between the study periods. Apparently, safer cars and roads did not reduce the number of alcohol positive deaths even though an unknown number of alcohol-positive drivers probably were saved by these measures. Notably, compared to the previous study (Paper II, Sjögren et al. 1997) an increased proportion of alcohol positive non-fatally injured drivers were detected.
There was a higher proportion of alcohol positives among the drivers (Paper II) compared with the results from other Swedish studies (Paper I, Ahlner et al. 2014, Jones et al. 2009). Possible explanations for this discrepancy could be differences in drunk driving in various areas in Sweden, observation time, and differences in methodology, i.e. a prospective study that included a well-defined catchment area (Paper II) versus a retrospective design (Paper I). To estimate the proportion of alcohol and illicit drugs among drivers in general, roadside surveys could be performed in the corresponding areas at the same time. When such studies have been done, the results reveal a significantly higher proportion of inebriated drivers among injured drivers compared to the result of roadside surveys (Legrand et al. 2013a).
Young drivers
In Paper I and II, the age group 20-29 years constituted a relatively high proportion of both fatally and non-fatally injured drivers. In addition, the highest proportion of alcohol was found among drivers in the age group 20-29 years (Paper I), which could be explained by the notion that young drivers are less aware of the risks when driving under influence of alcohol. A
study from five northern countries showed that drivers below 30 years involved in fatal single vehicle crashes had alcohol and/or drugs in 66% of the cases (Mørland et al 2011).
Young drivers are involved in more crashes since they are believed to be risk-taking, driving at higher speed, sometimes unlicensed, and with less experience when in dangerous situations (Hasselberg & Laflamme, 2009, Scott-Parker et al. 2014). They have not only a riskier driving behaviour but also alcohol usage (Peck et al. 2008). Eliott et al (2009) showed that males between 17-24 years were more frequently involved in fatal traffic incidents compared to other age groups in England. Recently, Romer et al (2014) reviewed explanations for hazardous driving among young drivers and suggested that improved training could overcome some of these shortcomings. The lack of driving experience is natural but attention failure is also an important cause of crashes among novice drivers. Notably, carrying passengers increase the risk for a fatal crash for a young drivers and strikingly the risk increases with the amount of passengers (Chen et al. 2000).
To compare the frequency of traffic incidents in different age groups, it is important to measure the exposure time and the driving distance. In addition, driving in darkness is more common among young than among older drivers (Robertson 2007). The high proportion of young drivers among fatally and non-fatally injured drivers (Paper II) may, however, also be explained by the possibility that they drive older and less safe cars (Robertson 2007). In our studies (Paper I-II), we did not investigate the type of passenger car. Such data could provide additional information and add to the analyses of crash energy, severity of injuries, and outcome (Robertson 2007).
Young unlicensed drivers, mostly males, run a higher risk to be involved in a crash resulting in fatal or severe injuries for themselves or others (Hanna et al. 2010). There is an overlap between alcohol and drugs, and drunk driving decreases while drugged driving increases according to a recent review (Kelly et al. 2004, Mørland et al. 2011).
Alcohol consumption and relation to drunk driving
Even though Sweden has been recognized to have a constrained alcohol policy (WHO 2014), the estimated annual alcohol consumption per capita was 5.15 litres of pure alcohol/person in 1992, and 10.3 litres in 2005, which may be one factor behind the noted increased proportion of alcohol-positive drivers (Paper II, Evans 2006, Skog 2001). The World Health Organisation, WHO suggests that the proportion of drunk driving may reflect the alcohol consumption per capita in each country WHO 2004). The proportion of
alcohol positive drivers in our studies (Paper I-II) were compared to other countries where such studies have been performed (Table 3). A correlation between alcohol consumption and the proportion of inebriated drivers seems to be present in several of these studies.
Presence of high blood alcohol concentration
The crash risk increases with an increasing blood alcohol concentration (Evans 2006) and the drunk occupants are at higher risk to die of their injuries after a crash (Zador et al. 2000). In an American study, the relative risk increased significantly with a BAC 0.8 g/l compared to 0.5 g/l (Blomberg et al. 2009). Similarly, estimations show that an increase with 0.2 g/l doubles the risk to die in a single vehicle crash (Zador et al. 2000), which may explain the high proportion of alcohol among drivers in such crashes (Paper I-II).
One may argue that it is irresponsible to drive drunk. Increasing data indicate that many of the drunk drivers abuse alcohol or fulfil the criteria for alcoholics (Öström & Eriksson 1993, Alvestad et al. 1999, Hubicka et al. 2010). The high concentrations of blood alcohol found in both our studies, mean BAC exceeding1.5 g/l (Paper I-II), are in line with this interpretation. Our findings are corroborated by previous studies where 21-42% of the fatally injured drivers were alcohol inebriated (Paper I and II, Eliott et al. 2009, Jones et al. 2009, Gjerde et al. 2011, Poulsen et al. 2012, Ahlner et al. 2014). The proportion of individuals with a BAC of 1.2-2.5 g/l constituted 50-80% of the drunken drivers (Gjerde et al. 2011, Poulsen et al. 2012, Ahlner et al. 2014). In another Swedish study, the mean BAC in fatally injured drivers was 1.7 g/l (Jones et al. 2009).
For non-fatally injured Belgian drivers, 26% tested positive for alcohol and of these 64% had a BAC above 1.3 g/l (Legrand et al. 2013b). In an Austrian study, 29% of the drivers were alcohol positive and the mean BAC was 1.0 g/l (Drummer et al. 2012). The high proportion of drivers with a high or very high BAC, support the notion that these drivers have an advanced drinking habit.
It may be difficult to compare studies from different countries since various methods for alcohol testing and cut-offs have been used. Moreover, autopsy rates and testing of alcohol and drugs varies. The legal limit for blood alcohol or breath test may differ (Table 3).
If the driver has been tested long time after the crash or received infusion or blood transfusion, the BAC could be false negative or at least decreased.
In the prospective study of non-fatally injured drivers, BAC was tested less than six hours after admission, the vast majority within two hours (Paper II). Drugs
Pharmaceutical drugs
Psychoactive substances such as benzodiazepines, opiates/analgesics, and antidepressants are known to increase the crash risk (Mørland et al. 2000; Engeland et al. 2007; Movig et al. 2004). Psychoactive drugs were more often detected in severely injured drivers with a MAIS 4 or 5 (Legrand et al. 2013b, Hels et al. 2013). In our study, these drugs were found in approxi-mately in 10% of the fatally and non-fatally injured drivers (Paper II). In a study including data from all Sweden, 7% of drivers had psychoactive drugs (Ahlner et al. 2014) while the corresponding figure from Norway was 14% (Gjerde et al. 2011). Benzodiazepines were the most common substances in our study, found in 5% of fatally injured drivers (Paper II), comparable to several other European countries (2-13%) (Legrand et al. 2013a).
Also, among non-fatally injured drivers benzodiazepines were found (6%) which is in agreement with studies from Belgium and Austria (5-9%) (Drummer et al. 2012, Legrand et al. 2013b).
In a review by Smink et al (2010), an increased crash risk was identified when using benzodiazepines with long half-life or having high dosage. The risk of being involved in a crash is higher within 2 weeks after a prescription of benzodiazepine, and the driver is not allowed to drive during the first week (Engeland et al. 2007). In addition, the culpability for crashes increases for drivers having therapeutic doses of benzodiazepines (Longo et al. 2000). Drivers with a combination of alcohol and benzodiazepines had an increased risk for injury (Movig et al. 2004).
An increased rate of driving under influence of psychoactive substances, especially benzodiazepines, has been reported, however, that could be explained by the implementation of zero tolerance legislation and increased roadside testing (Blencowe et al. 2011).
Illicit drugs
Illicit drugs were present in 6-9% among non-fatally and fatally injured drivers (Paper I-II), a finding supported by similar frequencies in recent studies from Norway (10%) (Gjerde et al. 2011), Belgium (5%) (Legrand et al. 2013b) and Sweden (7%) (Ahlner et al. 2014).
Five percent of the drivers had a combination of alcohol and illicit drugs in our study (Paper II) which is in agreement with other studies from northern