Kalmar ECO-TECH '07 KALMAR, SWEDEN, November 26-28, 2007
PHOTOLYSIS AND ADVANCED OXIDATION
TREATMENT OF ESTROGENIC CHEMICALS
IN TAP WATER AND TREATED SEWAGE
Kami/la Hanse,i
1Henrik R. Andersen
1•
Tobias He/
Anna Ledi11
3 1Technical University of Denmark, Denmark
1Scan Research AIS, Denmark & Lund University, Sweden
3Linkoping University, Sweden
ABSTRACT
The removal efficiency by photolysis and advanced oxidation (AOP) of some estrogenic compounds was investigated in tap water and biologically treated sewage. The compounds investigated included parabens, industrial phenols, sunscreen chemicals and steroid estrogens. Treatment experiments were performed using a UV lamp optimized for photochemical treatment in a flow through set-up. The effect of different concentrations of H2 O2 and difference between tap water and treated sewage was investigated for all compounds. The treatment effectiveness is evaluated based on the Electrical Energy per Order (EEO) (unit kWh/111e3), which is defined as the electrical energy consumed per unit volume of water treated required for 90 % removal of the investigated compound.
It was found that the removal efficiency was better in tap water than in wastewater which is due to the shadow effect from the inorganic and organic substance in the wastewater. Further, it was found that the removal of all the compounds was dependent of the UV dose for both treatment methods. The energy required for 90% removal of the compounds was between 28 kWh/111e3 ± 2.9 (butylparaben) and 1.2 kWh/ 111e3 (estrone) for the UY treatment. The AOP results in a more unifom1 value of EEO, which is between 8. 7 kWh/m3 (bisphenol A and benzophenone-7) and 1.8 kWh/m3 ( I 7a-ethynyl estradiol).
The removal at different concentration of H2O2 was investigated and it was found that removal effectiveness increased with concentration until 60 mg/L, but decreased at I 00 mg/L, which may be caused by H2O2 scavenging the HO'-radicals.
KEYWORDS
Kalmar ECO-TECH '07 KALMAR, SWEDEN, November 26-28, 2007
behavior, feminization of fish and have even been linked to reduced spem1 productivity in humans [I],
Degradation of estrogenic compounds by UV photolysis and the advanced oxidation process (AOP) UY/ H202 in laboratory setups has been reported in literature [2-4], While degradation by these mechanisms are well known, the present literature does not give the data needed for estimating the real cost of treatment if the techniques were applied as a real treatment since they do not consider realistic flow through conditions, radical scavengers and the shadow effect seen in real wastewater,
Therefore this work has used a setup with realistic dimensions from a UY-treatment plant intended for disinfection of a wastewater treatment plant effluent by medium pressure UV lamps, With this the removal efficiency by photolysis and advanced oxidation (AOP) of estrogenic compounds was investigated in tap water and biologically treated sewage,
2 METHOD
2.1 Regents and materials
All the estrogenic compounds investigated (See Table I) were purchased from Sigma Aldrich, Methanol, acetone, and heptane together with 35 % hydrogen peroxide, potassium titanium oxide oxalate dihydrate, sodium phosphate monobasic dehydrate and 85 % ortho phosphoric acid were obtained from Sigma-Aldrich as well, The chemicals for derivatisation of the steroid estrogens (dithioerytrol, trimethylsilyl imidazole, and N-methyl-N (trimethylsilyl)-tri- fluoroacetamide) were purchased from Sigma-Aldrich, All chemicals were of analytical grade except potassium titanium oxide oxalate dihydrate which was of technical grade,
The water used for experiment was wastewater effluent from Ussernd wastewater treatment plant, The effluent was collected 17th and 26th of April together with 14th of May 2007 and 14th of August. The water was stored in the dark at IO 0 C, The effluent was used for experiment within 3 days after the collection, however once after 12 days as an exception. The water was poured into 25 L plastic containers and spiked with the mixed solutions so the concentration of xeno-estrogens and steroid estrogens were I µg/L and 400 ng/L, respec tively, In the experiment with UV /H202 the hydrogen peroxide (35% solution) were added so the desired concentration was achieved.
2.2 Bench scale reactor
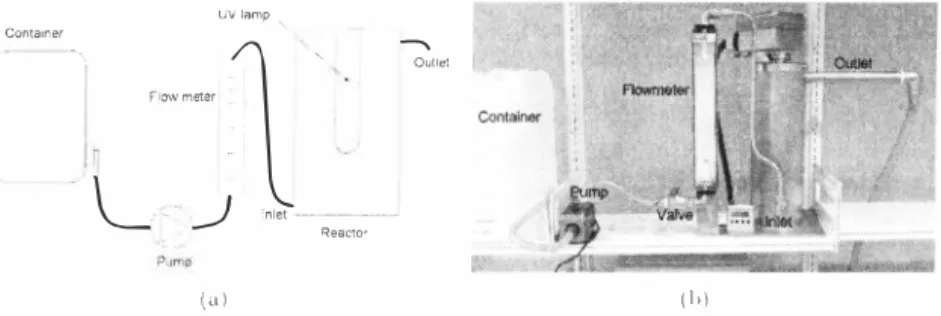
The treatments were carried out in a bench scale, flow through photoreactor (See Figure /), The lamp (700W, Bau47, ScanResearch, Heming, Denmark) is located coaxial in the centre of the reactor, The UV-lamp was placed inside a quarts sleeve which is pumped with an inert gas to avoid ozone production, The distance from the lamp to the inner side of the reactor is 5,7 Cm,
�-,
1
'
'�
,
,
_J
'nlet --- Reacto•Kalmar ECO-TECH '07 KALMAR, SWEDEN, November 26-28. 2007
UV lamp '
Container
--
Outlet
(a) (hi
Figure J: Diagram (a) and photo (b) of the experimental set-up.
Figure J shows a photo of the experimental set-up and schematically drawing. The water was
pumped from the plastic containers through a flowmeter and into the reactor at the bottom. A valve was used to adjust the flow rate, The samples for analysis were taken from the outlet after one retention time and from the containers (inlet concentration). The blind sample was taken before spiking and addition of hydrogen peroxide.
2.3 Sample preparation
For each experiment three samples of 500 ml each was analysed, The samples were acidified with phosphate buffer (pH 3). Internal standard was added to every sample before solid phase extraction (SPE) to compensate for possible losses during sample preparation and analysis. The extractions were prefom1ed at commercial packed cartridges (500 mg C 18 adsorbente/ 6 ml cartridge, Supelco), which were conditioned with 2 x 1.5 ml heptane, I x 1.5 ml acetone, 2 x 1.5 ml methanol, and 2 x 1.5 ml acidified water (phosphate buffer, pH=3) before the extraction begins. The water was transmitted to the SPE-column by the means of vacuum with a flow rate at maximum 5 ml per minute. Afterwards the column is dried for approximately I hour until completely dryness.
The samples were eluted with acetone until 5 ml eluent was collected in a test tube. Then the eluent was dried under a stream of nitrogen in a them10stat controlled heating block to almost completely dryness. One gram of silica-gel (Silica gel 60, 70-230 mesh from Merck deactivated with I % water) was suspended in 3 ml heptane-acetone mixture (65:35) and poured into 3 ml glass cartridge, The almost dried samples was resolved in approximately 0.3 ml heptane acetone mixture (65:35) and transferred to the top of the silica-gel. The test tube was washed with little more of the solvent mixture to minimize the loss of sample, Then glass cartridge containing silica gel and sample, was eluted with heptane acetone mixture (65:35) until approximately 5 ml eluent was collected, Once again the solvent was evaporated under a stream of nitrogen, but this time to completely dryness. The samples were dissolved in 250 µl heptane acetone mixture and transferred to a GC vial (300 µl, Chromacol).
Kalmar ECO-TECH '07 KALMAR, SWEDEN. November 26-28, 2007
The GC oven temperature was maintained at I 00 °C for I min, then programmed at 20 °C/min to I I O °C, then at I O °C/min to 250 °c, followed by 25 °C/min to 285 °C, and finally 35 °C/min to 320 °C, which where hold for 7.e1 min to ensure most of other organic compounds also came out.
Each compound was quantified based on a characteristic daughter ion of MS-MS spectroscopy and the other daughter ions were used for confirmation of the identity of the detected chemicals.
2.5 Estrogen analysis
After the analysis of xeno-estrogens the remaining extract of the samples was transferred to 3 ml reactival and the GC-vials were washed one or two times with acetone to ensure complete transferring of the sample. The samples were dried under nitrogen to completely dryness. Derivatisation mixture was made by mixing 2 mg dithioerytrol (DTE), 2 µL trimethyl silylimidazole (TMSI), and I 000 µL N-methyl-N-(trimethylsilyl)-tri-fluoroacetamide (MSTFA). To the derivatisation vials 50 µL of that mixture was added and caped in order to be shaken. The vials were placed in an oven at 60 °C for 60 min. A fterwards, the vials were placed at the thennostat controlled heating block and evaporated to dryness under stream of nitrogen. The samples were dissolved in 250 µL heptane and transferred to GC-vials again. The GC oven temperature was maintained at 80 °C for I min, then programmed at 25 °C/min to 230 °C, followed by I °C/min to 248 °C, and finally 45 °C/min to 320 °C, which where hold for 3 min to ensure most of other organic compounds also came out.
2.6 Data treatment
The treatment effectiveness is evaluated based on the Electrical Energy per Order (EEO) (unit kW him\ which is defined as the electrical energy consumed per unit volume of water treated required for 90 % removal of the investigated compound [5].
The nonnalised concentration of the investigated chemicals was plotted against the electrical energy dose. These plots were used for estimation of the electrical energy per order.
The curves were fitted to the data using nonlinear regression.
(
C)
- Ilog - =-- EED (!)
C, EEO
; where C; and C is the initial and the final concentration, respectively, EED is the electrical energy dose in kWh/m3 and EEO is the electrical energy per order.
The regression is done by minimizing the sum-of-squares of the vertical distances of the data from the curve. The points were weighted by !/Y2 (relative weighting) [6].
�
�
Kalmar ECO-TECH '07 KALMAR, SWEDEN, November 26-28, 2007
c:::::J Wastewater =rapwater 100
�
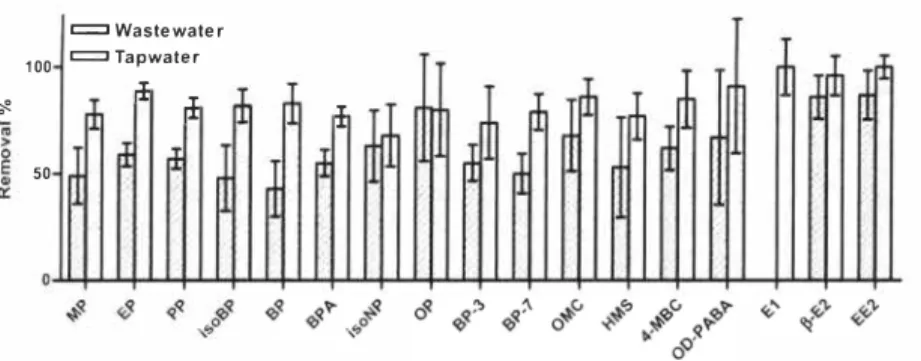
:i50
Figure 2: The remol'OI of estrogenic compounds fi'om tapwater and wastewater effluent by UVIH2O2. The electrical energey dose was 1,8 kWh/ 1113 and the initial concentration of
hydrogen peroxide was 60 mg!L The error bars present the 95 % confidence interval.
3 RES UL TS AND DISCUSSION
3.1 The Effect of water matrixe on the removal by AOP
A single experiment was done in tap water for comparison of the efficiency of UY/ H2O2 treatment in different water matrix. Figure 2 shows the removal of the compound in tap water and wastewater effluent with an initial concentration of hydrogen peroxide of 60 mg/L It is seen in Figure 2 that the removal is greater in tap water than in wastewater effluent. This is due to higher contents of other materials than the spiked compound in the wastewater effluent. They can act as scavengers of "OH radicals and/or result in shadow effect, where the compound either block the pathway of the light or adsorb the light.
Furthermore, the activation of hydrogen peroxide was higher in the tap water (2 1 %) than in the wastewater ( 1 1%), which may be due to less shadow effect in the tap water resulting in a larger amount of the light being used for photolysis of H2 02. These results were in accordance
with the literature. Neamtu et al. [4] found the same tendency when they investigated the removal of BPA.
3.2 Removal
At high EEO the water thus the compounds, is exposed to a high dose of UV radiation and a high removal is obtained. If the results from UV and UV /H2O2 treatment with a electrical
energy dose of 2.3 kWh/m3 is compared, it is seen that a higher removal was obtained at UY/H2O2 treatment than only UV irradiation.
In the case of UV/ H2O2 treatment the removal seems more similar than when treated with UY. With an EEO of 2.3 kWh/m3 the removal is within the range of 5 1 % to 95 % (5 1 to 86
Kalmar ECO-TECH '07 KALMAR, SWEDEN, November 26-28, 2007
=
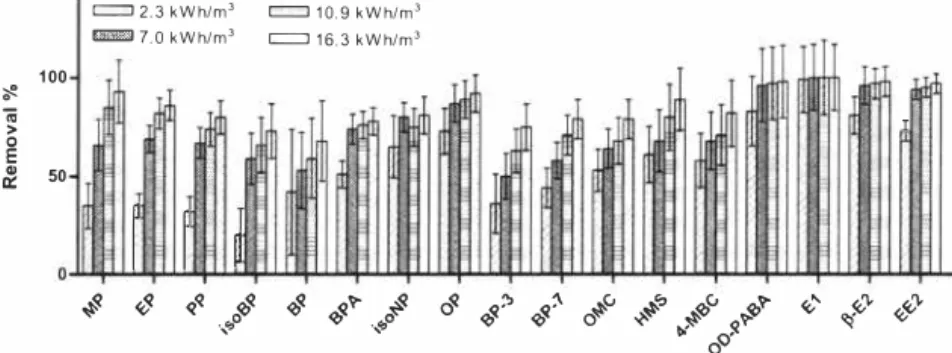
2,3 kWh/m 3=
10.9 kWh/m 3 IIE!5I 7.0 kWh/m 3=
16.3 kWh/m 3 100 'if!, E&!
;;; 0 50 > lr
r
I
"' .f-<8
q<l ·, "o'cq q,'l 'c �'?'#
o'l 'c�!" <o/'
0 �<, �<, 'c<, �?''c'?'«-"
«i"
«;<v ·{,p � "'� !:)' 0Figure 3: The removal of estrogenic compounds from wastewater effluent by photplysis. The error bars present the 95% confidence interval.
3,3 Electrical energy efficiency
The compounds with low value of EEO are easier to degrade than the one with higher value. In Table I it is seen that the addition of hydrogen peroxide to the UV treatment results in a lower energy consumption (lower EEO values). The compound which value of EEO is
between 1 1,5 and 28 kWh/ml for UV treatment, will have a reduction of EEO to
approximately 7-8 kWh/ml if 60 mg H202 is added,
The values of EEO for UV treatment are between 1.2 kWh/ml and 28.0 kWh/ml for estrone (El) and butylparaben, respectively, For the AOP the value is more unifom1, BPA and BP-7 are the ones that require the most energy to be removed one order of magnitude (8. 7 kWh/m3 J, Estrone (E I ) probably would be the one that require smallest amount of energy according to the tendency, but the data is missing due to problem with the analysis. The lowest EEO obtained is 1.8 kWh/ml (EE2).
=
1.75 kWh/m 3 Em 7.00 kWh/m 3=
2.33 kWh/m 3=
10.9 kWh/m 3 100 'if!,&!
;;; E 0 l > . 1 I 50Figure 4: The removal of estrogenic compounds fi'om wastewater effluent by AOP. The initial concentration of H202 was 60 mg/l, The error bars present the 95% confidence interval,
Kalmar ECO-TECH '07 KALMAR, SWEDEN, November 26-28, 2007
• BPA • BPA
cs
u
0,1 0,1 • isoNP • OP 0,01 +---�----'----ll,01+----��---� 0 10 20 0 10 20EEO (kWhim 3 ) EEO (kW him 3 )
• E1 • P-E2 • EE2 • PE2 • EE2
cs
u
0,1 0, 1 10 10 20EEO (kW him 3 ) EEO (kWhim 3 )
Figure 5, Degrada1ion of selec/ed es/rogenic chemicals, left pholo /rea/menl, Righi ADP lrea/menl wilh [H2O2] al 60 mg/L
Table I, Elec1rical energy per order (kWh/ m3)for !he invesligaled compounds by phololysis and advanced oxidalion (60 mg H:,O;,ll),
Compound UV UV/H2O2
EEOe± 95% CI EEO ± 95% CI
MP Methylparaben 13,9 ± 0,2 8, I ± 0,6
EP Ethylparaben 15,9 ± 0,7 5,3 ± 0,3
pp Propylparaben 19,eI ± LI 6,4 ± 0,4
isoBP Isobutylparaben 14,2e± 1,6 7,0 ± OA
BP Butylparaben 28,0 ± 2,9 7,9 ± OA BPA Bisphcnol A 16, I ± 1,9 8, 7 ± L2 isoNP isoNonylphenol I 1,5 ± 2,6 7,6 ± L2 OP Octylphenol 8,e1 ± 1,6 2,6 ± 0, 1 BP-3 Benzophenone-3 25,4 ± I ,3 8,5 ± 0,6 BP-7 Benzophenone-7 2 1, 1 ± e1,4 8, 7 ± 0,5
OMC Octyl methoxycinnamate 19,8 ± 2,2 7,e1 ± L2
Kalmar ECO-TECH '07 KALMAR. SWEDEN. November 26-28, 2007
1 .00 0,75 · - · - EE2
.. ..
0 0.50.
.
.
'. . . .
fl).
.
..
<(-
• • • • • BP-3 I· ...
0,25\
.
..
.
H0 -0--{ _.
\.
-- MP \ ·-0,00 4----'...:;.___,,i-____ ....,______.,. 200 300 400 500 W a ve le nght (nm)Figure 6: The abs01ption spectra and molecule strncture of methylparaben (MP), benzophenone-3 (BP-3) and ethynyl es/radio/ (££2).
3.4 Absorption
In Figure 6 it is seen that methylparaben (MP) has local absorption maximum at 255 nm, benzophenone-3 (BP-3) has at 240 and 30 1 nm while ethynel estadiol (EE2) has at 280 nm. It also seems that MP and BP-3 is absorbing more light in the UV-range than EE2. There is no apparent relationship between the absorption spectra and the degradation with UV or UV H2O2 of the compounds. A high absorbant in the UY-range does not make the compound easier to degrade and it is therefore not enough to have high absorption in the UY-range, but the quantum yield should also be high e.g., EE2 is degraded much easier than BP-3 even though it has a much lower absorbent in the UV-range.
CONCLUSIONS
I t was found that the water matrix had influence at the removal o f the investigated compounds. The organic and inorganic substances in wastewater acted as scavenger compound for the "OH radicals and block the pathway of the UV light. Furthermore it was found that it is important to find the optimum of the concentration of hydrogen peroxide, since to low concentration results in decreased removal and to high also may results in decreased degradation due to fom1ation of the less reactive Ho2• radical.
It was found that all estrogenic chemicals could be removed by photolysis with very varied energy effectiveness and that AOP reduced the spread between the energy effectiveness of removing the chemicals and lowered the electrical energy dose.
In general it was found that the parabens, the industrial phenols, and the sunscreen chemicals required much higher energy dose than the steroid estrogens. BP was the estrogenic
Kalmar ECO-TECH '07 KALMAR, SWEDEN, November 26-28, 2007
compound that required the highest energy dose to be degraded by direct photolysis, while by AOP (UV/H202) it was BPA and BP-7,
Addition of an optimal concentration of He202 reduced the energy consumption by 2-3-fold, which would be economical considering the price of energy and the chemical in Denmark, However, the energy use by the treatment is excessive compared to the energy described to be needed for the same efficiency of removal by ozone treatment [7],
ACKNOW L E D G E M eENTS
The Siemens Foundation, the E U Life project, APOP, and the Danish Research council project, DanEd, is gratefully acknowledged for economic support, Fui1her, technical assistance with analysis by Karina Bomholt Henriksen is recognized,
REFE REN C E S
[I] Segner, H , , Caroll, K , , Fenske, M,, Janssen, C, Maack, G , , Pascoe, D , , Schafers, C , Vandenbergh, G , , Watts, M , , and Wenzel, A , , 2003, Identification o f endocrinedisrupting effects in aquatic vertebrates and invertebrates : report from the European IDEA project,
Ecotoxicology and Environmental Safety 54 (3 ), 302-3e14,
[2] Rosenfeldt, E, J _ and Linden, K, G, , 2004, Degradation of endocrine disrupting chemicals bisphenol a, ethinyl estradiol, and estradiol during uv photolysis and advanced oxidation processes, Environmental Science and Technology 38 (20), 5476-5483,
[3] Chen, P,, Linden, K,, Hinton, D,, Kashiwada, S,, Rosenfeldt, E,, and Kullman, S, 2006, Biological assesesment of bisphenol a degradation in water following direct photolysis and uv advanced oxidation, Chemo;phere 65 (7), 1094- 1 102,
[4] Neamtu, M_ and Frimmel, F,, 2006, Degradation of endocrine disrupting bisphenol A by 254nm irradiation in different water matrices and effect on yeast cells, Water Research 40 (20), 3745-3750,
[5] Bolton, J , R,, Bircher, K. G., Tumas, W., and Tolman, C, A., 200 1. Figures-of-merit for the technical development and application of advanced oxidation technologies for both electric- and solar-driven systems, Pure and Applied Chemist1y 73 (4), 627-638,
[6] GraphPad Software Inc , , GraphPad P rism 5,0 - Regression Guide, http://www,graphpad,com/help/P rism5/, Septemper 18th, 2007,
[7] Huber, MM,, Gi:ibel,A,, Joss,A,, Herrmann,N,, Li:iffler,D,, McArdell,CS., Reid,A,, Siegrist,H,, Ternes,T,A,, and von Gunten, U , , 2005, Oxidation of Phannaceuticals during Ozonation of Municipal Wastewater Effluentse: A Pilot Study, Environmental Science &
![Figure 5, Degrada1ion of selec/ed es/rogenic chemicals, left pholo /rea/menl, Righi ADP lrea/menl wilh [H2O2] al 60 mg/L](https://thumb-eu.123doks.com/thumbv2/5dokorg/3690047.45957/7.611.99.439.86.405/figure-degrada-selec-rogenic-chemicals-pholo-righi-wilh.webp)

