The Perception of Thai Consumers toward
Loose Candy (Lösgodis)
The Study of Product Selection for Thai Market
Advisor:
Tobias Eltebrandt
Examiner:
Ole Liljefors
Authors:
Nutnaree Chaisirivichien (861102)
Vuthi Tansomsakul (850721)
Mälardalen University Sweden School of Sustainable Development of Society and Technology EFO705 Master Thesis, Spring 2011 June 1, 2011
1 | P a g e
ABSTRACT
Title: The Perception of Thai Consumer toward Loose Candy (Lösgodis) The Study of Product Selection for Thai Market
Authors: Nutnaree Chaisirivichien-861102 Vuthi Tansomsakul-850721 mch10005@student.mdh.se vtl10001@student.mdh.se Advisor: Tobias Eltebrandt
Examiner: Ole Liljefors
Keywords: Confectionery market, Thai eating habit, Godis, Marketing mix, Food Marketing, Product attributes, Consumer behavior, Consumer‟s perception, and Sensory evaluation
Institution: Mälardalen University Sweden, School of Sustainable Development of Society and Technology, Box 883, 721 23 Västerås
Course: Master Thesis in Business Administration, 15 ECTS-points, spring semester 2011
Problem: What are Thai consumers‟ perceptions toward sugar confectionery products, which are sold as loose candy (lösgodis) in Sweden?
Purpose: The aim of this study is to identify and describe the perception of Thai consumers toward sugar confectionery products with the concept of loose candy (lösgodis) by putting an emphasis on the preferences of product features and the choices of product as well as explore the similarities and differences of each demographic and psychographic group.
Method: Method included a collection of information concerning theories. model and confectionery market information from different sources; interview with the candy store owner to figure out market insight as well as related information and the survey with a sample of respondents in order to investigate their perception and preferences of the sugar confectionery products. The retrieved data was analyzed statistically and theoretically in accordance with the conceptual framework.
Result: The findings indicated that the majority of Thai people like to consume candy. By allowing consumers to perceive and evaluate candy features through different senses, the result revealed that colorful soft gummy fruity flavors candy with a shape of eatable product together with a uniquely stand-out sweets smell are most preferable. After examining the similarities and differences among the demographic and psychographic groups of consumer regarding their perception and preferences of sugar confectionery products, only minimal differences were found.
2 | P a g e
ACKNOWLEDGEMENT
We would like to express our gratitude to our advisor, Tobias Eltebrandt and Dr. Sasithorn Phonkaew, for the guidance and cheerful support during our working progress. We also appreciate the help of our opponents and friends and would like to thank them for their useful advice and help.
We would like to dedicate this paper to our parents. We would like to express additional appreciation to all respondents who spent their time to help us fill in the survey.
We would like to thank our friends and relatives for their encouragement, care and support.
____________________ ____________________
Nutnaree Chaisirivichien Vuthi Tansomsakul
3 | P a g e
Table of Contents
Table of Figures ... 5 List of Tables ... 5 1. INTRODUCTION ... 1 1.1 Background ... 1 1.1.1 Confectionery Market ... 1 1.1.2 Loose Candy ... 2 1.2 Problem Specification ... 3 1.3 Strategic Question ... 4 1.4 Research Question... 4 1.5 Purpose ... 4 1.6 Target Audience ... 4 2. THEORETICAL FRAMEWORK ... 52.1 The Marketing Mix of Food Products ... 5
2.1.1 Product ... 5 2.1.2 Price ... 6 2.1.3 Place (Distribution) ... 6 2.1.4 Promotion ... 6 2.2 Consumer Behavior ... 6 2.2.1 Consumer Perception ... 7 2.3 Conceptual framework ... 10 3. METHODOLOGY ... 12 3.1 Research Design... 12
3.2 Choice of the topic and the study object... 12
3.2.1 Choice of Topic ... 12 3.2.2 Choice of Industry ... 13 3.2.3 Choice of Country ... 13 3.2.4 Choice of Respondents ... 13 3.3 Data Collection ... 14 3.3.1 Literature Review ... 15 3.3.2 Choice of Theories ... 15 3.3.3 Survey ... 16 3.3.4 Interview ... 18 3.4 Data Analysis ... 18 3.4.1 Survey ... 19
4 | P a g e
3.4.2 Interview ... 21
3.5 Methodological Issues and Limitation ... 21
3.6 Validity and Reliability ... 22
4. Empirical Data ... 23
4.1 Interview Summary ... 23
4.1.1 Store Background ... 23
4.1.2 Loose candy and other relevant factors ... 24
4.2 Thailand‟s Confectionery Market ... 24
4.3 Thailand‟s Retailing Candy Chain, “aki-ko” ... 25
4.4 Multi Sensory Experiences ... 25
4.5 Eating Healthier ... 26
4.6 Top Flavors in Confectionery ... 27
4.7 Climate ... 28
4.8 Survey data ... 29
5. Analysis... 50
5.1 Concept of Loose Candy ... 50
5.2 Preferences of Product Features through Multi Sensory ... 50
5.2.1 Taste ... 50
5.2.2 Texture ... 50
5.2.3 Shape and Color ... 50
5.2.4 Smell ... 51
5.2.5 Package ... 51
5.2.6 Brand ... 51
5.2.7 Place ... 51
5.3 Consumer Sensory Attribute ... 51
5.4 Segmentation ... 52
5.4.1 Demographic ... 52
5.4.2 Psychographic ... 53
6. Conclusion ... 55
6.1 Managerial Implication ... 56
6.2 Suggestion for Future Research ... 57
REFERENCES... i
BIBLIOGRAPHY ... iv
APPENDIX ... v
Appendix A – Draft Questionnaire... v
5 | P a g e
Appendix C – Interview Questions ... x
Appendix D – Survey Empirical Data from SPSS ... xi
Table of Figures
FIGURE 1: PICTURE OF LOOSE CANDY (OWN PICTURES) ... 2FIGURE 2: INTERNATINAL PLANING PROCESS (INSPIRED BY CATEORA ET. AL., 2009, PP. 315) ... 3
FIGURE 3: THE MARKETING MIX (OWN ILLUSTRATION) ... 5
FIGURE 4: LENS MODEL (HAUSER, 1993) ... 7
FIGURE 5: CONCEPTUAL FRAMEWORK (OWN ILLUSTRATION) ... 10
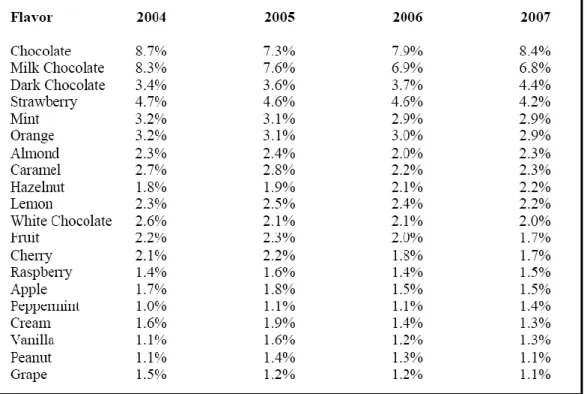
FIGURE 6: PICTURE OF GOTT LAND (OWN PICTURES) ... 23
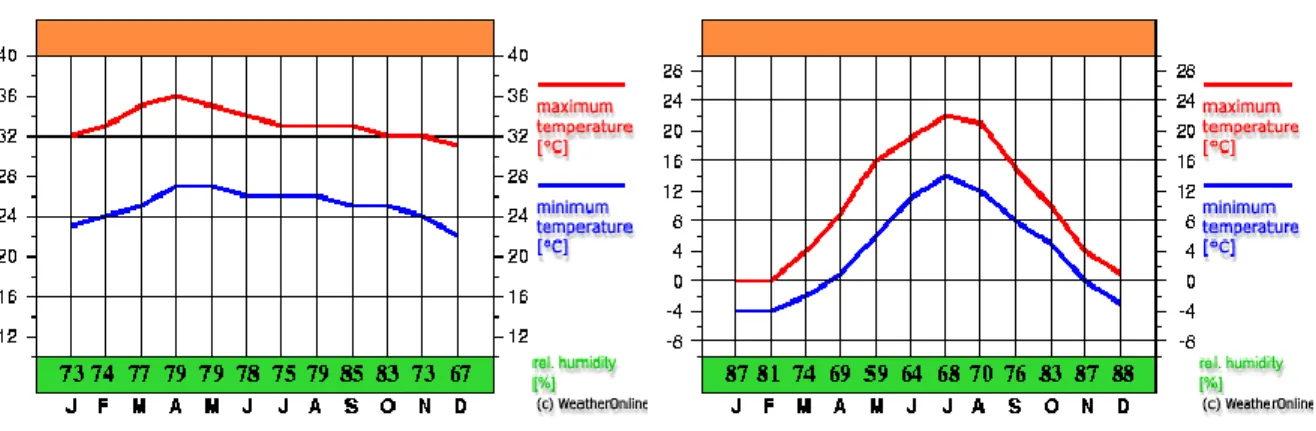
FIGURE 7: TOP 20 FLAVORS IN NEW CONFECTIONERY PRODUCT INTRODUCTIONS, % OF ALL PRODUCTS LAUNCHED IN 2004-2007 (RAITHATHA, 2008) ... 27
FIGURE 8: THE ANNUAL TEMPERATURE IN THAILAND AND SWEDEN (WEATHERONLINE LTD., 2011) ... 28
List of Tables
TABLE 1: SUCCESSFUL RATE OF VALID RESPONDENTS ... 29TABLE 2: PROFILE OF RESPONDENTS IN THIS SURVEY ... 29
TABLE 3: CANDY CONSUMPTION ... 30
TABLE 4: PLACES TO BUY CANDY ... 31
TABLE 5: DESCRIPTIVE STATISTIC OF PRODUCT FEATURES: 15 CANDY ... 35
TABLE 6: TOP 3 CANDY BY EACH PRODUCT FEATURE ... 36
TABLE 7: CORELLATIONS COEFFICIENT VALUE BETWEEN PRODUCT TASTE AND RESPONDENT'S WILLINGNESS TO BUY ... 37
TABLE 8:CORELLATIONS COEFFICIENT VALUE BETWEEN PRODUCT TEXTURE AND RESPONDENT'S WILLINGNESS TO BUY ... 38
TABLE 9: CORELLATIONS COEFFICIENT VALUE BETWEEN PRODUCT SHAPE AND RESPONDENT'S WILLINGNESS TO BUY ... 38
TABLE 10: CORRELATIONS COEFFICIENT VALUE BETWEEN PRODUCT COLOR AND RESPONDENT'S WILLINGNESS TO BUY ... 38
TABLE 11: CORRELATIONS COEFFICIENT VALUE BETWEEN PRODUCT SMELL AND RESPONDENT'S WILLINGNESS TO BUY ... 38
TABLE 12: GENDERS AND BUYING INTENTION OF FRIED EGG ... 39
TABLE 13: GENDERS AND BUYING INTENTION OF RED METER ... 39
TABLE 14: GENDERS AND BUYING INTENTION OF CANDY CANE ... 39
TABLE 15: GENDERS AND BUYING INTENTION OF JELLY BEAN... 39
6 | P a g e
TABLE 17: AGE GROUPS AND INTENTION TO BUY FRIED EGG ... 40
TABLE 18: AGE GROUPS AND INTENTION TO BUY RED METER ... 40
TABLE 19: AGE GROUPS AND INTENTION TO BUY CANDY CANE... 40
TABLE 20: AGE GROUPS AND INTENTION TO BUY JELLY BEAN ... 40
TABLE 21: AGE GROUPS AND INTENTION TO BUY BLUE SHARK... 41
TABLE 22: INCOME LEVELS AND INTENTION TO BUY FRIED EGG ... 41
TABLE 23: INCOME LEVELS AND INTENTION TO BUY RED METER ... 41
TABLE 24: INCOME LEVELS AND INTENTION TO BUY CANDY CANE ... 42
TABLE 25: INCOME LEVELS AND INTENTION TO BUY JELLY BEAN... 42
TABLE 26: INCOME LEVELS AND INTENTION TO BUY BLUE SHARK ... 43
TABLE 27: LIFESTYLES AND INTENTION TO BUY RED METER ... 44
TABLE 28: ONE-WAY ANOVA - GENDER & TOP PRODUCT FEATURE PREFERENCE ... 44
TABLE 29: ONE-WAY ANOVA - INCOME/ALLOWANCE & TOP PRODUCT FEATURE PREFERNCE 45 TABLE 30: ONE-WAY ANOVA - GREEN LIFESTYLE & TOP PRODUCT FEATURE PREFERNCE ... 46
TABLE 31: ONE-WAY ANOVA - HEALTHY LIFESTYLE & PRODUCT FEATURE PREFERENCE ... 47
TABLE 32: ONE-WAY ANOVA - FASHION LIFESTYLE & PRODUCT FEATURE PREFERENCE ... 47
TABLE 33: ONE-WAY ANOVA - TECHNOLOGY LIFESTYLE & PRODUCT FEATURE PREFERENCE 48 TABLE 18: DESCRIPTIVE STATISTIC OF CANDY FEATURES ... 49
1 | P a g e
1. INTRODUCTION
This chapter introduces the readers with the general overview of the research area followed by the present of the problem specification as well as states the strategic question, the research question and the purpose of the study. Later, the chapter concludes with the indication of the target audience of this study.
1.1 Background
This section gives the reader some information regarding the industry background as well as related topics.
1.1.1 Confectionery Market
Confectionery market is referring to the market of sweet, candy and other products in form of confection. This market can be segmented into three different categories including; chocolates, sugar confectionery and gum. The global confectionery market was worth 152 billion USD in the end of 2010. Business Insight (2011) forecasted the market to grow at a CAGR (consolidated annual growth rate) of 3 percent from 2010 to 2014 reaching a value of 171.2 billion USD in 2014. The reasons behind the forecast growth of the industry were due to the increase complexity in development market and rising demand in emerging markets. (Business Insights, 2011, pp. 16,47)
Africa and the Middle East will have the fastest growing rate with a CAGR of about 3.8 percent during 2010 to 2014 followed closely by Asia-Pacific market at a CAGR rate of 3.7 percent and expecting to reach a value of 30 billion USD by 2014. The main factors driving the growth of these markets are the raise of the disposable income of the growing middle classes and the increase popularity of gifting confectionery during special occasions and holidays. (Business Insights, 2011, pp. 47-49)
Thailand‟s confectionery market valued more than 10 billion THB or 3.3 million USD1
in year 2008. Sugar confectionery contained the highest market share among the three confectionery categories in Thailand with an estimation of 50 percent of the market. While the rest of the market shares were equally distributed among chocolate and gum category at 25 percent each. (Thansettakij Co., Ltd., 2009)
The statistical report showed that the annual average confectionery consumption of each Thai consumer was at 700 grams, which was lesser than some other countries such as the United States, England, and Vietnam that consumed 12, 10 and 2 kilograms per person respectively. However, rather than seeing the compound annual growth rate of 1 percent between 2004 and 2009 in Thai market as a relatively low rate, experts view it as an opportunity for potential growth due to the level of maturity. Since there is more room for the unmature market like Thailand to expand and the marketers to introduce new products to the consumers, this market become more interesting and open to more opportunities than thoes in Europe or America. (Thansettakij Co., Ltd., 2009; Datamonitor, 2010)
1
2 | P a g e Sweden considered being one of the world largest sweet consumption compromising of a large number of confectionery producers from both domestic and international (The Local, 2011). Leading Swedish candy manufacturer include Malaco (Leaf International), Cloetta Fazer AB, Grahns‟ and many more. With a constant compound annual growth rate of 0.8 percent in Swedish confectionery market and an increasing competitors from both in and outside of the country, pressuring the local producer to look for new opportunities just like other international producers (Karamellkungen, 2011; Datamonitor, 2010).
1.1.2 Loose Candy
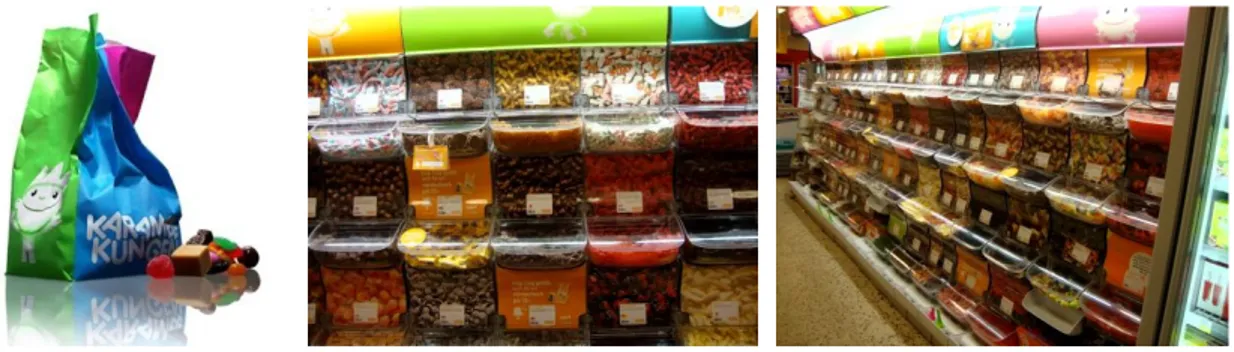
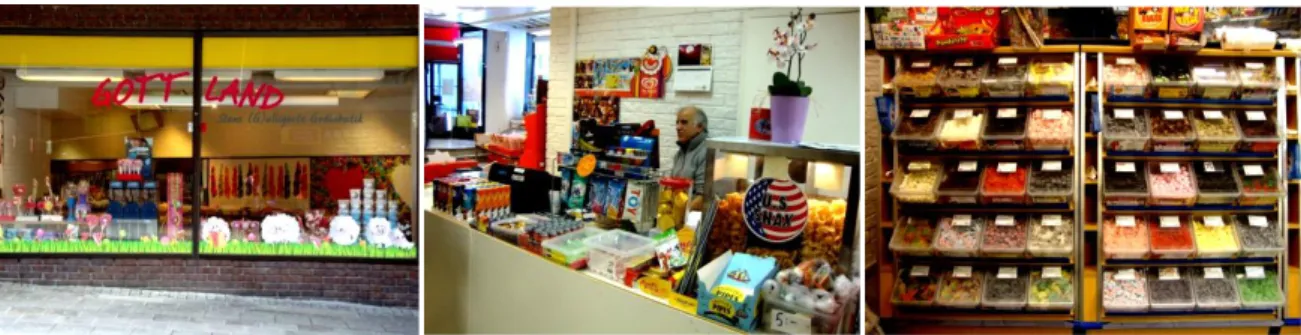
The concept of loose candy or „lösgodis‟ in Swedish is referred to the pick and mix candy concept. Rather than pack in some kind of packages, the candies were loose and sit in some kind of container. By being so, it allows the consumer to pick/scoop their own choice and amount of candy from various boxes or containers of candy available in almost every supermarket, candy store, gas station and kiosks all over Sweden (see Figure1). The price of the candy is measured by the weight of the total amount of candy selected by the individual. Since the concept was introduced in the 1980‟s, Swedish people started to consume more candy. (Karamellkungen, 2011;The Local, 2011)
Figure 1: Picture of Loose candy (Own Pictures)
Candy or Godis is very popular in Sweden. Swedish people at all ages love candy and Sweden also ranked as the highest candy consumption in the world with the annual average consumption rate at about 17 kilograms per person and their consumption reach its peak amount during Easter and Christmas holidays. Interestingly, non-chocolate candies such as gummy candies with various shapes, colors and flavors are more popular than chocolate. Within this category, some of the major Swedish producers and retailers claim that they have more than 200 or even 300 different combinations of shape, flavor and style. This makes having the right combination of candy and its availability the most important factors in the business. (The Local, 2011; Karamellkungen, 2011; Optima Trade, 2011)
Many people are afraid of the additives in food but not in candy. In fact, the ingredients of candy are a bigger problem than the addictives although all of them are tested and approved. For example, Red raspberry boats and Ferrari cars candies get their color from dried bugs and some other candies contain pig gelatin. Regarding the cleanliness of loose candy, it is considered to be hygienic because of the dryness and the amount of sugar it contains. These make it hard for bacteria or virus to survive. (The Local, 2011)
3 | P a g e 1.2 Problem Specification
When marketers decided to expand or venture into new international market, they require a systematic and total commitment for that foreign market, the new way of performing and operating tasks as well as the need to understand the consumer behavior of that country (Cateora et al., 2009, p.9). Marketers who tried to operate in foreign country face a wide range of unfamiliar problems and uncertainties, which require them to implement different strategies necessary to encounter the situation. In order to do so, there is a need for marketers to understand and be prepared of what lies ahead of them (Cateora et al., 2009, p.9).
Here in the case of this study, it is the international marketing task for Swedish candy manufacturer who are interested in entering Thai market to deal with different levels of uncertainty. These uncertainties are created by uncontrollable elements of all business environments both domestic and internationally, consisting of those such as; competitive forces, economic forces, cultural forces, etc. In order to deal with these uncertainties, successful manager constructs a marketing program in which designed for optimal adjustment to the potential customers and the uncertainties of the business climate. Marketers are doing so by changing, adapting and blending their marketing mix to the changing environmental factors as well as selecting the right product that will interest and attract customers, which later on determine the outcomes of the marketing enterprise. (Cateora et al., 2009, pp. 9-10).
As planning is an essential for the success of international marketing, Hult et al. (2007) gave a guidelines and systematic procedures that are necessary for evaluating international opportunities and risk as well as for developing strategic plans to take advantage of such opportunities available. This process of the planning can be summarized in the following sequences or phrase below:
Figure 2: Internatinal Planing Process (Inspired by Cateora et. al., 2009, pp. 315)
As recommended performing an initial in-depth study and screening of the potential country and its market in first phrase, a more detail examination of the components of the marketing mix as well as the customer behavior should be examined next. This is where this research is lay upon since the authors see the potential in the Thai confectionery market.
Therefore, the purpose of phrase two is the reflection of the understanding of the target customer by decided on the adjustment of the marketing mix that will cope with the cultural constraints forced by the uncontrollable and the behavior of the consumer in the market in order to achieve corporate objectives and goals (Cateora et al., 2009, pp.14,317- 316).
Phase 1:
Preliminary Analysis and Screening • Matching compnany/countryneedsPhase 2:
Adapting the Marketing Mix to Target Market • Marketing mix requirementPhase 3:
Developing the Marketing Plan • Marketing plan developmentPhase 4:
Implementation and Control • Implementatin, eveluation and control4 | P a g e In order to understand the consumers and their environment, it is important for the marketers to understand how they think as well as how they receive and interpret things. As Engel et al. (1986) had stated in his early study regarding consumer behavior that the process in which stimulation, message or information were received, interpreted and translated into a response is called perception process. As a result, if the marketers want customers to response to their marketing plans and make their purchase it is important for them to understand this basic perception process of the customers so that they are being about to select the right mix of marketing elements for their customers.
1.3 Strategic Question
Given all the nuances associated with the importance of understanding and knowing the target market as well as the consumers before initiate and implement a marketing plan into an international environment, it is important for the marketing manager to answer the following strategic question regarding:
What kind of product selection and other marketing elements should Swedish candy manufacturers or candy retailers use when entering the Thai market?
1.4 Research Question
What are the Thai consumers’ preferences toward sugar confectionery products, which are sold as loose candy (lösgodis) in Sweden?
1.5 Purpose
The aim of this study is to identify and describe the perception of Thai consumers toward sugar confectionery products with the concept of loose candy (lösgodis) by putting an emphasis on the preferences of product features and the choices of product. As the study tried to identify the consumer‟s basic psychological and demographic background, it is able to explore the similarities and differences in product preferences of each group of customers that will allow candy manufacturers to categorize and be able to select the right products that will appeal to the Thai consumers.
1.6 Target Audience
The study might be useful for both marketing managers of a company as well as marketing students who are interested and seeking to understand Thai consumers‟ perception toward confectionery products, especially loose candy (lösgodis). This report would be most practical for candy manufacturers who have decided to enter the Thai market as well as the existing companies or retailers in the market who strive for new opportunities, competitive knowledge about product preferences of consumers and choice of product. They might benefit from this research by adjusting their offering according to these customer groups‟ preferences.
5 | P a g e
2. THEORETICAL FRAMEWORK
This chapter covers concepts, theories and other interconnected academic frameworks that are related and relevant to the area studied. The chapter begins with the description of the marketing mix for food product, levels of product, consumer behavior, consumer perception and its models and ends up with the conceptual framework. These theoretical frameworks mentioned in this section will be mentioned and used in different parts throughout this paper.
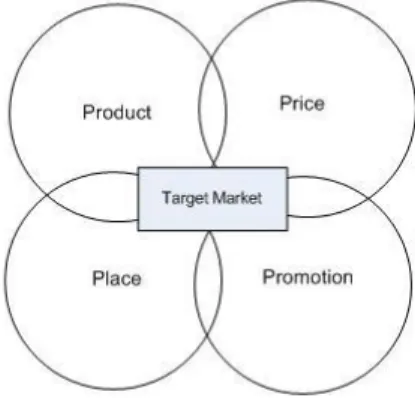
2.1 The Marketing Mix of Food Products
Marketing mix is a set of controllable used by the marketers to influence their target consumers. The elements of the marketing mix are the basic, tactical components of any marketing plan. It is also known as the Four P's or the marketing mix elements including price, place, product, and promotion. (Borden, 1964). As for food products including sugar confectionary product, it is similar to other kinds of consuming products.
In general, food products involve both general marketing approaches and techniques that applied the marketing of various kinds of products and services. Topics such as marketing, segmentation, positioning, targeting, consumer research and market enter strategy are highly relevant in food marketing. Food marketing also involves other kinds of challenges, for example, the nature of food is that it has a perishable date and the quality as well as the availability of food products varies among different types. Even though with the advanced technological development on new processing and distribution options that were used to provide consumer with convenience, the additional marketing, services, and processing are still at a significantly higher costs for food marketers and firms than those other consumer products. (Perner, 2008) Below is the description of each marketing mix with the concept of food marketing.
Figure 3: The Marketing Mix (Own illustration)
2.1.1 Product
Product includes all features such as quality, appearance, packaging, brand, and conveniences It is a part of the offering a company present to its customers (Borden, 1964). For food marketing, firms usually invest in the product by using high quality ingredients in their production or doing extensive research and development to improve it rather than adding a new feature or function like other new consumer product development (Perner, 2008)
6 | P a g e 2.1.2 Price
Pricing is a specific price for a product or service offered. In a simplistic way, it refers to the concept of price as the amount of money that customers have to pay to obtain the product. Setting price is not simple because customers do not purely respond to the price but also the value of the product being offer. (Borden, 1964). For the price on food marketing, some firms compete on price while some other firms compete on other product features such as different taste preferences for different segments or better product quality to charge higher prices (Perner, 2008).
2.1.3 Place (Distribution)
Place or placement is those associated with channels of distribution that serve as the means for getting the product to the target customers. (Borden, 1964). As for food, it is increasingly being consumed away from home, food products are sold in a diversity of outlets various from supermarkets to convenience stores to grocery stores to restaurants and cafes. Supermarkets carry a broad assortment of food products that are generally offered at lower prices. While certain convenience products such as beverages, candies and snacks are being sold in a large number of outlets where consumers are willing to pay at a higher price for their convenience and enjoyment. (Perner, 2008)
In developing countries, food is often sold in open markets or in small stores typically with more local and fewer branded products available. In some European countries, many people do not own cars, and thus smaller local shops may be visited frequently compared with larger shops that are located outside the city central areas. (Perner, 2008)
2.1.4 Promotion
For food marketing, promotion involves many different marketing tools that marketers use to make their customers buying more of their products. It includes advertising, coupons, in-store price promotions, in-store demonstrations, or premiums. The consumption of some food categories has been increasing in a large volume due to the heavy promotional campaign that stimulates consumer demand. (Perner, 2008)
2.2 Consumer Behavior
Consumer behavior is the implication on the learning process of the people when selecting, buying the products or services in order to fulfill their wants and needs. (Solomon, M., 2006) Consumer behavior is different among various demographic groups. Consumer demographics are an important factor used by marketers as a tool to divide and group different types of people using variables such as age, gender, and occupation; by doing so they are able to select their target consumers. These demographic characteristics should not be overlooked as it adds value to the process of understanding consumers‟ behavior. (Evans, et.al, 2009, pp. 154-156) However, psychographics dimensions such as lifestyle, personality, and self-image can also be use to explain consumer behavior in greater depth than the profiling approach of demographics. Thus, it is best suit for marketers to use synergistic contributions of both psychographics and demographics to understand the consumer in order that they will have the right marketing activity for them. (Evans, et.al, 2009, p. 190)
7 | P a g e 2.2.1 Consumer Perception
As mentioned earlier in the introduction that from a consumer behavior point of view, perception is the process where stimuli are received and interpreted by the individual then translated into a response. In other words, marketer‟s message or offering is perceived, interpreted and understood in the intended way during this process. (Engel et al., 1986) Perception can also be defined as the process by which people select, organize and interpret information to form a meaningful picture of the world (Kotler and Armstrong, 2008).
2.2.1.1 Consumer Perception of the Product
According to consumer behavior perspective, product perception is about how consumers perceive a range of brands or product in order to build their personal mapping, which is how consumers perceive the product in term of image relatively to other competing offerings. The understanding of product perception helps marketers to position their own product or brand in the mind of consumers. Marketers should emphasize on what kind of benefits the consumer is looking for and how they perceive products and brands rather than thinking of what it is that you are producing or selling. (Ries and Trout, 1986) Consumer‟s evaluations of the product‟s value are partially drawn from the perception of the product quality as well as the perceptions of price, product image and the brand itself. (Snoj, et al., 2004)
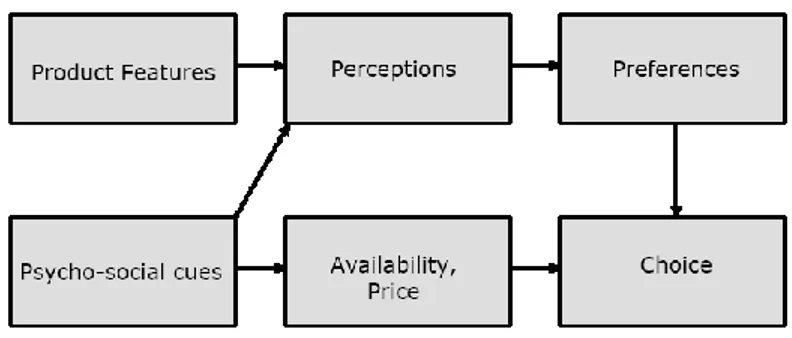
According to Lens Model in figure 4 below, it showed the concept that product features and perceptions are interrelated as consumers see things through the lens of their perceptions and their preferences are based on these perceptions. The product features are understood through these perceptions. After perceiving of product features, consumers would select product based on their preferences; this preferred product is called consumer‟s choice. Therefore, it can be said that the choice of products depend upon consumer preferences. In addition, other influences such as availability and perceived price can also influence the product that the consumer will choose. (Hauser, 1993)
Figure 4: Lens Model (Hauser, 1993)
A number of studies on perceptions of product features stated that the outcome of individual attitudes towards the preferences for the product and its features are based on one‟s perceptions and needs. An individual‟s assessment of new products is analyzed to uncover specific preference patterns that can help understanding and predicting individual‟s behavior. The analysis of consumer preferences tends to highlight the most promising product description in which consumers make their purchase decisions. Product features that are
8 | P a g e usually evaluated by the customers are physical characteristics, price, warranty etc. (Cestre & Darmon, 1998)
Obtaining the best product concept by analyzing overall consumer preferences provides managers with an insight of what product characteristics are best fit the preferences of different consumers as well as what marketing program should be modified to best suit preferences of potential buyers. (Cestre & Darmon, 1998)
2.2.1.2 Consumer Perception and Sensory Systems
Perception act as a phase where the inward stimulus activates the sensory systems of five senses: vision, sound, taste, touch and smell. Evans et al (2008) also discussed that consumers become aware of their environment through these five senses. These senses can be used to find out how individuals interpret messages. (Engel et al., 1986; Hoyer and McInnis, 2001, pp. 92-95)
In a cross-cultural perception, vision and taste may have a huge effect on consumers‟ choice for a product (Hoyer and McInnis, 2001, pp.92-95). Similarly, taste and texture of product also considered having an effect on consumer perception. Interestingly, the first taste is usually evaluated through the eye not the mouth. As a result, product appearance such as its physical tangibility and packaging could lead to the modification of flavor perception and level of food acceptance. (Imram, 1999) Product taste is important in this scenario and it is a significant variable for marketing food or beverages. Furthermore, the product tastes are also different based on the country or region in which they are being sold. The adaptation on product taste is basically different from one group to the others. (Hoyer and McInnis, 2001, pp. 92-95)
Sensory Evaluation
Seeing how important sensory have an impact on consumer behavior , now there is a need to know how each element works together which lead to the field of sensory science. The goal of sensory science is to understand the product person interface. In other words, exploring how a person‟s senses work. Sensory testing involves human participants. However, a human is a hard measuring instrument to work with as they come with various degrees of knowledge, experiences, differing genetic sensory capabilities and different preferences. Therefore, each person is different from one to another. (Lawless & Heymann, 2010, pp. 1-2) To see how one evaluating things, scientist used something called sensory evaluation. This evaluation has been defined as a scientific method used by people to stimulate, measure, analyze, and interpret responses they have to products as they perceived it through the senses of sight, smell, touch, taste, and hearing (Stone and Sidel, 2004). Sensory evaluation include a set of techniques that are able to measurement a person‟s responses to foods in which the biases effects of the product‟s brand and other influential factors on consumer perception can be minimized (Lawless & Heymann, 2010, pp. 1-2). The perception of the sensory attributes, which are smell, flavor, and texture of food, is a dynamic value and changes from time to time (Lawless & Heymann, 2010, p. 179).
9 | P a g e
Principal Factors in Food Evaluation
There are four principal quality factors in food flavor, texture, appearance and nutrition. More detail are listed below (Bourne, 2002, p.2)
1. Flavor, includes taste (perceived on the tongue) and odor (perceived in the olfactory center in the nose). It is the response of receptors in the oral and nasal cavities to chemical stimuli, which are called the chemical senses.
2. Texture is primarily the response of the tactile (touch) senses to physical stimuli that result from contact between some part of the body and food; such as hands, lips, teeth tongue and etc.
3. Appearance comprise of color, shape, size, gloss, which use by the optical sense. 4. Nutrition refers to both major nutrients (carbohydrates, fat, and protein) and minor
nutrients (minerals, vitamins, fiber).
However, other factors such as cost, convenience, and packaging of food products, are also important but are not considered as quality factors of foods. The first three factors listed above (Flavor, and Texture, and Appearance) are called sensory acceptability factors because they are directly perceived by the person‟s sense. The sensory acceptability factors for food are important because it is how people obtain great enjoyment from eating the food they like and it is how they values and perceive the food. This enjoyment of food is called sensory pleasure. (Bourne, 2002, p.2)
Flavor (Taste)
There are four classical tastes of food; sweet, salty, sour and bitter. They are used to determine the perceptual taste qualities (Lawless & Heymann, 2010, p. 30). The definitions of taste belong to the culture heritage of human society. As there are differences in tastes among different people and regions in different parts of the world, tastes have been evolved over time. Taste is simply defined as flavor in which individual sense through their tongue and palate. It can also mean knowledge or the sensorial assessment of what is pleasing or displeasing. Taste is a cultural experience transmitted from one generation to the next from birth along with other variables that together define the values of a society. For something that can be called the perfect food, all the tastes should be simultaneously presented. (Montanari, et. al, 2006, pp. 61-65)
Texture
Food texture is used as an indicator of food quality. In some foods, the perceived texture is the most important sensory attribute. The importance of texture and the overall acceptability of foods are based on the type of food. It can be broken down into three groups, which are critical, important and minor. Critical is food in which texture is the dominant quality characteristic. For important, it is foods in which texture makes a significant but not a dominant contribution to the overall quality. Lastly, minor, it refers to food in which texture makes a negligible contribution to the overall quality. (Lawless & Heymann, 2010, p. 260) There is a range in textural characteristics of foods. For example, the chewiness of meat, the softness of marshmallows, the crispness of celery, the juiciness of fruits, the smoothness of
10 | P a g e yogurt, and the melting of jelly. There is no right texture because many different types of textures are demand by different types of people. Preferences (acceptability) and texture perception are decision made by people every time they eat without much conscious thought. (Bourne, 2002, p.1-34)
Appearances (Shape and Color)
Some studies stated that product appearances are those include product color and other appearance properties such as physical form (shape and color). Previous scientific studies have shown that the appearance and color of food is a primary indicator of perceived quality, and color of the food product also have effects on the perception of other attributes, such as aroma, taste, and flavor. Similarly, in food processing and cooking, color serves as a cue for the doneness of foods and is correlated with changes in aroma and flavor. Moreover, color and flavor interactions are likely real. The perceived color of an object is affected by three entities: the physical and chemical composition of the object, the spectral composition of the light source illuminating the object, and the spectral sensitivity of the viewer‟s eyes. (Lawless & Heymann, 2010, pp. 283-299)
2.3 Conceptual framework
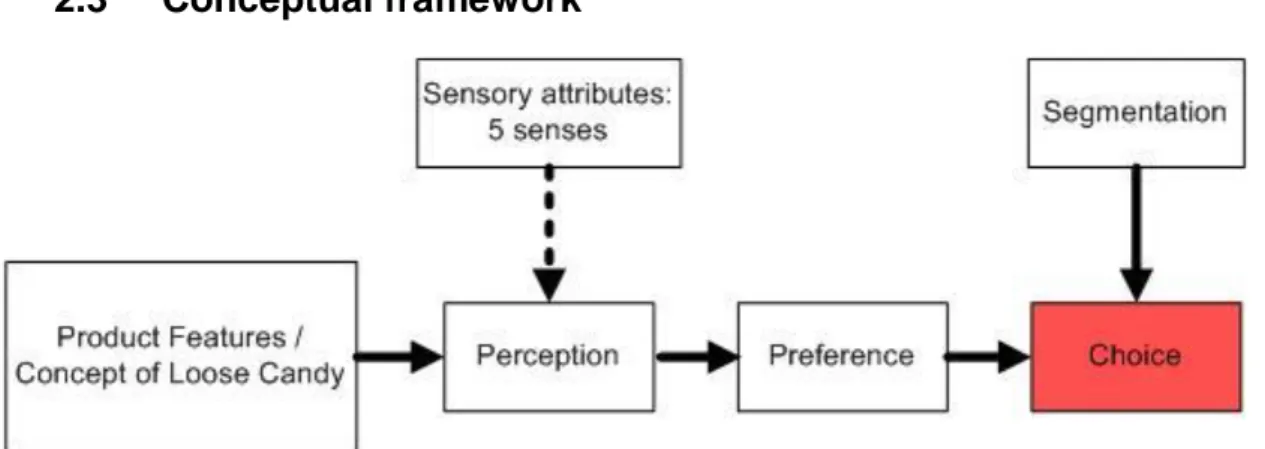
Figure 5: Conceptual framework (Own illustration)
This conceptual framework is based on literature reviews and relevant concepts of marketing, product and consumer behavior as mentioned earlier in the beginning of this chapter. As the above figure, there are six linkages of variables in this framework.
The starting point is at the Loose Candy including Product features which are referred to the attributes of sugar confectionary and those in loose candy - taste, texture, shape, color, package, and brand as well as the concept of loose candy itself.
Consumers perceive Loose Candy using the lens of perceptions through almost every sense out of five sensory attributes (vision, sound, taste, touch and smell) except sound. Afterwards, their preferences are developed based on those perceptions; therefore, the linkage between product features, perception, and preference are created. This means that consumer preferences are created based on perception after perceiving of the product features.
11 | P a g e After perceiving and evaluating the product features, consumers would then select the product they like most based on their preferences. This product being selected is called as “choice”. However, the choice made by consumers was influenced by a variable called “segmentation” which includes both demographic characteristics (age and gender) and psychographic dimensions (lifestyle, personality, and self-image) in which made each individual different.
12 | P a g e
3. METHODOLOGY
This part describes the method that was used in this research as well as the reason for choosing the particular topic, particular research methods as well as the plan for collecting data from both primary and secondary sources.
3.1 Research Design
Research Methods refers to a systematic and logically arranged process of collecting data for the purpose of gathering information to solve or answer a particular research problem or question (Jankowicz, 1991). Research methodology can be divided into two main types: quantitative and qualitative methods. According to Colin Fisher, quantitative method deals with numbers and its findings are arrived from statistical measurement and procedure. On the other hand, qualitative research method emphases on the depth understanding of the respondent and reach the conclusion by focusing on an explanation of words rather than numbers (Fisher, 2007, p.62).
In literatures regarding research methods, there are debates regarding which research methods or techniques are more suitable or „scientific‟ than others rather than choice a particular type, Jankowicz (1991) emphasized that which method is suitable for one research or project depends on the research problem and its purpose. As for the purpose of this research was emphasizing on testing, verifying and describing consumer‟s perception toward the sugar confectionary product especially the Swedish loose candy (lösgodis) under a controlled measurement, a mixture of qualitative and quantitative method was selected as a research method for this study. The combination of experimental product (candies) tasting with a structured questionnaire conducting with a group of people from 2-9 people was used as a tool to gather the date needed along with a small personal interview with the candy store owner who has a certain level of experience and knowledge about the candies and the industry.
3.2 Choice of the topic and the study object
The following section presents the different choices that were made for this study and their reasons behind each selection.
3.2.1 Choice of Topic
Choosing the right topic is a crucial stage of writing a dissertation, Fisher (2007, pp. 31-32) provides criteria for selecting a topic as it has to be interesting for the person who is doing the research as well as the external audiences. The topic selecting for this current research was focused on the perception on product features and preferences of Thai consumers towards such sugar confectionary products as loose candy (lösgodis) as its managerial implication is to help Swedish candy manufacturers in marketing and fitting their products to Thai consumer preferences before entering Thai market. Millions of people everywhere in the world, thus, consume candies in authors‟ opinions; this study was regarded to be interesting for external readers. Moreover, Swedish loose candy was also of the authors‟ interest to explore and analyze.
13 | P a g e In addition, Fisher (2007, p. 32) also emphasized on the important of the durability of the topic that it should be relevant in a year‟s time meaning that the data and information collected should not face any rapid change during the length of the research. As the paper is focusing on consumer behavior, the result and data collected should not be interference with any of the mentioned problems.
3.2.2 Choice of Industry
This paper is based on the study of sugar confectionary products including the Swedish loose candy in confectionery market. One of the most important reasons for this choice of confectionery industry was the fact that loose candy or lösgodis is very popular in Sweden. Swedish consumers of all ages like to consume candy, which ranked the highest sweets consumption in the world and consume twice as much as candy as the average European consumers. (Dagens Nyheter, 2011; Simpson, 2010)
Moreover, another contributing factor for this choice of industry was the authors‟ personal interest and previous experience with the industry. After group discussion regarding potential research capability and overall concept of loose candy as well as Swedish candy consumption, confectionery industry was decided to be the selecting choice for this research. However, the focus of this research paper was limited to only loose candy that are in sugar confectionary instead of chocolate or gum due to the fact on Swedish candy consumption that non-chocolate candies such as gummy candies with various shapes and colors are more popular than chocolate in Sweden. (Swedish Freak, 2011) Thus, non-chocolate loose candies were considered as more interesting for this study and being seen as an opportunity for Swedish manufacturers in expanding and introducing loose candy to new confectionery markets.
3.2.3 Choice of Country
Even though the concept of loose candy (lösgodis) has been widely spread in some countries especially in Europe and America, the concept itself regardless of the products is new to Thai confectionery market since it was rarely found in the marketplace and this made the Thai market become much more interesting for this study.
The accessibility of resources and relevant information to the field of research and people who helped in answering the research has been considered while deciding on the selecting choice of potential country for this paper. By narrowing the focal area of research to be only in the Thai market, this limits the breath of the research field to which is accessible and suitable for the time and energy available for the authors to carry out the project. Another reason why Thailand was chosen for this research is that both of the authors are Thai and they have both accesses and capability to reach the potential Thai respondents living in Sweden since this research was conducted in Sweden alone.
3.2.4 Choice of Respondents
Due to the fact that the research is studying overall customers‟ perception of Thai customers toward loose candy, only Thai respondents were selected using a convenient sampling
14 | P a g e approach and was decided to be current candy consumers whose ages range from 20 to 30 years old both male and female studying at Mälardalen University. The rationale behind the selected age group was because more candy and confectionery products in Thailand were consumed by people at younger ages (Datamonitor, 2010). Moreover, these people are considered to be mature, with certain life experience and expected to be able to make their own decision about their daily activities.
Since the design of the survey was a mixture of experimental product tasting and structured questionnaire, which required the authors to be present and the need for having the sample candy available for respondents to try when the survey was conducted, only Thai people living in Sweden were chosen. In addition, conducting the survey in Sweden also allowed the authors the accessibility to the candy (sugar confectionery products) which was the main focus of this study. Moreover, carrying the survey in Thailand would create an accessibility barrier for the authors as well as possibility of increasing an error and mislead data.
Moreover, as the study was aimed to explore the similarities and differences among different demographic and psychographic group of the consumer, the respondents were to be asked questions regarding their personal background such as age, gender, income as well as their basic lifestyles in order to be able to categorize them into different groups.
According to Fisher (2007, pp. 189-190), the size of the required sample is partly depended on the margin of error researcher prepare to accept and the size of the population from which the sample is going to be taken from. However, due to the chosen method design and the in-depth data that was able to produce from the research, a smaller number of samples were selected. With a limited number of Thai students available in the location of the research, approximately 85 people were asked to perform in the survey, in which 75 people were willing to engage and responded to the authors‟ request in this research.
As mentioned in the theoretical framework chapter that taste belong to the culture heritage of human society and was passed on from generation to generation creating a similarity of taste preferences among the same group of people. Since the purpose of this research is to describe and explore the consumer perception and preference in order to gain a deeper understanding of the consumer rather than representing the population, the selected sample size was considered to be enough and able to deliver valid data and result as well as providing a guideline for the marketers regarding the consumer‟s taste, preference and perception of the sugar confectionary product.
3.3 Data Collection
The research was based on the data collecting from a quantitative research using a mixture of product sample tasting survey with structured questionnaire as well as other external sources such as documents (press release, articles in the mass media, news article and internet), organizational records together with the literature review.
15 | P a g e 3.3.1 Literature Review
The authors began collecting secondary data through various sources. Different books, journal articles and pervious student dissertations as well as internet sources were chosen as the sources for the literature review. The authors made sure that the information sources would be relevant to the subject of study and were a truth worthy and reliable sources.
The books that were chosen as a reference were mainly from Mälardalen University‟s library and also from a personal collection of the authors. The authors used different online database and library catalogues to retrieve journal and articles available via the university network. The databases used included Diva: Academic archive online, ABI/INFORN Global (ProQuest), Business Insight, Google Scholar search engine and other webpage that was relevant to the topic study. The authors used key worlds such as “Confectionery market”, “Thai eating habit”, “Godis”, “Marketing mix”, “Food marketing”, “Product attributes”, “Consumer behavior” “Consumer‟s perception”, and “Sensory evaluation” to find both books and articles.
3.3.2 Choice of Theories
The choice of theories was made through the literature review in accordance with the area of the research. The criteria in choosing and constructing the conceptual framework for the current research was conditioned by theories and models that were considered as suitable for understanding consumer perception on product features and their preferences. The concepts and theories were also chosen based upon the purpose of this research.
First section of theories on the marketing mix (4P‟s) of food products together with food marketing concept from Perner L. (2008) was introduced in order to give readers and authors deeper into the field of research on food marketing concept as well as loose candy (lösgodis) and its marketing elements. Moreover, the concept of sensory evaluation and principal factors in food evaluation (flavor, texture, and appearances) were illustrated so as to support the field of study in candy evaluation in order to know how people perceive and evaluate food through their multi sensory. These food evaluation concepts were taken from three text books which are Sensory Evaluation of Food: Principles and Practices from Lawless and Heymann (2010), Food Texture and Viscosity: Concept and Measurement from Bourne A. C. (2002), and 3 Sensory Evaluation Practices from Stone H. and Sidel J. L. (2004).
As a consequence, the concepts of consumer perception and preferences were chosen in order to support the analysis of consumer‟s behavior. Perception theories were taken from Kotler P. and Armstrong G. (2008), Evans et al. (2009), Snoj et al. (2004), Engel J. F. (1986), Imram N. (1999). Lens Model from Hauser that showed the interrelationship between product features and perception were also chosen to support the findings on consumer behavior. In this case of the current research, authors would focus on perception and preferences of people in the local context toward the product features of loose candy, which Swedish candy manufacturers should study before introducing a range of candy selection to new potential markets.
16 | P a g e Moreover, “Business Insights” Journal and Thailand‟s local newspaper, “Thansettakij” were selected to support the previous findings on theoretical framework. The first one from Business Insights was a Future Flavor Trends in Food - New opportunities in sensory innovation; the journal ranked the top flavors in confectionery and discussed about how marketers can take advantage of the link between consumers‟ emotions and their sensory experiences. Furthermore, this journal also mentioned about eating healthy trends and healthy foods. The second one was from Thansettakij Newspaper discussing about Thai confectionery market, market values, and market share among different categories of confectionery products.
3.3.3 Survey
This research mainly focused on gathering primary data using a quantitative method by a structured survey/questionnaire with closed ended questions as a tool to collect the data and a means of measurement. The questionnaire was expected to be able to reveal the consumer‟s perception, their product preferences as well as their choice of product of the investigated research field: loose candy (lösgodis). The authors believed that using a questionnaire together with product tasting survey as well as the interview with candy store owner was be the best method to collect the primary data due to its usefulness in term of time-limitation as well as its ability to cover the depth information required for the data analysis.
3.3.3.1 Survey Design
The authors attempted to design the survey using simple and concise language as well as making it as relatively short and presentable as possible so that the respondents would not spend much time filling in the survey. Moreover, English was using in this survey and was not expected to create any language barrier for the respondent since all of the respondents are an international students at Mälardalen University whose already acquired a decent level of English education.
The questionnaire for this research has been structured and based on the conceptual framework of the paper, which was constructed from various theories and literature concept regarding consumer perception. Several formats of questions were used while structuring the surveys, which contained of seven main questions with a total of 31 sub questions with a mixture of dichotomous, multiple choice, checklist, rating scales and likert scale questions as presented in the Appendix A of this report.
Questions: Variable (Candy consumption specification)
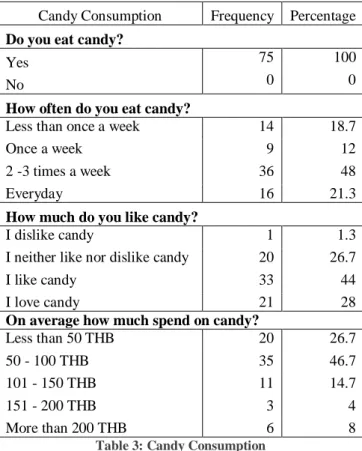
Question 1-5: (Do you eat candy; How often do you eat candy; How much do you spend on purchasing candy per time; How much do you like candy; Where do you buy candy)
The first section of the questionnaire is questions act as a screening question regarding the respondents‟ candy consumption as well as their basic pattern of consumption behavior. The first question helps to identify the respondents whether they consume candy or not since the authors study only current consumers. This question will allow authors to determine if the questionnaire can be included in analysis.
17 | P a g e The second question act as a general question regarding the amount of candy consume measuring by the frequency of eating while the third question asked for the average amount of money spend on each candy purchase. The fourth question is used to identify consumer own identity toward candy as they classify themselves to a hierarchy of likeness toward candy. The fifth question is a checklists question asking for the outlet where the respondent purchases candy. This question used to identify the suitable retail location for loose candy as well as the popularity of each outlet to the respondents.
Questions: Variables (Perception, preferences and choice)
Question 6: (How much do you like each feature of each product; How likely will you buy this product)
Question 6.1 – 6.15 were used to identify consumer perception on product features (attributes) of 15 different loose candies and their preferences toward each of them after they perceived through the sense of the sensory attributes: vision, taste, touch and smell by asking the respondents to rate or evaluate each candy one at a time. Moreover, at the end of each product tasting the writer also asked how likely the respondent will buy each product in order to identify which products was the respondent choice of preferences.
Question 7.1 – 7.9 (Do you agree or disagree with these following statements)
These set of questions are in likert scale used to ask the respondents for their opinion, perception and attitude toward other product features such as brand, package as well as the concept of loose candy. The questions were used to find respondents‟ points of view and perception by asking them to choose a position on a provided five-point scale between strongly agree and strongly disagree which reflects their opinion about certain statement. (Eg. I prefer sugar-free candy; Candy should come in a package; Candy with popular brand is better; I like to be able to select the amount of each candy I buy, etc.)
Questions: Variable (Segmentation/person related factor)
Question 7.10 – 10: (What is your gender; What is your age; What is your income/allowance) The last set of questions were used to classify the respondents into different segments using both demographic and psychographic elements in order to examine the similarities and differences between each group, which could affect their choices of product. For the psychographic elements the likert scale format questions were asked regarding respondent‟s general lifestyle with the statement such as: I am concerned about the environment; I keep up to date with the latest fashion trends; I would rather spend a night out then stay at home.
3.3.3.2 Choice of selected candy sample
According to Karamellkungen (Candy King), Swedish leading candy provider/ seller, loose candy (lösgodis) can be categorized into mainly 8 different types: chocolate, covered sweets, foam, hardboiled, jelly, liquorices, toffee and others (Karamellkungen, 2011). By looking at the different kinds of product offered by Karamellkungen, the authors have chosen 15 kind of products consisted of different flavors, type, shape and color in order to try to capture the
18 | P a g e while range of products as a sample for the respondent to taste, trial and examine. Roughly, two different candies were selected from each 6 main categories: covered sweets, foam, hardboiled, jelly, liquorices, toffee category, most of them are Karamellkungen‟s current popular exported product. Since the research is limited to examine only the sugar confectionery products, chocolate categories of the loose candy was not selected. The list and details of the selected candies was listed in Appendix B.
The different candies were purchased by the authors who was personally ensure that each candy was in its best new condition by trying them before purchase as well as making sure that the candy was store properly for the survey procedure. The authors were doing so by putting each candy in a separate bag to prevent each candy and coating affecting each other as well as putting the candies in an air tight bag in order to prevent the candy to change it form or taste.
3.3.3.3 Distribution of survey
The questionnaire was distributed to potential respondents in person through personal contact as well as though the network of relationship the two authors have with both the Thai student college and the International office of Mälardalen University. The authors administrated every surveys by themselves since the main part of the questionnaire require the authors to provide the respondents with selected candy sample as well as it will allow the authors to minimized answer error as well as being able to administrate the survey thoroughly.
3.3.4 Interview
For this research, an interview in English has been conducted with, Mr. Bahman Bahrami, the store owner of “Gott Land”, a candy store in Västerås, Sweden with the help of translation into Persian by his sale assistant. The interviewer was contacted face-to-face in the store by the authors on May 17, 2011. The interviewee who was the owner of the store agreed to participate in this research, so a list of questions had been asked. The answer to each question was received back after all the questions have been asked.
A list of twelve interview questions was divided into four parts. All the questions were opened answer questions and presented in Appendix C of this paper. This list of the questions was created in advance by the authors regarding to the additional information required on the product and concept of loose candy as well as other relevant factors, which the authors are not able to retrieve from a reliable sources. The information was used so authors could collect necessary data for performing analysis as well as suitable recommendation for the area of study.
3.4 Data Analysis
In order to answer the research question for this paper, the authors had to analyze the empirical data including both the interview as well as the survey data. Both of the data were analyzed together in order to answer the research question and achieve the purpose of the research.
19 | P a g e 3.4.1 Survey
In order to answer the stated research question mention earlier, the authors had to analyze empirical data, which is focusing on the survey data. The survey data was analyzed using the help of statistical software – SPSS, which was chosen because of the capability and variation of the software as well as its easy to use feature (IBM Corporation, 2010).
The data was entered in SPSS program and each question was coded to make the data easier to enter. After entering the data into the program, a selection of statistical tools were chosen to interpret the data according to the type of the variable, the purpose of each question as well as the conceptual framework of the study.
The statistical tools such as frequency were used for multiple-choice questions in order to find the general data of the respondents as well as their basic candy consumption behavior. While statistic tools such as descriptive were used to describe the respondents‟ perception and preferences toward each sugar confectionary products and its features.
Since the main goal of this research is to identify and describe the consumer perception and preference of the sugar confectionary products such that the suitable selection of candy for Thai market can be recommended, when examine the similarities and differences among the consumer, the authors will only investigate those products that are highly interested and rated by the respondents. The mean that were used to select the products was the by looking at the candy that were rated highest among each feature (taste, texture, smell, shape and color) as well and the respondents‟ willingness to buy those products. After reviewing the top ranking candies, only five will be selected and used to investigate for the similarities and differences among different demographic and psychographic groups using a statistical tools such as correlation, cross-tabulation, Chi-squared test and one-way ANOVA.
One-Way ANOVA Statistics
An analysis of variance test or ANOVA is a test used to compare variances in two or more group of data. The test will tell whether there is significant different in the mean average of the groups or not. The use of ANOVA test began with the construction of the null hypothesis: assuming that there is no real different between each group of variables (Pallant, 2010, p 250). In this case, the null hypothesis is there is no real difference between the perception and preferences for the product features of each demographic and psychographic group. If the null hypothesis is rejected, it means that there is a difference in perception and preferences between each group. When analyzed a Contingency Tables was product, which labeled “One-way ANOVA” (Appendix D) to evaluate whether to rejected or accepted the null hypothesis.
Interpreting ANOVA Statistics
The ANOVA test result is called F-statistics, which is the ration of variance and the greater the value of F-statistic usually indicated that the result is significant. However, there is a need to look at the level of significant of the result as well. The significant level is the probability that the null hypothesis is true. It is measure with “Sig.” value in the ANOVA table, which is probability value of getting those sample result if there is no difference between the variables.
20 | P a g e In other words, if the significance level is large, it implies the absence of difference between variables and the null hypothesis will not be rejected. In order to reject the null hypothesis, the level of significant is expected to be no more than 0.05 (5 percent level). This basic significant level of 5 percent will be used for all statistical analysis in this paper (Fisher, 2007, pp. 214-215)
Duncan‟s post hoc test is used to determine the significant between group means in the ANOVA test. The result would divide the group of variables into different groups and it would allow the researcher to be able to classify which group of respondents is different from others as well as calculate the percentage of difference. (Pallant, 2010, p 254)
Chi-square Statistics
Chi-square test was used together with the cross-tabulation statistical tool in order to compare and rest for the present or absent of association between two variables. Moreover, Chi-square test is also often used to compare the proportion of causes from a sample, allowing the researchers to see how the answered were distributed among each group of selected respondents. (Pallant, 2010, pp.219-220, Fisher, 2007, pp. 218-220)
Similar to the ANOVA test, the null hypothesis should be constructing when the test is carried out. In this case the null hypothesis is there is no association (difference) between the willingness to buy the top candies according to the demographics and lifestyles of the respondents. In another words, the response to one question are not associated with differences in response to the other questions.
Interpreting Chi-Sqare Statictics
The Pearson Chi-Square “value” represents the different count and expected count of the valuable. The larger this difference means the bigger the value will be implying the more evident that there is an association between variables. However, the level of significance should be examined before rejecting or accepting the null hypothesis. The result of the Chi-square test presents the level of significant as “Asymp. Sig.” in the contingency table illustrated in Appendix D. (Fisher, 2007, pp.249-250)
Correlation Statistic
Correlation analysis measures the association (relationship) between two or more variables as well as describing the strength and direction of the relationship. The statistical result produced by Pearson‟s correlation range from 1 to -1 indicating 3 different directions or types of correlation: negative, positive and zero. The perfect correlation of 1 or -1 indicates the strength of the relationship. This number is called the correlation coefficient representing by the r letter. The closer the number get to 0 the weaker the relationship.
For the correlation statistic the null hypothesis is that there is no association between the two or more variables. For this research the null hypothesis is that there is no association between the respondents‟ preference of each product feature (taste, texture, smell, shape and color) and their willingness to buy products. (Fisher, 2007, pp.215-216; Pallant, 2010, p.123)
21 | P a g e Interpreting Correlation Statistic
First, the level of significance of the relationship should be examined like the other statistical analysis mentioned earlier indicating the probability that there is a correlation between the two or variables. If the null hypothesis is rejected the strength and direction of the relationship can be analyzed by looking at the correlation coefficient value of each relationship.
According to Rowntree (1991, p. 170) the interpretation of the correlation coefficients can be described as below.
Correlation Coefficient Strength
0.0 - 0.2 Very weak, negligible
0.2 - 0.4 Weak, low
0.4 - 0.7 Moderate
0.7 - 0.9 Strong, high
0.9 - 1.0 Very strong, very high
3.4.2 Interview
Interview data revealed supplementary information that the authors have retrieved from internet sources regarding additional product elements and the nature of product, with some extensional facts that is not covered as well as the interviewee‟s personal opinions regarding the area of the study. Combined with the surveys as well as the secondary data, the interview data was analyzed according to the chosen theoretical framework.
3.5 Methodological Issues and Limitation
The authors faced several methodological problems during the course of this research. To begin, time constraint played an important role throughout the different procedures of the research. With only 10 weeks time frame of the research, the authors only conducted the research among Thai students studying in Västerås area. As there was also a limited amount of potential respondents in this area, this reduced the number of survey that could be conducted.
On the other hand, by limited the respondents to those only living and studying in Sweden create a boundary of possible respondent participating in the surveys to certain groups of people with a certain similar background. Therefore, this limited range and variety of respondents. However, the authors view it as an appropriate selection of respondents and have very little effect on the result of the research due to varies reasons mention earlier in this chapter.
Moreover, as the structure of the method selected for this research required the researcher to be present at the time the survey took place, it limited the capability of mass distributing the survey via sources like the internet or mail service, which as well limited the amount of survey conducted. In addition to the effect of the structure of the survey having upon this research, a large amount of candy sample cannot be selected. The main reason was because