Firm valuation
Which model gives me the most accurate share price, the Dividend
Discount Model or the Free Cash Flow to Equity model?
“What is a cynic? A man who know the price of everything and the value of nothing” – [Oscar Wilde, 1892]
Master Thesis in Finance
Author: Gustav Claesson
Tutors: Johan Eklund
Andreas Högberg Jönköping June 2011
i
Acknowledgements
I would hereby like to acknowledge the following persons for their help and guidance along the way:
My tutors Johan Eklund and Andreas Högberg who have encouraged me for a deeper understanding for the subject, while at the same time providing valuable feedback during this whole process.
My opponents that have been giving me support and valuable critique during the seminars we have had.
Finally, I would like to acknowledge a special thank to my family and friends for their support and patience.
Jönköping, 2011-06-01
___________________________ Gustav Claesson
ii
Master Thesis in Finance
Title Firm Valuation
Authors Gustav Claesson
Tutors Johan Eklund and Andreas Högberg
Date 2011-06-01
Subject terms Stock valuation, future growth prospects, and valuation models
Abstract
Purpose:
The purpose of this thesis is to investigate the applicability of the Free Cash Flow to Equity Model and the Dividend Discount Model on ten large cap firms on the Stockholm Stock Exchange. Moreover the author intends to examine whether these valuation methods differs in regards of the companies’ operational segment, business cycle and turnover. The target prices will hereafter be benchmarked with actual closing prices and professional analysts to observe similarities and deviations.
Method:
The focus lies on Swedish companies listed on Nasdaq OMX Stockholm’s Large Cap list. The companies are valued by collecting financial information from 2006-2010 in order to find out what the share price in the beginning of 2011 should be. The models that are used to value the share are the Dividend Discount Model, which basically discounts actual dividends in order to find the present value of the share, and the Free Cash Flow to Equity model, which is discounting the firms’ cash flow available to its stockholders, i.e. the potential dividends. Since both of the valuation models require assumptions on future growth to be made, a combination of calculations and goals presented by the companies has been made in order to assume growth rates.
Findings:
The findings reveal that out of the twenty valuations that were made half of the most accurate ones came from the Dividend Discount Model, and half came from the Free Cash Flow to Equity model. It was however the Dividend Discount Model that provided the most accurate share prices, in comparison to the actual share prices from January 2011. It is also concluded that the turnover of the firm being evaluated does not have an impact on the valuation process, whilst the industry in which the firm operates as well as its payout ratio are factors that need to be taken into consideration when choosing between the Dividend Discount Model and the Free Cash Flow to Equity model.
iii
Abbreviations
and explanations
Market Capitalization – The market value of a company’s equity, share price times
the number of shares outstanding
ROE – The Return on Equity
FCFE – The Free Cash Flow to Equity DDM – The Dividend Discount Model DCF – Discounted Cash Flow
SCB – Swedish Statistical Service P/E ratio – Price-to-earnings ratio
Large Cap – Stockholm Stock Exchange’s list of companies with a market
capitalization of over one billion euros
Due Diligence – A process whereby an individual, or an organization, seeks
sufficient information about a business entity to reach an informed judgement as to its value for a specific purpose
Intrinsic Value – The fundamental value, or the present value of all future cash
flows
DPS – Dividends per Share EPS – Earnings per Share GDP – Gross domestic product GWP – Gross world product PV – Present Value
v
Table of Contents
1 INTRODUCTION ... 1 1.1 BACKGROUND INFORMATION ... 1 1.2 PROBLEM DISCUSSION ... 3 1.3 PURPOSE ... 5 1.4 DELIMITATIONS ... 51.5 OUTLINE OF THE THESIS ... 5
2 METHODOLOGY ... 6
2.1 METHOD APPROACHES ... 6
2.1.1 Inductive vs. Deductive ... 6
2.1.2 Quantitative vs. Qualitative ... 7
2.2 THE CASE STUDY ... 8
2.3 COLLECTION OF THE DATA ... 8
2.4 LIMITATIONS ... 8
3 THEORETICAL FRAMEWORK ... 9
3.1 OUTLINE OF THE THEORETICAL FRAMEWORK ... 9
3.2 MOTIVES FOR VALUATION ... 9
3.2.1 Who Values Stocks? ... 10
3.3 RELATED CONCEPTS ... 11
3.3.1 The Concept of Value ... 11
3.3.2 Due Diligence ... 11
3.3.3 Capital Market Efficiency ... 12
3.3.4 Capital structure and firm value ... 13
3.4 FINANCIAL MODELS &VALUATION ... 13
3.4.1 Dividend Discount Model ... 13
3.4.2 Free Cash Flow to Equity ... 17
3.4.3 Related concepts and formulas connected with DDM & FCFE ... 19
3.5 THE COMPANIES ... 22
3.6 PREVIOUS RESEARCH ... 23
3.7 ASSUMPTIONS PRIOR TO EMPIRICAL FINDINGS &ANALYSIS ... 23
4 EMPIRICAL FINDINGS & ANALYSIS ... 25
4.1 FUTURE GROWTH ASSUMPTIONS ... 25
4.2 ABB(INDUSTRIAL GOODS & SERVICES –LARGE CAP) ... 25
4.2.1 Financials & Assumptions ... 26
4.2.2 The Gordon Growth Model ... 26
4.2.3 Constant Growth FCFE Model ... 26
4.2.4 Summary Analysis ... 26
4.3 ASSAABLOY (INDUSTRIAL GOODS & SERVICES –LARGE CAP) ... 27
4.3.1 Financials & Assumptions ... 27
4.3.2 The Gordon Growth Model ... 28
4.3.3 Constant Growth FCFE Model ... 28
4.3.4 Summary Analysis ... 28
4.4 ASTRAZENECA (HEALTH SERVICE –LARGE CAP) ... 29
4.4.1 Financials & Assumptions ... 29
4.4.2 Two-stage Dividend Discount Model ... 30
4.4.3 Two-stage FCFE Model ... 30
4.4.4 Summary Analysis ... 30
4.5 ATLAS COPCO (INDUSTRIAL GOODS & SERVICES –LARGE CAP) ... 31
vi
4.5.2 Two-stage Dividend Discount Model ... 32
4.5.3 Two-stage FCFE Model ... 32
4.5.4 Summary Analysis ... 32
4.6 AXFOOD (FAST MOVING CONSUMER GOODS –LARGE CAP) ... 33
4.6.1 Financial & Assumptions ... 33
4.6.2 Two-stage Dividend Discount Model ... 34
4.6.3 Two-stage FCFE Model ... 34
4.6.4 Summary Analysis ... 35
4.7 GETINGE (HEALTH SERVICE –LARGE CAP) ... 35
4.7.1 Financials & Assumptions ... 35
4.7.2 Two-stage Dividend Discount Model ... 36
4.7.3 Two-stage FCFE Model ... 36
4.7.4 Summary Analysis ... 36
4.8 MEDA (HEALTH SERVICE –LARGE CAP) ... 37
4.8.1 Financials & Assumptions ... 37
4.8.2 The Gordon Growth Model ... 38
4.8.3 Constant Growth FCFE Model ... 38
4.8.4 Summary Analysis ... 38
4.9 NCC(INDUSTRIAL GOODS & SERVICES –LARGE CAP) ... 39
4.9.1 Financials & Assumptions ... 39
4.9.2 Two-stage Dividend Discount Model ... 40
4.9.3 Two-stage FCFE Model ... 40
4.9.4 Summary Analysis ... 40
4.10 ORIFLAME (FAST MOVING CONSUMER GOODS –LARGE CAP) ... 41
4.10.1 Financials & Assumptions ... 41
4.10.2 Two-stage Dividend Discount Model ... 41
4.10.3 Two-stage FCFE Model ... 42
4.10.4 Summary Analysis ... 42
4.11 SWEDISH MATCH (FAST MOVING CONSUMER GOODS –LARGE CAP) ... 42
4.11.1 Financials & Assumptions ... 43
4.11.2 Two-stage Dividend Discount Model ... 43
4.11.3 Two-stage FCFE Model ... 44
4.11.4 Summary Analysis ... 44
4.12 SUMMARIZING THE ANALYSES ... 44
5 CONCLUSION ... 49
5.1 CONCLUSIONS IN RELATION TO THE PURPOSE ... 49
5.2 IMPLICATIONS AND SUGGESTIONS FOR FUTURE STUDIES ... 50
6 REFERENCES ... 51 APPENDICES ... 57 APPENDIX 1 ... 57 APPENDIX 2 ... 57 APPENDIX 3 ... 57 APPENDIX 4 ... 58 APPENDIX 5 ... 58 APPENDIX 6 ... 59 APPENDIX 7 ... 59 APPENDIX 8 ... 60 APPENDIX 9 ... 61 APPENDIX 10 ... 61
vii APPENDIX 11 ... 61 APPENDIX 12 ... 62 APPENDIX 13 ... 62 APPENDIX 14 ... 63 APPENDIX 15 ... 63 APPENDIX 16 ... 63 APPENDIX 17 ... 64 APPENDIX 18 ... 65 APPENDIX 19 ... 65 APPENDIX 20 ... 65 APPENDIX 21 ... 66 APPENDIX 22 ... 66 APPENDIX 23 ... 66 APPENDIX 24 ... 67 APPENDIX 25 ... 67 APPENDIX 26 ... 68 APPENDIX 27 ... 69 APPENDIX 28 ... 69 APPENDIX 29 ... 69 APPENDIX 30 ... 70
1
1 Introduction
In the introductory chapter is a background given to the thesis. It provides information about the stock market and why it has become such a popular topic in recent years, the importance of correct valuation is highlighted. A problem discussion and the purpose of the thesis are also included. An outline of the thesis and its limitations finishes the Introduction part.
1.1
Background Information
The activity on the stock markets around the world has increased during the last decades, correspondingly, so has the stock markets influence on and importance to our society. Nowadays, many corporations and institutions are heavily dependent on the stock market movements. According to statistics provided by the World Bank (2011), the number of listed domestic companies in Sweden has more than doubled during the two last decades, as illustrated in Figure 1.1.
Figure 1.1 Listed domestic companies in Sweden
(World Bank, 2011)
However, it is not only corporations and institutions that invest in the stock markets, as of June 2010, 16,9 per cent of the Swedish population owned shares, with an average portfolio value of SEK 292 000 (SCB, 2010); the corresponding Swedish households’ wealth in shares was worth SEK 506 billion1 (SCB, 2010). Figure 1.2 illustrates shareholder
statistics, with ownership by sector.
1 Share of wealth of households does not include investments in funds or insurance savings.
0 50 100 150 200 250 300 350 400
Listed domes2c companies in Sweden
Listed domes5c companies in Sweden
2
Figure 1.2 Shareholder statistics, June 2010 [Ownership by sector (SCB, 2010)]
In order for the stock market to function properly, there has to exist a confidence amongst the investors in techniques for valuing a publicly traded stock. It is crucial to know the true value of a stock before deciding whether to sell it or buy it. Often there are uncertainties related to the valuation process, not only from the specific asset being valued, but also related to the valuation model in particular. With too much uncertainty, actors in the stock market would not be able to arrive at conclusions on what price to buy or sell an asset and bad decisions, leading to bad investments, would be made.
A postulate of healthy investing is that an investor does not pay more for an asset than it is worth, which has to be backed up by reality, i.e. the price paid for any asset should be reflected by the future cash flow it is expected to create. (Damodaran, 2002)
In order to manage a portfolio, consisting of investments that are held long term, the valuation process is fundamental were firm-specific analyses are made. Scott Hoover, the author of Stock Valuation – An Essential Guide to Wall Street’s Most Popular Valuation Models (2006), claims that individuals most often are better off investing in an index fund rather than trying to pick stocks themselves. One way for a passive investor, such as regular people investing in stocks for the long run, pension funds or bonds, is to rely on professional stock (fundamental) analysts. A fundamental stock analysis most often concerns its financial characteristics, such as growth forecasts, risk profiles, and cash flows. Financial analysts play a crucial role in today’s society, either as investment bankers whose goal is to match companies with investors or as equity researchers making assessments of the true value of companies allowing them to make recommendations both to public and private investors. (Hoover, 2006)
Some analysts’ use discounted cash flow models in the valuation process, while others use different financial multiples (e.g. P/E ratio) in order to find out if a stock is under- or overvalued. (Damodaran, 2002)
When looking at different analysts’ results of specific firm valuations, the value often differs. If looking at the target price recommendations for Swedbank AB made by four
3
different investment banks/equity research firms, it is clearly demonstrated how different they can be.
As shown in the table below, the differences in the target prices are resulting in a substantial difference in the market value of Swedbank.
Table 1.1 Price target of Swedbank in accordance with four analytical firms
Investment
Bank Target price (SEK) Date Capitalization Market
Deutsche Bank 126 9Feb2011 119,992,753,314 Goldman, Sachs &
Co 108 9Feb2011 102,850,931,412
UBS 112 9Feb2011 106,660,225,168
Nomura Equity 130 9Feb2011 123,802,047,070
www.di.se - Stockwatch, retrieved 2011-02-16
How come that the firm value ends up being so different from each other? One can assume that these analysts were influenced by the same kind of information, publicly available that is. The different target price could however derive from the analysts’ different perceptions of the future, resulting in different forecasts hence the different target prices. It could also be the case that the firms have used different models with different inputs, leading to dissimilar target prices.
How can one know which of these values that is the most accurate? Which one is reliable enough to make me invest in the Swedbank stock? Basically, it is not possible to tell that and this is one of the difficulties involved in the process of firm valuation since assumptions often had to be made.
Brett Arends, a journalist on The Wall Street Journal, recently published an article about this particular “trust-issue”. He looked at the 10 stocks that Wall Street analysts rated most highly a year ago to see how it actually turned out. He found that the 10 highest rated stocks had a 24 per cent return, which is good. However, the 10 least preferred stocks by the same analysts had a 32 per cent return, which is better. After his findings, Arends decided to look back one year before that, on 2009. His results from 2009 were even more interesting, the 10 most preferred stocks had a 22 per cent return, while the 10 least preferred had an incredible 70 per cent return.
As proven by Arends, the analysts have to find a way to improve their forecasts in order to win the publics trust yet again. Perhaps the problem lies within their different valuation methods, using different inputs results in different prices.
1.2
Problem discussion
As introduced in the background, there are several ways to value a firm. It exists numerous ways of coping with the process of obtaining a firm value, different models and methods including a wide range of inputs. The result of this is that depending on whom and which method he or she uses, the resulting firm value will vary. To investigate all different approaches to the firm valuation process would demand extremely large quantities of information, which would be both difficult and time consuming to analyse, leading to results harder to interpret.
4
The underlying idea behind this thesis is that the payoff achieved from evaluate every firm with each and every available model would not be worth the extra time and effort needed for finding and evaluating all necessary information, why this thesis will use two of the major models, the Dividend Discount Model and the Free Cash Flow to Equity Model, hence only focusing on financial information that are used as inputs in the models. Both these models are built on information that often is easily accessible from for instance annual and sustainability reports.
The Free Cash Flow to Equity (FCFE) model is the most used fundamental method in firm valuation (Perrakis, 1999). This method is designed to incorporate different types of information we hold about a company, like its future prospects. The basic of the FCFE method is that you forecast internal cash flows and then discount them in order to determine the value of the company today. (Hoover, 2006)
Consequently, one of the problems discussed in this thesis is: What are the different forms of the FCFE model and what are their weaknesses and limitations?
The FCFE method is an internal, absolute valuation model. Its goal is to establish what the stock is worth rather than whether it is better or worse than other stocks. It examines the operational activities and cash flows of the company rather than simply examine the cash flows that are paid directly from the company to investors (Hoover, 2006). It is designed to facilitate a decision-making situation, its purpose is to help decision makers reach optimal decisions.
The Dividend Discount Model (DDM) deals with the firm value, or the stock value equivalently, a little bit different compared to the FCFE methods. The basic idea of the model is that the stock value of a company is the present value of future external cash flows, discounted at a rate in line with the riskiness of the expected cash flows discounted. The inputs used in the DDM, the basic inputs, are expected dividends and the cost of equity. Since the cost of equity, or the required rate of return, on the stock is calculated by using for example the capital asset pricing model (CAPM) the assumptions built into the model is on the expected dividends (numerator in the equation) which is obtained by making several assumptions about future pay-out ratios and expected growth rates in earnings. (Damodaran, 2002)
Although the goals of both models are alike, their inputs and course of action differs. This creates the basis for the next problem: How to decide which model to use?
A study will be made on ten companies listed on the Nasdaq OMX Stockholm. The companies are picked based on their different financial attributes; the selection will lead to variations when it comes to size, establishment, age and industry. A series of calculations will be made on each company for a certain period of time in order to establish a current market value (stock price) of their shares. The aim of the case study is to compare the stock prices that the two models result in. The results will then be analysed in order to see if there are any patterns present, there might be companies that are more suitable for the DDM (or vice versa). The findings will further be compared to the shares actual market price and to what analysts’ believe their target prices to be.
If an improved understanding of the models is made and if one could learn when to use which one of them, the models would perhaps be more accurate and user-friendly, and furthermore, it would be an applicable way for people to analyse companies and their stock-prices, perhaps leading to better and more profitable investments.
5
Answers to these questions, at least an attempt to answer them, will be accomplished by conducting, (1) a literature study of related academic theories and previous studies on the DDM and the FCFE method, and (2) a case study where the suitable theoretical findings will be applied on a group of case companies.
1 How will the results differ when calculating stock prices for firms when using DDM compared to FCFE and what does the possible differences tell us?
2 Is there a specific payout ratio where the DDM works better than FCFE?
3 Does the result vary with different models for different firm sizes and their properties? 4 Which results are closest to actual the market values?
1.3
Purpose
The purpose of this thesis is to investigate the applicability of the Free Cash Flow to Equity Model and the Dividend Discount Model on ten large cap firms on the Stockholm Stock Exchange. Moreover the author intends to examine whether these valuation methods differs in regards of the companies’ operational segment, business cycle and turnover. The target prices will hereafter be benchmarked with actual closing prices and professional analysts to observe similarities and deviations.
1.4
Delimitations
A delimitation with this thesis is that the study will not make use of the three-stage models for the examination, which can be used for both the Free Cash Flow to Equity Model and the Dividend Discount Model.
1.5
Outline of the thesis
The first chapter of the thesis has presented a brief introduction to the importance of correct share valuations, and how small differences in share prices can result in major differences in a firm’s total value. The chapter ends with a problem presentation as well as an idea of the purpose of the thesis.
The second chapter, Methodology, gives the reader an idea behind the choice of research method, data collection and literature search. The chapter ends with an explanation of the case study that will form the basis of the empirical findings. The purpose of Chapter 2 is to give the thesis reliability and validity.
The third chapter is the Theoretical framework, which explains the models and concepts associated with the valuation process. This chapter is based on a literature study.
The forth chapter presents a combination of empirical results and an analysis of them, this chapter is based on theories and concepts explained in Chapter 3.
The fifth and last chapter of this thesis consists of conclusions drawn from the analysis in accordance with the problem discussion and purpose of the thesis.
6
2 Methodology
This chapter includes statements that will give the reader an insight to how the research area was approached, why it was conducted in this way, how the work progressed, and finally, the author’s own critical opinions of the study. The goal with this is to give the reader a chance to acquire a personal perception concerning the dependability of the study. The reader should also be able to decide whether, in his or her opinion, the study has been conducted properly. This chapter ends with information regarding the literature that have been used and an introduction to the case study.
2.1
Method Approaches
The approach to the research problem is a fundamental process of the study, before the study begins it is therefore important to consider the direction of thought. This section of the thesis includes a brief description of the inductive and deductive approach, qualitative and quantitative approach, which, ultimately, ends up with a description of how the approach of this thesis was developed. Easterby-Smith et al. (2008) argue that if you possess enough knowledge about the different research approaches it enables you to adapt the design of your research in order to be able to confront constraints, such as limited access to data or lack of prior knowledge of the subject. (Saunders et al, 2009)
2.1.1 Inductive vs. Deductive
When writing a thesis or any other research papers there are essentially two approaches to regard, either the deductive approach or the inductive approach. The deductive reasoning, or the “hypothetico-deductive method” as it is sometimes referred to, is a “theory comes first” approach. Hypotheses and/or theoretical propositions are generated before the actual research process takes place. They are then adapted and modified by the empirical research. This is often characterized as moving from the general to the particular (Mason, 2002). Holme & Solvang (1997) describes the process as a coherent system of claims, which derives new hypotheses. These deduced hypotheses can then examine means of empirical investigation. The empirical studies can then either strengthen or weaken the belief of the theory. The deductive approach can be seen as a rigorous test, often ending up with cyclical verification techniques (Saunders et al, 2009).
The inductive reasoning on the other hand is more of a “theory comes last” view, in a process which can be seen as moving from the particular to the general, where the researcher develops theoretical propositions or explanations based on a set of collected data. This approach is most commonly associated with “grounded theorizing” (Glaser & Strauss, 1967), where theory is reflected by the data analysis, using what Glaser & Strauss call the “constant comparative method” (Mason, 2002). The inductive approach is more suitable for small samples, as compared to the deductive approach that better copes with larger samples. As opposed to deductive reasoning, this is a theory building process and it is more suitable for qualitative data than it is for quantitative data (Saunders et al, 2009). It is in an analytical way possible to distinguish between these two approaches, just as described in the previous parts, however, it is in the contradiction or combination of the approaches that new and exciting information and knowledge develops (Holme & Solvang, 1997). It is often the case that a combination of deduction and induction within the same research project is advantageous (Saunders et al, 2009). This combination is often referred to as the abductive research method. Whilst induction relates to empiricism and deduction to theory, the abductive method relates to empirical data but does not fully reject the theoretical pre-positions. The abductive research process is thus an alternation between
7
theory and empiricism, which are constantly reinterpreted in the light of each other (Alvesson & Sköldberg, 2008).
According to the aim and purpose of this thesis, the research approach of it has features of both the deductive and inductive approach. At the same time as the previous knowledge possessed by the author and the theoretical framework has been accommodating, the actual salvage and analytical part of the data has itself helped facilitate a more hands-on comprehension of the theories. The DDM and FCFE models and their different forms and components has been used to examine the batch of companies in the case study in order to find whether there are any characteristics of the companies that drive the way one should apply the valuation model(s) and to establish, in some sense, an idea of how the financial analysts go about when valuing shares. Since both models include many different steps and theories, it could very well be the case that not all of them are relevant, at least not in every case and company. That awareness was obtained while assessing existing theories and applying them to the different scenarios. With that in mind, the abductive research approach where most appropriate and therefore adopted in this thesis.
2.1.2 Quantitative vs. Qualitative
When writing a thesis or conducting other studies it is most likely linked to numerical data or data of other any form that, if quantified, will help the author to answer the research question and the purpose of the work. Quantitative data therefore refers to all such data; it can be anything from simple calculations such as the occurrence of an event to more multifaceted data such as test scores, dividend yield or return on equity. However, this kind of data, in its raw form, unanalysed and unprocessed, does not reveal that much to most people. Hence, it is crucial to analyse and process your quantitative data using different quantitative analysis techniques. It exists many different such techniques, one could for example create diagrams and tables or using statistics in order to demonstrate relationships between the variables. (Saunders et al, 2009)
The qualitative data is on the other hand non-numerical data or data that have not been enumerated. Such data could be for example responses from open-ended questions2 to
more complex such as transcripts of in-depth interviews. In order for you to draw any conclusions or build theories from your qualitative data it has to be analysed. In some sense, qualitative analysis is constantly pending between data collection and analysis (Svenning, 2003). The qualitative analysis methods, including both deductive and inductive approaches, vary from simple categorisation of interview-responses to the process of identifying relationships between categories. (Saunders et al, 2009)
The following table further distinguishes the differences between qualitative and quantitative data.
Table 2.1 – Qualitative vs. Quantitative Data
Qualitative Data Quantitative Data
Based on meanings expressed through
words Based on meanings derived from numbers
Collection of results in non-standardised data requiring classification into categories
Collection of results in numerical and standardised data
8 Analysis which is conducted through the use
of conceptualisation Analysis conducted through the use of diagrams and statistics
Source: Dey (1993); Healey and Rawlinson (1994), cited in Saunders et al (2009)
There is however nothing that states that a research project cannot make use of both quantitative and qualitative techniques. The choice to use them both is gradually encouraged within business and management research. The general term for this is mixed methods approach and that is the approach of which this thesis is adopting (Saunders et al, 2009). First, the literature study will be performed in order to find possible weaknesses and limitations of the valuation models and to examine different possible forms of the models.
2.2 The Case Study
The study that is conducted in this thesis is performed in order for the author to illustrate the different values that derive from the choice of which valuation model to use, and it takes the form of a quantitative case study. The study will consist of 10 companies currently listed on the Nasdaq OMX Stockholm, who are valued in accordance with what professionals and prior author’s recommend. The companies are picked based on their financial attributes, with size, business cycle and turnover as the main attributes. The idea is that the results of the study will highlight the importance of the valuation model-selection one has to consider before analysing a company and its stock. It is important to highlight that the firm-values that will be derived from the case study should not be perceived as recommendations or target prices for the 10 companies.
2.3 Collection of the Data
All primary data that has been collected throughout the process of this thesis comes either directly from reports published by the case companies or from databases specialized on financial information. In some cases the collected data have been in need of adjustments in order for it to match with the inputs of the model. It is on this aspect that I have found it to be an advantage of writing this thesis on my own, since I have been able to keep a consistent way of modifying in order for it to properly fit the valuation models.
2.4 Limitations
The main constraint when writing a thesis is the limited amount of time you are given, why some necessary limitations are vital for the quality of the thesis to maintain high throughout the whole process. In the case of this thesis, only two models are used for the valuations, this means that the literature study that provides the basis of the Theoretical Framework is limited. The companies selected for the study are all Swedish companies, listed as Large Cap on Nasdaq OMX Stockholm. The reason for only picking Large Cap companies is that the valuation models used are dependent on substantial dividends payouts, and since not all Small Cap companies even pay dividends they are excluded from this thesis. Another important delimitation is that the assumptions made on the future growth rates are mainly based on my own calculations, and only to some extent based on information provided by the companies themselves. Further timesaving delimitations made are that only ten companies will be analysed and in the case of shares with different voting rights, the shares valued are basically the most traded ones. When it comes to the risk-free rate and market risk premium that are incorporated in the Capital Asset Pricing Model used to calculate the cost of equity for the companies they are both assumed to be the same for each and every company, meaning that no adjustments are made due to the companies different features.
9
3 Theoretical framework
In this section of the thesis incentives for valuation are presented as well as basic concepts and theories associated with a company’s value. The section also includes a thorough explanation of the valuation models and their various forms used in the thesis. The theoretical framework ends with a short financial presentation of the case companies are given in combination with an assumption strategy for the Empirical Findings & Analysis section.
3.1
Outline of the Theoretical Framework
This section begins with a discussion and definitions on related concepts that will be needed in order to implement the analysis. The following part will cover different financial models applicable to firm valuation. It narrows down the perspective by focusing on the DDM and FCFE methods in particular. This step will explain the basics of both the DDM and the FCFE model and highlight some of their inadequacies when it comes to firm valuation.
The intention of this first theoretical part of the literature study is to give the reader an insight into the process of valuation, highlighting important concepts and definitions from a broad perspective. It then narrows down to the valuation models and their forecasting implications.
Next part of the theoretical frameworks will discuss some relevant, and in the firm valuation aspect relatively undeveloped related academic theories around firm valuation. These theories are relevant since they are part of the discussions mentioned in the previous steps, and it could be useful to analyse them in order to examine different approaches and perhaps improvements to the process of firm valuation. This part will furthermore cover some non-financial aspect of the valuation process, which in most cases are just as important in the decision-making.
In the next step a more comprehensive explanation is given to the valuation process when applying the valuation models. The models and their various versions explained in this part are the ones that are going to be applied on the case study as the thesis progresses. The formulas for the two valuation models are general versions, why the reference has been left out.
The final part of the theoretical framework will consist of an analysis based on the theories discussed and developed in the previous steps. This analysis will be the founding source for the final conclusions.
3.2 Motives for Valuation
A basic belief is that managers who put emphasis on creating value for shareholders will generate healthier companies than managers who do not. Healthier companies leads to healthier economies, more business and career opportunities or individuals, this leading to higher living standards (Copeland, et. al, 2000).
The Swedish professor, Sven-Eric Johansson, who was a supporter of the development of a theoretical foundation for how businesses should be valued had the opinion that one should treat every acquisition as an investment (Hult, 1998). A more theoretical definition of a company’s value based on this investment theory is the present value of future distributable earnings from the company. The future cash flows provide the limits of the company’s survival and future development. These cash flows, or dividends, are the
10
foundation for share value of the company. On the basis of this is the intention of an external stakeholder, such as a shareholder (or a prospective one), to form an opinion about the company’s ability to generate cash flow (Hult, 1998).
This cash flow can take the form of income, dividends paid by the company, or capital, which is realized by a sale of the shares (Barker, 2001).
3.2.1 Who Values Stocks?
As mentioned in the previous part, there are several categories of people with an interest of value stocks. Since these people are different they also have different reasons for undertaking stock valuations. Some of the motives can be the desire to form effective economic policies in order to better understand and manage companies, the potential to profit from trading with stocks, and the need to communicate correct yet simplified information to the public (Hoover, 2005). The following part will further explain why financial analysts, corporate managers, asset managers, economic policymakers or regular individuals would have an interest in the stock valuation process.
3.2.1.1 Financial Analysts
There are two kinds of financial analysts, investment bankers and equity researcher. As this section explains, whilst their techniques are somewhat similar their intentions with the valuation differs. The investment banker’s main role is to pair companies with potential investors; their goal is to help companies find ways to raise money for different projects. In this process, the investment banker does not only have to evaluate the company’s shares, but also try to convince the company that their valuation is justified. In other words, the investment banker’s goal is not to find a “true” stock value, but at what price the investment bank can sell the stock in order to raise the money needed. The equity researchers on the other hand have to follow and assess companies in order to find a true stock price of those companies. These assessments and the stock values are then used to make recommendations to both public and private investors. The recommendations can publicly take the form of buy/sell recommendations, or downgrades and upgrades of the stocks. (Hoover, 2005)
3.2.1.2 Corporate Managers
Managers both have an interest in valuing their own company and other, perhaps possible mergers or acquisitions, companies. To know the value of their own stock can be helpful for managers in order to properly raise money. If they, for instance, believe that their stock is currently overvalued in the market they can make money on selling some of their shares, if they on the other hand believe that their stock is currently undervalued in the market they normally would not want to issue more shares. The same reasons holds for knowing the value of other company’s stocks, if a manager thinks that a company’s stock presently is undervalued in the market, and plans on acquiring that company exists, now could be a good time to go through with the acquisition. (Hoover, 2005)
3.2.1.3 Asset Managers
An asset manager is someone who is hired by companies or individuals with the objective to invest their money. They invest this money in their own constructed portfolios, whose main goal is to outperform benchmark portfolios (typically the “market”) in the long run. It is evident that an asset manager who lacks the ability to find stocks that are misaligned in the market, for his portfolio, will in the long run not be able to outperform the market, thus lose current and potential customers. (Hoover, 2005)
11
3.2.1.4 Economic Policymakers
The objectives of policymakers in different economic institutions over the world are somewhat different to the ones previously mentioned. Their focus is usually not on specific companies and their stocks, but at the value of the whole stock market compared to its “true” value. By knowing if the stock market as a whole is currently over- or undervalued allows them to, for example, in a more accurate way evaluate the stability of the financial market, which forms a foundation in their interest rate policies. They could for example increase interest rates to slow down the market or contrary decrease interest rates to generate economic growth. (Hoover, 2005)
3.2.1.5 Individuals
In recent years, is has become more and more popular amongst individuals to invest in the stock market. In order for them to do so, an understanding of how the valuation process can be conducted is therefore crucial. Since this process can be, especially for non-professionals, both challenging and time-consuming, individuals are typically better off investing in an index fund, rather than trying to choose stocks themselves. (Hoover, 2005)
3.3 Related Concepts
The goal of this part of the theoretical framework is to give the reader an idea of some related concepts to the valuation process one have to be aware of. This part is however not only associated with valuation, it serves as a basics for how the capital structure of a firm can be designed as well as the different forms of market efficiency.
3.3.1 The Concept of Value
As mentioned in the previous part, value can take the form as either dividends or by acquiring capital through share transactions. The value that stakeholders obtain is determined by future returns that the company is expected to get, as well as the risk that the returns deviates from those expected. Hence, it is not unusual that different parties have different perceptions of value. This difference often originates from different assessments regarding the plausibility of the forecast development in relation to what has historically been achieved by the company (Öhrlings PricewaterhouseCoopers, 2007). 3.3.2 Due Diligence
The authors, William M. Crilly and Andrew J. Sherman, of “The AMA Handbook of Due Diligence” (2010) defines due diligence as a process whereby an individual, or an organization, seeks sufficient information about a business entity to reach an informed judgement as to its value for a specific purpose.
A good example of an organization with the need of proper due diligence are consultant firms that often assists, either the buyer or the seller, in the case of an acquisition. The following part of the due diligence section consist of a brief explanation of the global consulting firm PriceWaterCoopers’s take on the due diligence process.
This process often affects the buyer’s view of the company and gives him or her a sense of what demands to give the seller in their negotiations. An analysis of this kind is often categorised in to the following areas:
• Commercial Analysis • Operational Analysis
12 • Financial Analysis • Tax Issues • Legal Issues • Environmental Issues (Öhrlings PricewaterhouseCoopers, 2007)
This thesis is mainly focusing on the financial part of an acquisition (whether it is an entire company or a fraction of its shares), thus is the Financial Analysis the area of focus. The Financial Analysis normally includes an in-depth review of the company’s continuous level of profitability and cash flows (both historic and forecasts), an overview of customer and supplier dependency and an overview of the balance sheet (in order to identify any possible surplus or deficit). (Öhrlings PricewaterhouseCoopers, 2007)
In light of the fact that buyers are increasing the use of due diligence, the need for the sellers to prepare both themselves and their company for a pre-acquisition analysis has increased. This is a so called “sell-side due diligence”, through which the seller gains increased knowledge of the object up for acquisition and thereby get an advantage in the coming negotiations. (Öhrlings PricewaterhouseCoopers, 2007)
3.3.3 Capital Market Efficiency
If prices in a specific market, for example the Swedish stock market, are adjusting rapidly and correctly in accordance with new information available the market is said to be efficient. Hence, in an efficient capital market, such as the stock market, there is no reason to believe that the current stock prices are too high or too low, provided that all information is available. (Ross et al, 2008)
The next following part of this section of the thesis will provide a simple explanation to the different forms of market efficiency, forms that differ when it comes to what information is reflected in the stock prices.
3.3.3.1 Strong Form Efficiency
In the case of a strong form of market efficiency, all information, both public and private, is reflected in the stock prices. In recent years, the topic of inside information has been widely discussed. In this form of efficiency there is no such thing, as inside information, everyone knows everything that there is to know about the stock or company. Common sense tells us that this cannot always be the case; there are several situations when people do in fact hold private information or knowledge to themselves. This means that it may exist private (inside) information about a stock that is not currently reflected in its price. (Ross et al, 2008)
3.3.3.2 Semi-Strong Form Efficiency
The semi-strong efficiency differs from the strong form since only publicly available information is believed to reflect current stock prices. This form of efficiency suggest that there is no idea trying to analyse the price of a stock, or looking for mispriced stocks, since all public information already reflects the stock price. (Ross et al, 2008)
3.3.3.3 Weak Form Efficiency
The last of the three forms is the weak form efficiency, in which the stock prices are only reflected by historical prices of that stock. This means that if the market is weak form
13
efficient there is no gain in looking for mispriced stocks by studying past stock prices. (Ross et al, 2008)
3.3.4 Capital structure and firm value
Fundamental to the discussion on company valuation, the Miller-Modigliani theorem, which states that the value of a firm is independent of its capital structure, is essential to discuss when writing a thesis on firm valuation. That is, the level of debt, the split of debt into claims with different levels of collateral and different seniorities in the case of bankruptcy, dividend distribution policies, and many other characteristics or policies relative to the financial “pie” have no impact on the total firm value. This means that if a firm decides to do, an increase in total debt or a dividend distribution dilutes the debt-holder’s claim and benefits the shareholders, but the latter’s gain exactly offset the former’s loss. (Tirole, 2006)
In mathematical terms, where !! = operating assets, !!"# = tax shields, D = debt and E =
equity, the correlation between the value of firm and its capital structure can be displayed in an equation as follows,
!! + !!"# = !"#!"#"$%! !"#$% = ! + ! (Koller et al, 2010)
3.4 Financial Models & Valuation
It exists many different models on valuation and with them a lot of assumptions one have to make before putting them to use. This section will cover information about two specific models, the dividend discount model and the free cash flow to equity model, and their different areas of use. Important aspects concerning the models (growth rates, payout ratios, cost of equity etc.) are further discussed in order for the reader to get an idea of the reasoning behind the forthcoming firm valuations.
3.4.1 Dividend Discount Model
The Dividend Discount Model (DDM) is the simplest tool for valuing equity. Whilst some analysts view the DDM as out-dated and inadequate there are still a lot of companies where the DDM still is viewed as a convenient instrument for estimating value (Damodaran, 2002). The dividend discount model estimates the equity value based on the idea that the value of the equity equals all future dividends discounted back to today, using an appropriate cost of capital as discount rate. The cost of capital used in each calculation is reflecting the integrated risk in that particular cash flow (Frykman & Tolleryd, 2003). Author Roberg G. Hagstrom describes, in his book “The Warren Buffett way” (2005), how one of the world’s greatest investors believes that the dividend discount model (created over sixty years ago by John Burr Williams) is the best system for determining the intrinsic value of a company.
3.4.1.1 The General Model
When an individual buys stock, there are two types of cash flows that he or she can expect to receive – namely the dividend that the stock will pay during the time it is owned and the expected price at which the stock can be sold. The general equation for stock value can be expressed as:
14 !"#$% !"# !ℎ!"# = !! = !(!"#!) (1 + !!)! !!! !!!
where !"#! = Expected dividends per share
!! = Cost of equity
In order to obtain the numerator, expected dividends per share, assumptions regarding future payout ratios and growth rates have to be made. The denominator, the cost of equity or required rate of return, is determined by its riskiness and is measured differently in different models (the market beta in capital asset pricing model (CAPM) and the factor betas in the arbitrage and multifactor models).
Since the model just presented cannot be applied on “real” dividend projections, due to the assumption of an infinite timeline, numerous varieties of the dividend discount model have been established which are constructed around different assumptions about future growth. (Damodaran, 2002)
3.4.1.2 Gordon Growth Model
The Gordon Growth Model is used mainly to value firms that are in stable growth with dividends growing at a rate that can be maintained for all eternity.
!! = !"#! !!− ! where !"#! = Expected dividends next year
!! = Cost of equity
! = Growth rate in dividends forever
Since the model assumes that the firm’s growth rate in dividends is expected to last forever, the term stable growth is widely discussed and questioned. One of the aspects of the Gordon growth model and its “stable growth” is that other performance measures, such as earnings, also can be projected to have the same annual growth rate as dividends. Hence, if a company’s earnings are growing faster than its dividend payout in the long run, the company’s payout ratio will slowly approach zero, and that is not a feature of a company in a steady state of growth. Furthermore, a firm in a “steady state” cannot have a growth rate that exceeds the growth rate of the economy in which the firm operates. (Damodaran, 2002)
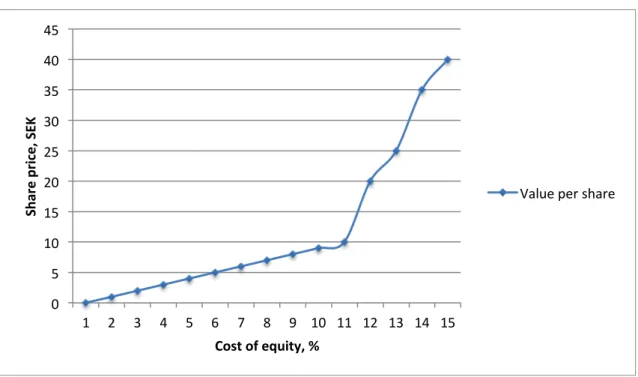
It is clear that the growth rate plays a crucial role in the model, and if used wrong, the resulting value will be incorrect or misleading. Given the equation, one can see that if a firm’s growth rate goes towards the cost of equity the value per share will approach infinity, and if the growth rate in fact surpasses the cost of equity the resulting value per share instantly turns negative. The phenomenon is further displayed in the figure below.
15
Figure 3.1 – Growth rate approaching the cost of equity
This means that if an analyst is about to use the Gordon growth model, the firm on which he calculates, has to grow at a rate equal or lower than the growth rate of the economy in which it operates. Another characteristic of a firm suitable for this model is that their dividends payout is in line with what they can afford; otherwise the model will surely undervalue its stock. (Damodaran, 2002)
3.4.1.3 Two-stage Dividend Discount Model
In many cases, companies are witnessing two stages of growth, to begin with, the company may have a growth rate that is not stable (for example a young company on the run, or a company that expands to a new market), followed by a state where the growth rate stables out and is expected to stay their for the long run. (Damodaran, 2002)
!! = !"#! (1 + !!,!!)!+ !! (1 + !!,!!)!, !ℎ!"! !! = !"#!!! (!!,!"− !!) !!! !!!
where !"#! = Expected dividends per share in year !
!! = Cost of equity (ℎ!: High growth, !": Stable growth period) !! = Price (terminal value) at the end of year !
! = Extraordinary growth rate for the first ! years !! = Steady state growth rate forever after year !
If the growth rate ! and the firm’s payout ratio remains the same for the first periods of ! years, the formula above can be modified into a more adoptable way.
!! = !"#!∗ 1 + ! ∗ [1 −(1 + !1 + !! !,!!)!] !!,!!− ! + !"#!!! (!!,!"− !!)(1 + !!,!!)! 0 5 10 15 20 25 30 35 40 45 1 2 3 4 5 6 7 8 9 10 11 12 13 14 15 Shar e pr ic e, SEK
Cost of equity, %
16
The terminal growth rate, !!, has to have the same characteristics as the growth rate used
in the Gordon growth model and cannot exceed the growth rate in the economy where the firm operates. Furthermore, the estimated growth rate and the payout ratio have to be consistent with each other. This means that if the expectation is that the growth rate will drop considerably after the first period of growth, and then the payout ratio must be higher in the later, stable growth period, than it is in the initial growth phase. The idea behind this is that a firm that are currently in a stable growth phase is able to pay out more of their earnings as dividends compared to a firm that is growing. (Damodaran, 2002)
According to Damodaran (2002) some guidelines concerning a firm’s beta-value and its return on equity exists. He states that a firm in high growth can be assumed to have a beta of 2.0, when entering stable growth – a firm’s beta-value should be somewhere between 0,8 and 1,2. The same assumptions holds for the return on equity, which can be high during the high growth phase, and then decrease as the firm, enter its stable growth phase.
Although a two-stage dividend discount model is applicable on many firms, the model do has some important limitations that have to be considered. The first problem is to define the length of the initial high growth period. This is an important aspect to consider since the value of an investment will increase, as this initial period is made longer. The second problem is connected with the transition period (when the firm goes from high growth to stable growth), where the two-stage dividend discount model assumes this to happen over night when in fact this process may happen gradually in real life. The last limitation with the model concerns the dividend payout policy of the firm being valued. A firm that does not pay out as much dividends as they could afford (they might chose to reinvest), tends to be undervalued when valued with the two-stage dividend discount model.
A firm most suitable for the two-stage dividends discount model is a firm that are in high growth for a specific time period, and then is expected to assume a stable growth forever. As mentioned, the payout policy is important, to get as a fair value of a firm as possible, it should maintain a policy of paying out its cash (after paying debts and doing the necessary reinvestments) as dividends. (Damodaran, 2002)
Damodaran (2002) is further providing a troubleshooting guide that could be useful if the value per share his extremely high or low:
• If you get a extremely low value:
- The stable period payout ratio is too low for a stable firm (<0.40) - The beta in the stable period is too high for a stable firm
- The two-stage model is being used when the three-stage model is more appropriate
• If you get an extremely high value:
- The growth rate in the stable period is too high for a stable firm (Damodaran, 2002)
3.4.1.4 Three-stage Dividend Discount Model
The three-stage dividend discount model tackles one of the limitations of the two-stage dividend discount model since it includes not only an initial phase of high growth and an infinite lower stable growth, but in between them it includes third a phase where the growth rate declines, a transitional period. (Damodaran, 2002)
17 !! = !"#!∗ (1 + !!)!∗ ! ! (1 + !!,!!)! !!!! !!! + (1 + !!"#! !,!)! !!!! !!!!!! +!"#(! !!∗ 1 + !! ∗ !! !,!"− !!)(1 + !)!
where !"#!= Earnings per share in year !
!"#!= Dividends per share in year !
!! = Growth rate in high growth phase (lasts !2 periods)
!! = Growth rate in stable phase
!! = Payout ratio in high growth phase
!! = Payout ratio stable growth phase
!! = Cost of equity in high growth (ℎ!), transition ! and stable growth (!")
Since this formula consists of more inputs than the other two dividend discount models, possible noise connected with the estimation process may affect the ending value wrongly even though the model is more flexible than others. The mentioned flexibility that the model has makes it suitable for firms that have very high growth rates3 in their earnings,
which are expected to grow at those rates for an early period, but are later expected to drop progressively towards a stable rate. (Damodaran, 2002)
3.4.2 Free Cash Flow to Equity
Compared to the dividend discount models, which assumes dividends to be the only cash flow received by and available to stockholders, the free cash flow to equity models defines the payable amount as the cash left over, after meeting all financial obligations. The cash flow available to be paid out as dividends is best explained by illustrating how the financial obligations are considered in a mathematical formula. Apart from the obvious difference (dividends vs. FCFE) there are a lot of similarities between how to conduct valuations with the two different models.
!"!# = !"# !"#$%& − !"#$%"& !"#$%&'()*$+ − !"#$"%&'(&)*
− !ℎ!"#$ !" !"!#$%ℎ !"#$%&' !"#$%"& + (!"# !"#$ !""#$% − !"#$ !"#$%&"'())
This means that instead of discounting the actual dividends paid, we discount the potential dividends in the free cash flow to equity models. The assumption is, thus, that we assume the FCFE to be paid out to the companies’ stockholders. (Damodaran, 2002)
3.4.2.1 Constant growth FCFE
The constant growth model is similar to the Gordon growth model used for discounting dividends. The applied growth rate has to be rational and cannot be greater than the growth rate of the economy in which the company is active.
!! = !"!#! !!− !!
3 As a rule of thumb, growth rates over 25 percent would qualify as very high when the stable growth rate
18 where !! = Value of stock today
!"!#! = Expected FCFE next year
!! = Cost of equity of the firm
!! = Growth rate in FCFE for the firm forever
Compared to the Gordon growth model this constant growth FCFE model is more suited for stable firms that are paying out dividends that deviates significantly from its free cash flow to equity. If a firm pays out exactly its free cash low to equity as dividends, the value obtained will be exactly the same as if we have used the Gordon growth model. (Damodaran, 2002)
If you after using the Constant Growth FCFE model believe that your value is either too high or too low, Damodaran (2002) has a troubleshooting guide for finding out what is wrong with the valuation.
• If you get a low value from this model, it may be because: - Capital expenditures are too high relative to depreciation - Working capital as a percent of revenues is too high - The beta is high for a stable firm
• If you get too high a value, it is because:
- Capital expenditures are lower than depreciation - Working capital ratio as percent of revenue is negative - The expected growth rate is too high for a stable firm
3.4.2.2 Two-stage FCFE
The same type of growth applies on the two-stage FCFE model as the two-stage DDM model, namely that the growth rate will be constantly high during an initial phase and then drop down to a stable growth rate that will go on forever. It is appropriate to use the model when valuing firms with dividends levels that are unmaintainable or below what the firm actually can afford to pay out. The value of a stock is calculated by taking the present value of the FCFE per year (for the high growth period) plus the present value of the terminal price at the end of the period. (Damodaran, 2002)
!! = !" !" !"!# + !" !" !"#$%&'( !"#$% = !"!#! (1 + !!,!!)!+ !! (1 + !!,!!)! !!! !!!
where !"!#!= Free cash flow to equity in year ! !! = Price at the end of the high growth period
!! = Cost of equity in high growth (ℎ!) and stable growth (!")
The ending, or terminal price !! is calculated by using the infinite growth rate !!.
!! = !"!#!!! (!!,!"− !!)
Damodaran (2002) is as for the previous models providing a troubleshooting guide if your deriving share price is either to be considered too low or too high:
19 • If you get a extremely low value:
- Earnings are depressed due to some reasons (economy etc.)
- Capital expenditures are significantly higher than depreciation in stable growth phase
- The beta in the stable period is too high for a stable firm - Working capital as percent of revenue is too high to sustain
- The use of the two-stage model when the three-stage model is more appropriate
• If you get a too high a value:
- Earnings are inflated above normal levels
- Capital expenditure offset or lag depreciation during high-growth period - The growth rate in the stable growth period is too high for stable firm
(Damodaran, 2002)
3.4.2.3 Three-stage FCFE
As of the three-stage DDM model, this model is most suitable for firms which are going through three stages of growth, an initial high growth period which through a transitional growth period ends up in a infinite stable growth rate. (Damodaran, 2002)
!! = !"!#! (1 + !!,!!)!+ !"!#! (1 + !!,!")!+ !!! (1 + !!,!")!! !!!! !!!!!! !!!! !!!
where !! = Value of stock today
!"!#! = FCFE in year t
!! = Cost of equity in high growth(ℎ!), transitional growth(!") and stable
growth(!")
!!!= Terminal price at the end of transitional period = !"!#(! !!!!
!!!!)
!1 = End of initial high growth period !2 = End of transition period
When using a model that assumes three different stages of growth it is important that assumptions about other financial variables are coherent with those of the growth rates. (Damodaran, 2002)
3.4.3 Related concepts and formulas connected with DDM & FCFE
As opposed to the relevant theories and concept in section 3.3 of the theoretical framework, this section will cover concepts and mathematical formulas in direct connection with the valuation models used in the thesis.
3.4.3.1 Estimating Growth
When estimating the appropriate growth rate there are several aspects to consider, based on if you use dividend discount models or free cash flow to equity models. When estimating growth for the FCFE model, focus lies on the return on equity (ROE) of the firm and at what rate the firm reinvests its net income. The formula for expected growth in FCFE is expressed as follows,

![Figure 1.2 Shareholder statistics, June 2010 [ Ownership by sector (SCB, 2010)]](https://thumb-eu.123doks.com/thumbv2/5dokorg/4611819.118836/10.892.179.751.124.491/figure-shareholder-statistics-june-ownership-sector-scb.webp)