=
EMRE URAZ
Master Thesis
Visby, Sweden 2011
Offshore Wind Turbine Transportation & Installation Analyses
Offshore Wind Turbine Transportation &
Installation Analyses
Planning Optimal Marine Operations for Offshore Wind Projects
Master Thesis
by Emre URAZ
Master Thesis written at Gotland University, June 2011, Department of Wind Energy
Supervisor: Richard Koehler HGO, Department of Wind Energy Examiner: Dr. Bahri Uzunoğlu HGO, Department of Wind Energy
i
Abstract
Transportation and installation of offshore wind turbines (Tower, Nacelle and Rotor) is a complete process conducted over several phases, usually in sequence. There are several factors that can turn this process into a challenge. These factors can either be due to offshore site conditions or the technical limitations of the installation vessels. Each project has its own characteristic parameters and requires a unique optimum solution. This paper identifies the dynamics of the installation process and analyzes the effects of each phase on the progression of events.
The challenges in wind turbine installations due to offshore environment were investigated, the effects of each were explained and their significances were stressed. Special installation vessels were examined and their technical specifications were analyzed in terms of working conditions, dimensions, service performances, and crane capacities as well as projecting future design trends. Several offshore wind farm projects were analyzed; their installation methods were specified, and compared to each other to determine advantages and disadvantages of different pre-assembly concepts. The durations of the sub-phases of the process were defined in terms of different variables such as site conditions and individual vessel performance. These definitions were used for making time estimations, and conducting further analyses regarding the effects of different site specific parameters on the overall project duration.
In conclusion, this study considered the main operation parameters in an offshore wind turbine installation context: the benefits and drawbacks of different pre-assembly methods were researched and evaluated resulting in new knowledge and a productive contribution for optimizing “the offshore turbine transportation and installation process”, based on actual time usage.
Key Words
Offshore wind farms, transportation and installations, jack-up vessels, wind turbine installation vessels, design trends in installation vessels, assembly and pre-assembly, project durations, onboard cranes, challenges due to offshore environment, time performance, crane operations
iii
Acknowledgement
I would like to thank my supervisor at Gotland University Richard Koehler for all the advices, helps and the motivational support throughout my thesis work. I appreciate all of his insightful comments and constructive feedbacks along with his great experience in the field of international project management which kept my research on the beam.
Furthermore, I thank my dear friend Ahmet Aksoy, professional in Naval Architecture and Marine Engineering, for helping me analyze the technical data of the wind turbine installation vessels.
Finally and most importantly, I would like to thank my father Uğursal Uraz, my mother Sebahat Uraz, and my dear sister Eda Uraz for their endless support and patience during all the stages of my education. None of my achievements could have been possible without them.
Emre URAZ
Visby, 2011
iv
Contents
ABSTRACT ... I ACKNOWLEDGEMENT ... III 1. INTRODUCTION ... 3 1.1. Background ... 4 1.2. Theory ... 5 1.3. Methodology ... 72. SITE SPECIFIC FACTORS ... 9
2.1. Water Depth ... 9
2.2. Sea Bed Conditions ... 11
2.3. Environmental Conditions ... 12
3. INSTALLATION VESSELS ... 14
3.1. Wind Turbine Installation Vessel (WTIV) ... 14
3.2. Onboard Cranes ... 16
3.3. Jack Up Barges (JUB) ... 21
4. OFFSHORE WIND TURBINES (OWT) ... 22
5. TRANSPORTATION AND INSTALLATION CONCEPTS ... 25
5.1. “Bunny Ear” with a Tower in Two Pieces (BE2T) ... 25
5.2. “Bunny Ear” with a Tower in One Piece (BE1T) ... 25
5.3. Pre-Assembled Rotor (R2T) ... 26
5.4. Five Pieces Separately (SP5) ... 26
5.5. Six Pieces Separately (SP6) ... 27
5.6. Methods in Comparison ... 27
6. TIME ESTIMATIONS AND REALITY CHECK ... 32
6.1. Comparing the Estimations with the Actual Values ... 33
7. FURTHER ANALYSES ... 36
7.1. Effect of the Distance on Timing ... 36
7.2. Sea Depth ... 37
7.3. Offshore Crane operations and Assembly ... 38
7.4. Comparing BE1T and SP5 ... 40
8. CLOSURE ... 42
8.1. Conclusion ... 42
8.2. Future Work ... 43
LITERATURE REFERENCES ... 44
APPENDIX A, TIME ESTIMATIONS ... 45
A1. Time Estimation Approach ... 45
A2. Model 1 ... 47
A3. Model 2 ... 47
A4. Crane Operations ... 49
Thanet Wind Farm ... 49
v
Horns Rev II ... 50
APPENDIX B, PICTURES ... 51
APPENDIX C, REFERENCES ... 53
C1. References for Vessels ... 53
C2. References for Wind Turbines... 55
C3. References for the Offshore Projects ... 55
Tables and Figures
Figure 1: Development of the offshore wind industry (EWEA Offshore Report, 2009) Source: [2] ... 9Figure 2: Lillgrund Offshore Wind Park, Farm Layout, Source: [3] ... 10
Figure 3: Water Depth (Averages) Vs. Years (for the wind farms given in the Table 1), by Author ... 11
Figure 4: Seabed Penetration (leg penetration) ... 12
Figure 5: Cargo capacity of the WTIV’s by years (for the vessels given in Table 3), by Author ... 15
Figure 6: Operational water depth of the WTIV’s by years (for the vessels given in Table 3), by Author ... 16
Figure 7: Onboard Crane of a Wind Turbine installation Vessel, ... 17
Figure 8: SWL vs. Radius, and Hook Height vs. Radius (Main crane of “MPI Resolution”) . 18 Figure 9: WTIV crane capacities by years (for the vessels in Table 4) by Author ... 19
Figure 10: Crane Positions on WTIVs from top view (Drawings are illustrative) ... 20
Figure 11: Six Main Components of a Wind Turbine, by Author ... 22
Figure 12: Tower of a Wind Turbine, by Author ... 23
Figure 13: Nacelle and Hub, by Author ... 23
Figure 14: Bunny Ear Configuration with Two Turbine Pieces, by Author ... 25
Figure 15: BE1T, Bunny Ear Configuration with One Turbine Pieces, by Author ... 26
Figure 16: R2T, Assembled Rotor, nacelle without hub and tower in two pieces, by Author 26 Figure 17: SP5, Nacelle with hub, Tower in one piece and Three Turbine Blades Separately, by Author ... 27
Figure 18: SP6, Nacelle with hub, Tower in two pieces and Three Turbine Blades Separately, by Author ... 27
Figure 19: Different Deck Load Configurations on a WTIV (Drawings are Illustrative), by Author ... 29
Figure 20: Deck Configurations vs. Area Need per Turbine, by Author ... 30
Figure 21: Total Voyage Duration vs. Amount of Turbines being carried at each voyage, by Author ... 36
Figure 22: Total Duration of the jacking operations for 100 turbines at different water depths, by Author ... 37
vi
Figure 24: Conceptual Learning Curve Horns Rev II (Source: [14])... 39
Figure 25: Total duration of the offshore crane operations vs. Performance (for a wind farm of 100 turbines), by Author. ... 39
Figure 26: Time wise comparison of SP5 and BE1T vs. increasing distances, by Author ... 41
Table 1: Selected wind farms in the Baltic Sea, North Sea and Irish Sea Region, with water depths and commissioning year, Source: [4], [5], [6] ... 10
Table 2: Operational conditions for installation vessels (See Appendix C1. References for Vessels) ... 13
Table 3: WTIVs specifications (See Appendix C1. References for Vessels ... 15
Table 4: Crane features of the WTIV’s by year. (See Appendix C1. References for Vessels) 19 Table 5: Crane capacities of the Jack-Up barges (See Appendix C1. References for Vessels) 20 Table 6: Technical Properties of Jack-Up Barges (Ref: See Appendix C1. References for Vessels) ... 21
Table 7: Characteristics for Turbine Towers [12] ... 22
Table 8: Weight of the components of the Offshore Wind Turbines (See Appendix C2. References for Wind Turbines) ... 24
Table 9: Statistics on “Deck load Configurations” over 14 existing projects (See Appendix C3. References for the Offshore Projects) Vessels written in Italic are JUBs ... 28
Table 10: Minimum SWL requirement for OWTs at Different T&I Method (tons) (See Appendix C2. References for Wind Turbines ) ... 31
Table 11: Evaluated durations of offshore crane operations for each method, assuming that each lift lasts for 3 hours. (See Appendix A4. Crane Operations) ... 31
Table 12: The offshore wind farm project picked for comparisons, (See Appendix C3. References for the Offshore Projects) ... 34
Table 13: Wind Farm Coordinates, Base Harbors, and voyage distance (harbor to site - one way) ... 34
Table 14: Vessel specifications that were used in the models ... 34
Table 15: Comparing the estimations of Model1 (See Appendix A2. Model 1) with real project durations ... 35
Table 16: Comparing the estimations of Model2 (Appendix A3. Model 2) with real project durations ... 35
Table 17: The parameters and variables for determining the durations ... 45
Table 18: Time estimations calculated by the parameters given in Table 17 ... 47
1
Abbreviations
T&I: Transportation and Installation
OWT: Offshore Wind Turbines (tower, nacelle, and rotor) SWH: Significant Wave Height
SWL: Safe Working Load MW: Megawatts
WTIV: Wind Turbine Installation Vessel JUB: Jack-Up Barge
Conversion Factors for non-SI Units [1]
Length/ Distance
1 nautical mile = 1852 meters (or 1 meter = 5.39x10⁻⁴ Nautical miles) Speed
3
1. Introduction
In line with the renewable energy targets of the countries, wind power investments have gained a big acceleration in the last decade including the offshore applications. High potential of the wind energy above the sea, less visual disturbance and larger areas that allows implementing larger projects made the offshore wind zones highly attractive. Especially the countries that have coasts to the North Sea, and Baltic Sea are highly interested in developing offshore wind parks. However comparing offshore and onshore wind farm projects, offshore wind farms are still more costly than the onshore applications. The major reasons behind it are the high costs of electrical grid connections, the high costs of foundations and the challenges in offshore installations such as weather, wind, and sea state dependency of the installation works and the limited number of purpose built installation vessels.
There are many site specific parameters that determine the type of foundation and turbines for offshore wind farms. While seabed properties, sea depth, tides, currents, and wave heights determine the type of foundation, the wind profile and the other characteristics of the wind determine the type of wind turbine to select. Offshore installations can be carried on only by special vessels that are designed for such purposes. These vessels must have jack up legs to create a stable working platform at the offshore site in order to lift heavy pieces and install them with a high level precision without being affected by the waves, wind and currents. The installation of a complete wind turbine structure is divided into two stages in general. The foundations and turbines are installed at different times. The installation of the turbine (tower + nacelle + rotor) is done afterward the complete construction of the foundation and the transition piece at the turbine locations.
Offshore wind turbine (tower + nacelle + rotor) installations are slightly different than the foundation installations. Turbine foundations do not include many components so that the transportation and installation methods cannot vary too much. Structurally a wind turbine consists of six main parts such as tower, nacelle, hub, and three blades. These components of the wind turbine can partly or completely be pre-assembled onshore (in the port) for transporting them to the offshore site. This situation creates many different alternative assembly configurations that can increase or decrease the “transportation and installation” performances. According to the site specific parameters such as distance from the port, sea depth, sea conditions and weather conditions this performance varies significantly. All the site and case specific parameters must be analyzed in detail before selecting the installation vessel and assembly method in order to reduce the time spent on installation works during when the vessel is chartered.
This study investigates the installation challenges due to offshore environment, analyzes the special installation vessels (that are emerging and/or existing), and specifies the turbine installation methods (that are being applied in the industry) in order to give an insight of the current state of applications and the trends in vessel designs. In addition to those the research considers the dynamics of the installation process that acts on the overall timing and efforts to figure out the durations of each phase of the “transportation and installation process” to be able to make estimations for various scenarios for further analyses.
4
1.1. Background
Offshore wind-farms have been installed since the beginning of 90’s. Their installation methods have been implemented in parallel with the projects. As the capacities of the wind turbines have increased, the weights, heights and the volume of the machines have increased consequently. The increase in the scale of the turbines required an adaptation of the installation vessels in terms of carrying and lifting capacities. As the offshore industry is getting more developed, farm capacities, water depths and distances from the shore are also increasing.
The increase in the water depth brings a challenge to the installation industry as most of the vessels being currently used are not specially designed for wind turbine installations, and have limitations in terms of operational water depths. The increasing hub heights and weight of the components require bigger lifting capacities and boom lengths from the onboard cranes which must be able to install the turbine parts safely at the needed height. It is known that the distance from the shore has the biggest effect on the cost of the grid connection but on the other hand the distance from the main port is always bigger than the distance to shore. The distance between the base port and the wind farm affects the sailing duration from the port to the site. Increased sailing duration brings the need of larger available deck space on the vessel to be able to carry more sets of turbines at each voyage.
Offshore crane operations determine the time spent on each turbine installation and they are highly dependent on weather conditions. The number of the offshore lifts is being reduced by assembling some of the components on the shore at the port and carrying them pre-assembled. Carrying pre-assembled components has several advantages such as decreasing the number of offshore lifts and thus decreasing the needed “weather window”1, but in fact in this context, the amount of turbines that can be carried on the deck at one time is sometimes slightly less when it is compared to the number of turbines that can be carried on the same deck when all the components are disassembled. Pre-assembly has also another disadvantage which is the need of calm sea during the transportation since the wind machines are not designed for resisting huge dynamic loads when their components are attached to each other, and it is another factor that increases the weather dependency of the travel that can affect the project flow.
All the variables defined above are the dynamics of the offshore turbine transportation/installations and they affect the efficiency and fluency of the process. Further analyses on the existing projects bring out a general understanding, so that an approach for optimizing the process can be developed.
1 Weather Window means the required amount of time with suitable weather conditions in order to complete
5
1.2. Theory
The challenges in “offshore wind turbine” (shortly OWT, without foundation and transition piece) transportation and installations (shortly T&I) are related to various specific factors. Identifying the factors that make the offshore turbine installations is a challenging process is highly necessary in order to understand the ways to improve the installation performance according to different special conditions.
The purpose of installing a wind farm is utilizing the wind energy as much as possible, so that selected offshore sites for the projects likely have high wind speeds and consequently significant wave heights which affect the T&I process negatively. The wind and sea conditions always limit and narrow the time window for a safe installation. The time window is so important and must be calculated accurately to avoid risky situations that can occur on the way and at the site.
The available shallow water (water depths < 20 meters) areas are limited hence the water depths of the potential future offshore wind sites are expected to be up to 50 meters (for non-floating turbines.) This factor limits the number of available installation vessels, and also triggers the construction of new Jack up units with leg lengths around 70 meters. The condition of the sea bed is also important and must be analyzed before the installation. The stability of the jack up unit is highly dependent on the seabed conditions.
The distance from the shore to site or from the port to site increases the travel time. This factor creates the need of higher service speeds and larger cargo capacity for the installation vessels. While larger cargo capacity reduces the number of trips, the higher service speed reduces the duration of the voyages between site and port significantly.
There are different options for installing the wind turbines offshore. Different installation vessels, different turbine models, and different T&I concepts affect the performance of the process greatly. For example, there are different installation vessels or barges and they are already being used by the offshore wind industry and their capabilities vary according to the year they were built, and the purpose they were designed for. Offshore turbine installations require lifting heavy pieces and placing them at certain heights. In order to safely install these heavy turbine components, installation boats rise on their jack up legs to create a stable working platform. These installation boats are mainly specified in two groups such as “Purpose built installation vessels”, and “Jack up barges”.
Purpose built installation vessels are self-propelled units that are specially designed according to offshore wind industry’s demands. These self-propelled installation vessels have jack up legs and cranes with high lifting capacities. Their service speeds are also slightly higher than the other installation units. These vessels are called “Wind Turbine Installation Vessels” (WTIV).
Jack-Up barges are floating units that are capable of elevating themselves above the water on their jack up legs at the construction site. They are not self-propelled units and must be towed to the construction site. The service speed of the barges is dependent on the tug’s power. They are designed for general construction and drilling purposes but still they are used in offshore wind industry commonly as well. “Jack-Up Barges” are referred to as JUBs.
The power capacity of the OWTs is increasing as the turbine technology is being developed. Today the largest offshore wind turbine is 6 megawatts (MW), and even larger machines are expected in the near future. The sizes of the wind turbines are increasing as the power
6 capacity of the turbine increases. This enlargement in the size of the machines adds other challenges to the offshore installations. While the weight creates a demand for bigger lifting capacities, the increasing hub heights require taller booms for the onboard cranes. The increased volume of the turbine components occupies more space on the installation vessel which decreases the number of turbines that can be placed on the deck at a time.
As mentioned before, offshore wind farm sites are selected especially for their good wind potentials which limit crane operations in terms of available time window for lifting the components safely. Since choosing a less windy site is not an option for solving this problem, different installation concepts were developed to reduce the duration of offshore works in order to fit it in narrow time windows. These concepts are based on carrying the components already assembled (pre-assembled) at the port.
A wind turbine (without the foundation and transition piece) consists of 6 main parts that are tower, nacelle, hub and three blades. Considering that the towers are usually carried in two pieces, the number of components becomes seven which in return increase the number of onshore assembly alternatives again. However there are five methods mainly being applied in the offshore turbine installation industry.
These methods can be summarized as follows;
Nacelle, hub and two of the blades are assembled at the port and forms a shape like a bunny’s head hence it is called “bunny ear” in the offshore industry. The tower is carried in two pieces and the third blade is also placed separately on the same boat. Therefore one turbine is transported in four pieces to the site and requires four offshore lifts at the construction site.
Nacelle, hub and two of the blades are assembled at the port shaping the “bunny ear”. Tower is also assembled to be carried in one piece and the third blade is placed separately on the same boat. Therefore one turbine is transported in three pieces to the site and requires three offshore lifts at the construction site.
Hub and three blades are assembled at the port shaping the complete rotor. Tower (in two pieces) and nacelle are placed separately on the same boat. Therefore one turbine is transported to the site in four pieces and requires four offshore lifts at the construction site.
The tower is assembled at the port and carried in one piece. The hub and nacelle is assembled at the port as well. The blades are left separately and placed in the “blade stacker”. Therefore one turbine is transported in five pieces to the site and requires five offshore lifts at the construction site.
The hub and the nacelle are assembled at the port. The tower is carried in two pieces and the blades are placed in the “blade stacker” separately. Therefore one turbine is transported in six pieces to the site and requires six offshore lifts at the construction site.
All those concepts mentioned above have either positive or negative effect on the installation performance. Increasing the amount of pre-assembled pieces on the deck decreases the
7 offshore installation time, but in fact the increased volume of the assembled structures must be considered as it can lead to a less efficient way of using the available deck space of the vessel. Another consideration is that carrying assembled pieces on the boat requires good sea conditions since the dynamic loads acting on them during the transportation are beyond their design parameters. This is also another fact that makes the project flow more dependent on the sea conditions.
Choosing the right installation vessel and the optimum T&I concept according to the specific conditions of the project site is highly essential in order to achieve a flowing T&I process for OWTs with an optimum duration.
Hence this research aims to;
Identify the site challenges, the technical specifications of the installation boats (currently used and incoming) and the OWTs in order to project the technical capabilities of the installation vessels in detail and the design trends for the future. Discuss the advantages and disadvantages of the different pre-assembly methods, and
quantify the parameters that affect the performance of T&I phase (i.e. the amount of time spent on offshore lifts, the cargo capacity needed per turbine and so on) in order to discuss and make comparisons.
Create a general approach for time wise modeling the “transportation and installation process” of offshore wind turbines in order to figure out the effect of different parameters on the overall duration for achieving the logic of optimization.
1.3. Methodology
Technical specifications of the installation vessels have been collected from the technical sheets that were accessed via the websites of the owner and/or the designer companies. Twenty-five different details regarding the owner, the year the vessels were built, dimensions, operational conditions, jack-up capabilities, service speed, and crane capacities of thirty-one installation vessels were collected.
The missing information in the technical sheets of the vessels was filled with approximated values using the data of the other similar vessels (in same class, in similar shape, and in similar dimensions). A data sheet in “MS Excel” was created to assess, sort and filter the vessels more practically in order to make analyses.
Existing and the future wind turbines were specified by their manufacturers and models. The technical sheets were accessed via the manufacturer’s web sites. Weights and the dimensions of the turbine components, with other technical details were listed in an “MS Excel” sheet in order to assess the data practically.
Existing offshore wind farms and others under construction (in the North Sea, Irish Sea and English Channel and Baltic Sea region) were investigated. Fourteen of the projects in the region were analyzed through their brochures, documents, reports and company newsletters that were accessed via the websites of developers, installers, marine contractors and owner companies.
Vessels that conducted the offshore installation works, the amount of turbines that were placed on the vessel at once, the pre-assembly configurations, total number of turbines in the
8 wind farm, sea depths of the farm site, and the distances between the site and the base port were found and listed for each project in a “MS Excel” sheet. The total durations of the turbine erection phases of the completed projects were also found and listed.
Distances between the base port (logistic hub) and the farm site were established by using “Google Earth” software. The coordinates of the wind farms were inserted in order to determine the exact location. Locations of the ports were found manually by using the “search tool” of the same software. Distance between ports and corresponding wind farms were achieved by drawing the possible shortest path (that a vessel can take on the sea) by using the “path tool”. Knowing that the precision of the method is open to discussion, it was conducted for estimating an average distance in order to find out how much time was spent on the voyages for transportation between site and port.
All the information contributed about installation vessels, wind turbines and wind farm projects, were used as a foundation for time-wise modeling the “turbine erecting process”. Approximate time need for each offshore lift (combined with assembly) was found from the reports and also was extracted from the graphs. An average time is estimated for lifting operations to be used in the estimation model.
The model was applied on the existing project to see the accuracy of the estimations, and then was used for analyzing the effect of parameters such as water depth, distance, lifting performances on the project durations.
9
2. Site Specific Factors
The performance and feasibility of the turbine installation phase is highly dependent on site specific parameters such as water depth, wind conditions, sea conditions, and sea bed conditions. The effect of each parameter is defined under the following headings.
2.1. Water Depth
Water depth is the one of the factors that limits the availability of the location for offshore wind farms. The main effect of the water depth is on the cost of the foundations which are already expensive compared to onshore foundations since the increasing water depth increases the cost of the foundation.
Another effect of the water depth is that it limits the number of available installation vessels in the market (See Installation Vessels, p.14). Water depth also affects the project timing and cost consequently since the duration of the jack-up operations (which is needed for each turbine) is dependent on water depth and the jack up speed of the vessel.
Figure 1: Development of the offshore wind industry (EWEA Offshore Report, 2009) Source: [2]
The scatter in Figure 1 shows the probable future development trends in the approximate time frame of 2025 in terms of water depths and distance to shore. It clearly shows that offshore wind farm development will not be on the locations that have great distance to shore and great water depth at the same time since both affect the feasibility of the project.
Not only deep water but also shallow water can become an obstacle at some point. If the water depth on a certain region is equal or less than the maximum draft of the vessel it becomes unable for the vessel to maneuver on those locations (See Installation Vessels, p.14).
10 An example for this situation is observed in the construction phase of Lillgrund Wind Farm which is located 10 km off the southern side of the west Swedish coast (south of Öresund Bridge that is between Malmö and Copenhagen). The “hole” in the park lay out shown in blue circle below is due to the shallow water at the corresponding turbine locations. The water level is such shallow that the installation vessel could not maneuver on certain locations. [3]
Figure 2: Lillgrund Offshore Wind Park, Farm Layout, Source: [3]
Farm name Min. depth
(meters) Max. depth (meters) Average (meters) Commissioning year Horns Rev I 6 14 10 2002 Nysted 6 9 7.5 2003 North Hoyle 7 11 9 2004 OWEZ 15 20 17.5 2006 Lillgrund 4 10 7 2007 Prinses Amalia 19 24 21.5 2008 L&I Dowsing 6.3 11.2 8.75 2009 Rhyl Flats 6.5 12.5 9.5 2009 Horns Rev II 9 17 13 2009 Thornton Bank 12 27.5 19.75 2009 Thanet 20 25 22.5 2010 Belwind 1 20 37 28.5 2010 Ormonde 20 28 24 2011 Greater Gabbard 24 34 29 2011
Table 1: Selected wind farms in the Baltic Sea, North Sea and Irish Sea Region, with water depths and commissioning year, Source: [4], [5], [6]
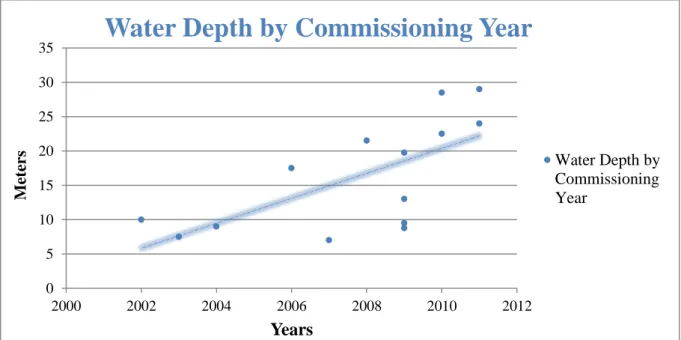
11 Today the average water depth of offshore project sites (in the North Sea, Baltic Sea and Irish Sea region) for both existing and the ones under construction is up to 40 meters. The development of offshore farms in terms of water depth by years, using the information in Table 1, is shown in Figure 3.
Figure 3: Water Depth (Averages) Vs. Years (for the wind farms given in the Table 1), by Author
2.2. Sea Bed Conditions
Seabed conditions of the planned location of the offshore wind farm are so important for many reasons. The type of foundation to be used in the farm is highly related to the seabed conditions. Therefore geophysical surveys are highly necessary for selecting the right foundation design. Secondly, the seabed conditions are also important for the Jack Up vessels for choosing the exact location to rise on their jack-up legs. In order to avoid dangerous situations, the positioning on the suitable spot around the wind turbine is vital. [7]
Jack-up vessels have certain design parameters and “operational conditions” for working safely. The operational seabed penetration for jack up vessels range between 2 to 6 meters (“Operational Seabed Penetration” is the amount of leg penetration into the seabed, See
Figure 4). If the seabed around the turbine location is not firm enough to support the vessel
with stability, it can cause the legs to slide, get stuck, and/or penetrate further into the sea bed which can give damage to the structures or cause disasters.
Sometimes seabed conditions very close to the turbine may not be suitable whereas a distant spot can be more appropriate (which still assumed to be close enough for crane operation). At that time the boom length of the onboard crane and the lifting capacity at that distance must be considered. The lifting capacities and the reachable height of the cranes decrease as the outreach distance increases (See Onboard Cranes, p.16). Therefore the weight of the turbine piece must be less than the Safe Working Load (SWL) of the crane at the calculated outreach. Hence the assessment of seabed is highly necessary.
0 5 10 15 20 25 30 35 2000 2002 2004 2006 2008 2010 2012 Me ter s Years
Water Depth by Commissioning Year
Water Depth by Commissioning Year
12 Figure 4: Seabed Penetration (leg penetration)
(Source: [7], edited by Author)
2.3. Environmental Conditions
During the installation period, the environmental limitations such as wind speed, snow, ice, ambient temperature, lightning, insufficient water depth, sea state, and visibility should be considered. The installation must be carried on only during when the “required conditions for safety” that is specified by the manufacturer are observed [8]. Among these parameters the wind speed at the location and the sea state (both for transportation and installation) have the biggest impact on the T&I process.
The purpose of installing a wind farm is utilizing the wind energy as much as possible, so that the proposed project sites likely have high wind speeds. Having a good wind resource of course is very good for electricity generation so for the profitability of the project, but in fact high wind speeds put limitations on the crane operations.
Installation of the towers and the nacelles can be carried on up to 10m/s of wind speeds while the same kind of limitation for lifting the blades is 7m/s of wind speed [9].
According to the installation method, turbine size, crane performance and the experience of the personnel conducting the installation work, the duration of installing a turbine can vary. The required duration with a clear weather allowing safe installations (including the probability of delays) is called “weather window”. The installation work must be fitted within this time window.
The sea conditions also have effect on transportation and installation of the turbines. According to the technical specification sheets of the vessels, the maximum significant wave height2 (SWH) for jacking up ranges between 1.5 meters to 3.7 meters. In Table 2, the
2 Significant Wave Height:
13 operational conditions of the vessel in terms of SWH, sea currents, and the operational air gap are given (for operational air gap see Figure 4 above). The period of the waves is also another parameter that is needed to be considered. Required sea conditions for each specific case can vary according to the vessel and cargo load. It can be generalized that transporting pre-assembled turbines or turbine parts requires calm sea conditions.
The variation in the water level at the wind turbine site should be assessed in order to determine the mean sea level, highest still water level, lowest still water level, the highest astronomical tide and the lowest astronomical tide. Tidal, storm surge, wind generated and wave induced surf currents shall be assessed since it affects the location and orientation of the boat landings. [8]
It is highly important to get proper forecasts of the local weather, wind and sea conditions in order to complete the installation work within the weather window, and transporting the turbines to the location safely.
Name of the Vessel Type Current(m/s) SWH(m/s) Air gap (m) Year Built Vagant JUB 1.5 1.5 3 2002 Pauline JUB 1.5 2 6.5 2002 Sea Worker (SEA2000) JUB 1.5 1.5 13.5 2008 SeaFox 7 JUB 1.5 3.7 13.5 2008
Goliath (SEA 2000) JUB 1 3.7 13.5 2009
JB 116 (SEA 2750) JUB 1.5 3.7 13.5 2010
JB 117 (SEA 3250) JUB 1 3.72 13.5 2011
MPI Resolution WTIV 1 3 7.8 2003
Kranken & Leviathan (sister) WTIV 1.03 2 17.5 2009 Zaratan WTIV 1.03 1.5 14 2012 Windcarrier 1 & 2 (sister) (NG 9000C) WTIV 2.5 1.8 15 2012 Seafox 5 WTIV 1 2 20 2012
Table 2: Operational conditions for installation vessels (See Appendix C1. References for Vessels) WTIV represent the self-propelled, purpose built vessels,
14
3. Installation Vessels
Turbine erections are commonly done by self-propelled installation vessels and/or Jack-Up Barges. According to the year they were built, and the purpose they were designed for, the vessels have different capabilities. Offshore turbine installations require lifting the heavy turbine pieces and placing them at certain heights. Even a small move of the vessel can cause a few meters of error at the hook height. In order to safely install these heavy components, and to be able to place them on the exact place precisely, the installation vessels rise on their jack up legs to create a stable working platform at the construction site.
These installation vessels are specified in two groups;
Wind turbine installation vessels (purpose built for wind industry) Jack up barges (general offshore construction)
3.1. Wind Turbine Installation Vessel (WTIV)
The wind turbine installation vessels are self-propelled units that are specially designed in line with the industry demands. These purpose-built self-propelled installation vessels have jack up legs and cranes with big lifting capacities (See Picture 1 in Appendix B, Pictures, p.51). Today the cargo capacity of the WTIV’s varies from 1300tons (metric) to 8000tons while the area of available deck space for placing the cargo varies from 900m2 to 3750m2. Maximum operational water depth for WTIVs ranges between 24 meters and 45 meters while the leg lengths are varying from 32meters to 85meters. (See Table 3)
The service speed of these vessels is in the range of 7.8 to 12.5knots (See Conversion Factors
for non-SI Units p.1) and the jacking speed is also in the range of 0.35 to 0.8meters/minute
(due to weight of the cargo “jack up” speeds can vary) (See Table 3). WTIVs have Dynamic positioning systems which enables them to stay constant at a certain point to be able to land their legs on the exact locations precisely. Onboard accommodation capacities of these vessels are ranging from 16 beds up to 112 beds.
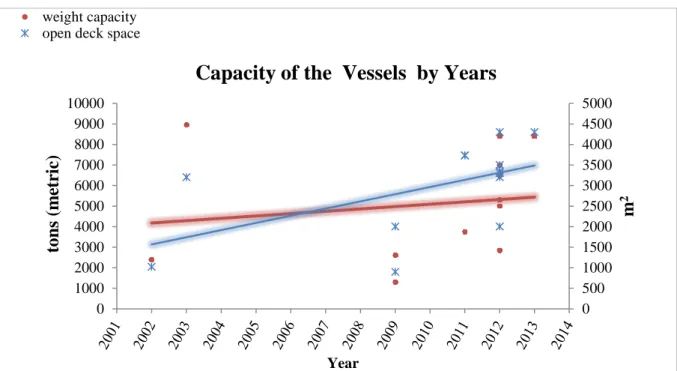
It can be said that the site specific conditions such as water depth (See Figure 1), and “distance to shore” of the proposed offshore wind farm locations have influence in the design considerations of newly built WTIV’s. The industry trend towards installing multiple wind turbines in one haul (using larger turbines up to 6 MW) created a larger deck space requirement. The response of the installation industry by investing in more capable WTIV’s is observed in Figure 5 and Figure 6. Therefore incoming vessels in the year 2012 and 2013 will have larger available deck space in the range of 2000 to 4300m2 (See Figure 5) and cargo capacity (weight wise) in the range of 2850 to 8400tons. Operational water depths of the incoming vessels will be in the range of 45 to 75meters (See Figure 6).
According to Offshore Wind Magazine [10], an efficient purpose-built installation vessel must have a strong jacking system which is able to make 300 cycles per year, 4000 tons payload, 3000 m2 deck available area, and an onboard crane with a “safe working load” of 700 tons.
15
Name Year Deck
Space m2 Capacity (tons) Speed knots Leg Length (m) Water Depth* (m) Jacking speed (m/min)
Sea Energy 2002* 1020 2386 7.8 32 24 Semi jack
up MPI Resolution 2003 3200 8950 11 71.8 35 0.5 Leviathan 2009 900 1300 8 85.6 41 0.8 Wind Lift 1 2009 2000 2600 8 71 45 0.35 MPI Adventure 2011 3730 3750 12.5 71.5 40 0.35 MPI Discovery 2011 3730 3750 12.5 71.5 40 0.35 Zaratan 2012 2000 2850 9.1 85 45 0.4 Windcarrier 1 & 2 (sister) 2012 3200 5300 12 81.5 45 0.4 Seafox 5 2012 3500 7000 10 106 65 1 Sea Installer 2012 3350 5000 12 83 45 0.5 Van Oord 2012 3300 6500** 12 81 45** 0.5** Pacific Orca 2012 4300 8400 13.5 105 75 1.2 to 2.4 Pacific Osprey 2013 4300 8400 13.5 105 75 1.2 to 2.4
Table 3: WTIVs specifications (See Appendix C1. References for Vessels Appendix C, References )
* The vessel was adapted to wind turbine installation works at that year
** Assumptions and evaluations were made according to similar sized units, due to lack of details in the technical sheets of the corresponding vessel
Figure 5: Cargo capacity of the WTIV’s by years (for the vessels given in Table 3), by Author 0 500 1000 1500 2000 2500 3000 3500 4000 4500 5000 0 1000 2000 3000 4000 5000 6000 7000 8000 9000 10000 m 2 t ons (m et ric ) Year weight capacity
open deck space
16 Figure 6: Operational water depth of the WTIV’s by years (for the vessels given in Table 3), by Author
3.2. Onboard Cranes
Both WTIVs and JUBs have onboard cranes to be able to carry out the installation work at the construction site offshore. The turbine pieces which can weigh up to 400 tons (RePower 6 MW Nacelle with hub, See Offshore Wind Turbines (OWT), p.22) must be lifted and assembled at certain heights ranging from 70 to 100 meters in general (i.e. Hub height of
RePower 5MW Machine in Thornton Bank offshore Wind farm is 94 meters).
There are three main parameters (See Figure 7) that can define the overall capacity of a crane such as;
Boom length,
Outreach (or radius), and Safe working load (SWL)
Safe working load (SWL) of a crane is always defined at a certain radius since SWL is a function of the radius. As it is clearly seen in Figure 8, the SWL capacity gradually decreases as the radius increases. All cranes in similar design have this kind of SWL-Radius curves, and for telescopic booms each boom length has different lifting capacity with a different curve but still all the curves have similar trends.
For instance, if the seabed conditions do not allow the vessel to safely jack up at a distance less than approximately 35 meters (equivalent to 55 meters radius) to the turbine, then the SWL capacity would be around 100 tons for the vessel given in Figure 8 (whereas the maximum lifting capacity was 300 tons at 25 meters radius). In such a case installation of the nacelle of a Siemens 3.6 MW (weighs 125 tons without hub) could not be possible.
0 10 20 30 40 50 60 70 80 M et er s Years
Operational Water Depth by Years
17 Figure 7: Onboard Crane of a Wind Turbine installation Vessel,
(Source: “Technical Sheet of MPI Resolution”, edited by Author) URL:
http://www.mpi-offshore.com/files/file/MPI_Resolution_web.pdf?phpMyAdmin=0b6827d624b97bf2a24460fc019dbaae) Date of access: 18.04.2011
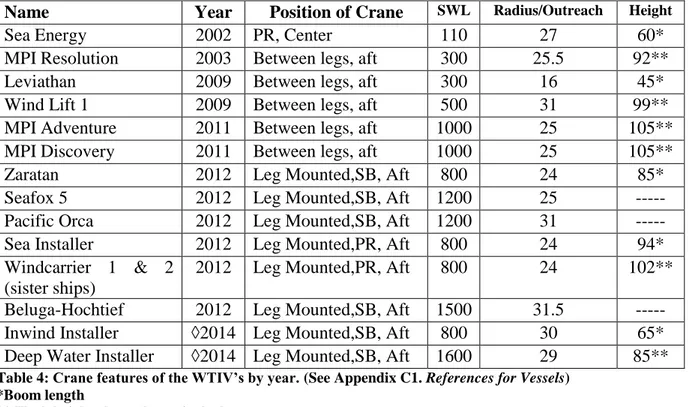
In the technical sheets of the installation vessels the lifting heights of the cranes are defined either by boom length or height above the main deck. In Table 4, SWL values with radius and hook heights (or boom length) and the position of the cranes are given together for some of the vessel currently being operated (or being constructed).
Installation vessels usually have two onboard cranes, one of them being the main crane and the other being the auxiliary crane. In order to simplify projection of the maximum capacities, only the main cranes of the selected vessels are given in Table 4.
The hook height above the main deck (for elevated lifts) combined with the operational air gap and the hull depth gives the approximate accessible lifting height at a specific case. For instance the operational air gap for “MPI Resolution” is given 7.8 meters, and depth of the hull is 8 meters which gives an approximate accessible height of (93 + 7.8 + 8 = 108.8) 108.8 meters at a radius of 25 meters (See Figure 8).
18 Figure 8: SWL vs. Radius, and Hook Height vs. Radius (Main crane of “MPI Resolution”)
Hook Height(curve on the top) Elevated Lifts (SBP + Water depth + Air gap ≤ 48 m) (curve in the middle) Floating Lifts (Zero Sea State)(curve on the bottom)
(Source: “Technical Sheet of MPI Resolution”), URL:
http://www.mpi-offshore.com/files/file/MPI_Resolution_web.pdf?phpMyAdmin=0b6827d624b97bf2a24460fc019dbaae) Date of access: 18.04.2011
19
Name Year Position of Crane SWL Radius/Outreach Height
Sea Energy 2002 PR, Center 110 27 60*
MPI Resolution 2003 Between legs, aft 300 25.5 92**
Leviathan 2009 Between legs, aft 300 16 45*
Wind Lift 1 2009 Between legs, aft 500 31 99**
MPI Adventure 2011 Between legs, aft 1000 25 105**
MPI Discovery 2011 Between legs, aft 1000 25 105**
Zaratan 2012 Leg Mounted,SB, Aft 800 24 85*
Seafox 5 2012 Leg Mounted,SB, Aft 1200 25 ---
Pacific Orca 2012 Leg Mounted,SB, Aft 1200 31 ---
Sea Installer 2012 Leg Mounted,PR, Aft 800 24 94*
Windcarrier 1 & 2 (sister ships)
2012 Leg Mounted,PR, Aft 800 24 102**
Beluga-Hochtief 2012 Leg Mounted,SB, Aft 1500 31.5 ---
Inwind Installer ◊2014 Leg Mounted,SB, Aft 800 30 65*
Deep Water Installer ◊2014 Leg Mounted,SB, Aft 1600 29 85**
Table 4: Crane features of the WTIV’s by year. (See Appendix C1. References for Vessels) *Boom length
** Hook height above the main deck ◊Year of delivery is unknown (estimated)
PR: Port (Left Side of the Vessel) SB: Starboard (Right side of the Vessel)
Plotting the lifting capacity values against the years that are given in Table 4, illustrates the increasing trend of the lifting capacity which is in line with the offshore industry’s trend towards using larger OWT’s is observed in Figure 9.
Figure 9: WTIV crane capacities by years (for the vessels in Table 4) by Author Represents the values in the last 2 rows in Table 4, (Year of delivery date is estimated)
1600 0 200 400 600 800 1000 1200 1400 1600 1800 2002 2004 2006 2008 2010 2012 2014 2016 T o ns Years
20 The position of the onboard crane on the deck is an important design detail for WTIVs since the deck space is an asset that determines the number of turbines that can be fitted on the vessel. Therefore the design trend is towards mounting the crane on one of the jack up legs. As it is shown in Table 4, the new generation WTIVs (Built after 2011) has their main cranes mounted on the leg. In order to describe the crane positioning clearly, illustrations (according to Table 4) are shown in Figure 10.
Figure 10: Crane Positions on WTIVs from top view (Drawings are illustrative)
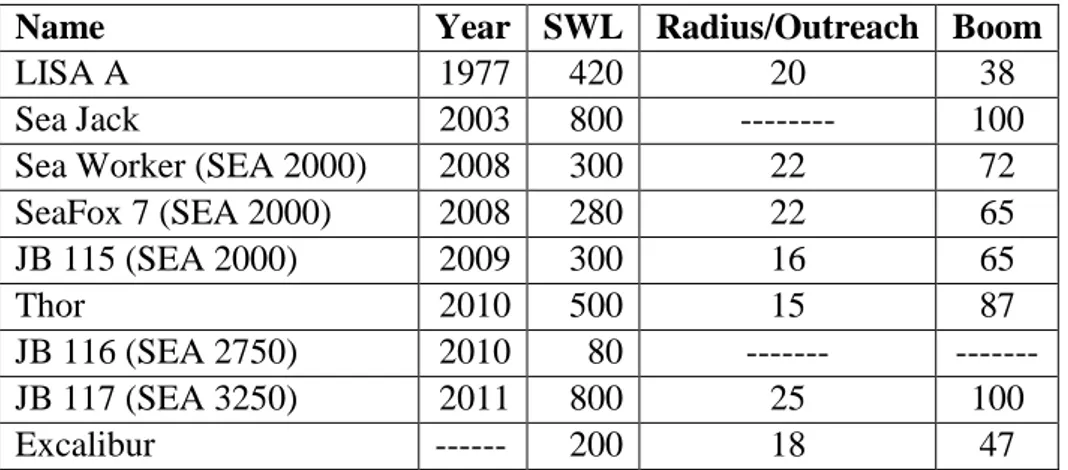
Jack Up barges have onboard cranes almost as capable as WTIV’s. The lifting capacities of the main cranes of JUB’s can range between 50 tons to 800 tons (approximately) according to their design purposes and their sizes. In Table 5 some of the jack-up barges that have been used in offshore wind industry are given with their crane capacities.
Name Year SWL Radius/Outreach Boom
LISA A 1977 420 20 38
Sea Jack 2003 800 --- 100
Sea Worker (SEA 2000) 2008 300 22 72
SeaFox 7 (SEA 2000) 2008 280 22 65 JB 115 (SEA 2000) 2009 300 16 65 Thor 2010 500 15 87 JB 116 (SEA 2750) 2010 80 --- --- JB 117 (SEA 3250) 2011 800 25 100 Excalibur --- 200 18 47
21
3.3. Jack Up Barges (JUB)
The Jack-Up barges are floating units that are capable elevating themselves at the construction site on their jack up legs. They are designed for general offshore construction and drilling purposes but at the same time they are being used in offshore wind industry quite commonly. Compared to WTIVs, most of the JUBs have less cargo capacity so that the number of turbines they are capable of carrying is also less (See Picture 2 in Appendix B, Pictures). JUBs are not self-propelled units and they must be towed to the construction site. The service speed of the barges is dependent on the tug’s power (a speed of 5 knots can be assumed) [11]. JUBs do not have Dynamic Positioning Systems (DPS). Their cargo capacity ranges from 900 to 2000 tons in terms of weight. Their open deck space for cargo placement varies between 400 and 2500 m2. Operational water depth (max) for JUBs is in the range of 18 to 50 meters and leg lengths are 40 to 82 meters.
Jacking speed of JUBs is generally in range of 0.15 to 0.8 meters/minutes. Onboard accommodation for the crew and personnel ranges from 10 to 160 beds. Dimensions, technical specifications and other features of some of JUBs that have been involved in OWT transportation and installation works are given in Table 6.
Name Year Space m2 Capacity
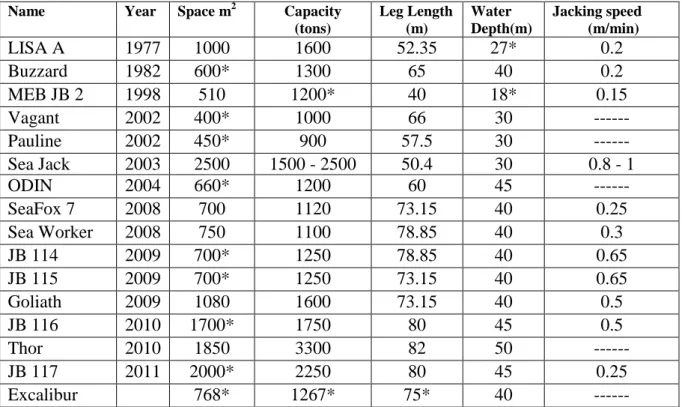
(tons) Leg Length (m) Water Depth(m) Jacking speed (m/min) LISA A 1977 1000 1600 52.35 27* 0.2 Buzzard 1982 600* 1300 65 40 0.2 MEB JB 2 1998 510 1200* 40 18* 0.15 Vagant 2002 400* 1000 66 30 --- Pauline 2002 450* 900 57.5 30 --- Sea Jack 2003 2500 1500 - 2500 50.4 30 0.8 - 1 ODIN 2004 660* 1200 60 45 --- SeaFox 7 2008 700 1120 73.15 40 0.25 Sea Worker 2008 750 1100 78.85 40 0.3 JB 114 2009 700* 1250 78.85 40 0.65 JB 115 2009 700* 1250 73.15 40 0.65 Goliath 2009 1080 1600 73.15 40 0.5 JB 116 2010 1700* 1750 80 45 0.5 Thor 2010 1850 3300 82 50 --- JB 117 2011 2000* 2250 80 45 0.25 Excalibur 768* 1267* 75* 40 ---
Table 6: Technical Properties of Jack-Up Barges (Ref: See Appendix C1. References for Vessels) *Evaluated according to similar sized vessels,
22
4. Offshore Wind Turbines (OWT)
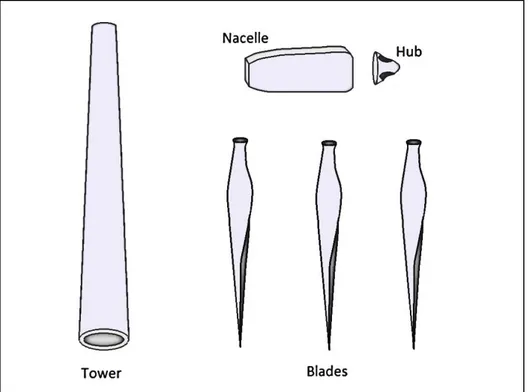
Offshore wind turbines are structurally as same as the onshore wind turbines except some adjustments in their designs for harsh sea conditions. Structurally a wind turbine consists of six main parts that are tower, nacelle, hub, and three blades see Figure 11 below.
Figure 11: Six Main Components of a Wind Turbine, by Author
Towers are cylindrical structures that support the nacelle at a certain height. They are one of the heaviest pieces of the wind turbine and it is commonly made up of steel for offshore turbines. The weight of the tower is dependent on its height, diameter and plate thickness. The plate thickness and diameter of the tower (Diameter of the base which is the maximum diameter for conical towers) is dependent on the weight of the nacelle and the hub height (See Figure 12). The tower of a 3MW turbine can vary from 182 to 274 tons and the tower of a 5MW turbine can vary from 278 to 389 tons in general sense (See Table 7) [12].
3MW 5MW
Height Weight Thickness Diameter
Base/Top
Weight Thickness Diameter Base/Top
80 m 182 t 15-34 mm 3 / 4.5 278 t 52 mm 3.8 / 4.5
100 m 274 t 15-43 mm 3 / 4.5 389 t 68 mm 3.8 / 4.5 Table 7: Characteristics for Turbine Towers [12]
Due to their weights and dimensions, towers are transported in 2 pieces (while onshore) but for offshore installations, according to the onboard crane capacity of the installation vessel,
23 they can be assembled at the port and be transported to the construction site in one piece (See
Transportation and Installation Concepts, p.25).
Figure 12: Tower of a Wind Turbine, by Author
The nacelle is a “box shaped” structure and it contains all the power generation systems inside. The weight of nacelles can vary according to the design and the capacity of the generator inside. The weight of nacelles without hub is in the range of 69 to 316 tons. However it is common to transport nacelles together with hub (nacelle and hub assembled). The weight of the hubs varies between 18 to 84 tons so in that case the weight of the assembled hub-nacelle combination can rises up to 400 tones.
Figure 13: Nacelle and Hub, by Author
Blade dimensions are proportional to the power capacity of the turbine. According to site specific parameters even larger or smaller rotor diameters can be preferred for the same power capacity (i.e. Vestas V90 and V112 has the same power capacity of 3MW but designed for different wind conditions). Today the blade lengths of the turbines vary from 40 meters to 60
24 meters. The main challenge in blade installation and transportation is due to their sizes instead of their weights. Weight of a blade varies from 6.5 to 24 tons which is not a challenge for lifting in terms of weight but since it is an aerodynamic component, the wind plays important role in the lifting and assembly process (See Environmental Conditions, p.12)
There are 7 turbine models that are observed in most of the offshore wind farms in common. These turbines are listed with weights of their component in Table 8.
Model Power(MW) Hub (t) Blade (t) Rotor (t) Nacelle (t) *Tower (t) Total (t)
Vestas V80 2 18 6.5 37.5 69 155 216.5 Siemens 2.3 2.3 32.3 9.2 60 82 130 272 Vestas V90 3 40 9 67 70 110 247 Siemens 3.6 3.6 42.4 17.2 95 125 180 420 Areva M5000 5 62 16.5 110 233 200 543 RePower 5 5.075 84 24 156 290 210 656 RePower 6 6.15 84 24 156 316 285 757 Vestas V164** 7 --- 35 227.5 +/- 390 --- ---
Table 8: Weight of the components of the Offshore Wind Turbines (See Appendix C2. References for Wind
Turbines)
*Tower weights are not given in the technical sheets. Values are evaluated from the tower weights of the existing turbines
** Is not in the market. First prototypes are expected in 2012. Serial production will begin in 2015, its nacelle weight includes hub [13]
25
5. Transportation and Installation
Concepts
Offshore wind farm sites are selected for their good wind potentials which limit the installation in terms of available time window for safe crane operations. Since choosing a less windy site is not an option for solving this problem, different installation concepts are developed to reduce the time spent on offshore works in order to fit the installation work within the time windows. These concepts are based on carrying the components pre-assembled at the port (pre-pre-assembled). Having 6 components per turbine creates various numbers of pre-assembly methods and when considering that the towers are in two pieces, the number of components becomes seven which in return increases the number of pre-assembly options. However there are five methods that are commonly being applied in the offshore wind farm installations. In this paper those methods are given acronyms such as BE1T, BE2T, R2T, SP5 and SP6 in order to call them shortly.
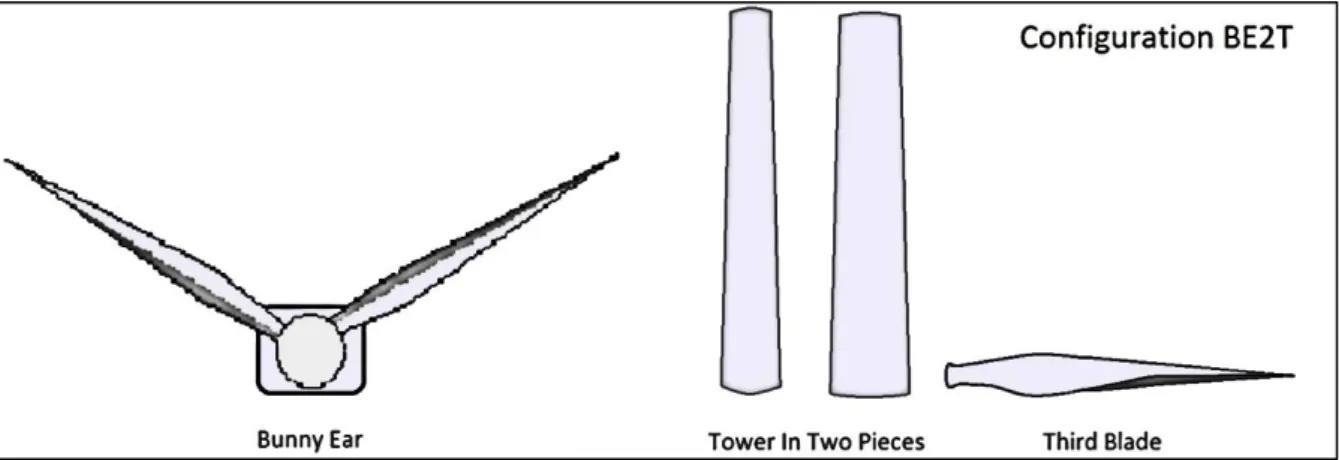
5.1. “Bunny Ear” with a Tower in Two Pieces (BE2T)
Nacelle, hub and two of the blades are assembled together at the port which shapes like a bunny head hence it is called “bunny ear” in the industry (See Figure 14). The tower is carried in two pieces and the third blade is also placed separately on the same vessel. Therefore one turbine is transported in four pieces to the site. This configuration is called “bunny ear with two pieces of tower” (shortly BE2T) and requires four offshore lifts at the construction site.
Figure 14: Bunny Ear Configuration with Two Turbine Pieces, by Author
5.2. “Bunny Ear” with a Tower in One Piece (BE1T)
Nacelle, hub and two of the blades are assembled at the port to shape the “bunny ear”. The tower is also assembled to be carried in one piece and the third blade is placed separately on the same vessel (See Figure 15). Therefore one turbine is transported in three pieces to the site. This configuration is called “bunny ear with tower in one piece” (shortly BE1T) and requires three offshore lifts at the construction site.
26 Figure 15: BE1T, Bunny Ear Configuration with One Turbine Pieces, by Author
5.3. Pre-Assembled Rotor (R2T)
Hub and three blades are assembled at the port to shape the complete rotor. The tower (in two pieces) and nacelle are placed separately on the same boat (See Figure 16). Therefore one turbine is transported to the site in four pieces. This configuration is called “R2T” and requires four offshore lifts at the construction site.
Figure 16: R2T, Assembled Rotor, nacelle without hub and tower in two pieces, by Author
5.4. Five Pieces Separately (SP5)
The tower is assembled at the port and carried in one piece. The hub and nacelle are assembled at the port as well. The blades are left separately and placed in the “blade stacker”. Therefore one turbine is transported to the site in five pieces (See Figure 17). This configuration is called “Separate Pieces, 5” (shortly SP5) and requires five offshore lifts at the construction site.
27 Figure 17: SP5, Nacelle with hub, Tower in one piece and Three Turbine Blades Separately, by Author
5.5. Six Pieces Separately (SP6)
The hub and the nacelle are assembled at the port. The tower is carried in two pieces and the blades are placed in the stacker separately. Therefore one turbine is transported to the site in six pieces (See Figure 18). This configuration is shortly called “separate pieces 6” (shortly S6P) and requires six offshore lifts at the construction site.
Figure 18: SP6, Nacelle with hub, Tower in two pieces and Three Turbine Blades Separately, by Author
5.6. Methods in Comparison
All those five pre-assembly concepts mentioned above have either positive or negative effect on the installation performance. While increased amount of pre-assembled pieces on the deck reduces the amount of offshore construction work, the larger volume of the assembled components prevents the efficient use of the deck space in some cases. Another fact is that sea transportation of assembled pieces requires good sea conditions for transportation since the dynamic loads acting on the assembled turbine components during the transportation can be beyond their design parameters. This is also another fact that makes the project flow more
28 dependent on the sea conditions. Illustrations of how these parts are placed on the WTIV’s deck are shown in Figure 19. [10]
Choice of method is related to the vessel size, distance from port to site, size of the turbine components and the lifting capacity of the onboard crane of the vessel. When looking at the T&I phase of the fourteen analyzed projects, these five methods are observed on 9 different WTIVs or JUBs.
Dividing the available deck space of the vessel (given in the technical sheet) by the number of turbine being carried at once can be used as an approach to figure out how much space is needed for one turbine in the corresponding configuration. If the turbines that are in the range of 2MW to 3.6 MW assumed to occupy the same amount of deck area, and if the single turbine transportations are ignored and the projects with 5MW turbines given in Table 9 are excluded, the amount of area requirement per turbine on WTIV’s turns out to be 510 m2 in BE1T, 255 to 510 m2 in R2T, 350 to 355 in SP5 and 450 to 533 m2 in SP6 (See Table 9) in general.
Wind Farm Configuration Installation Unit
(MW) # turbines on deck
m2/turbine Weight Capacity Used
Horns Rev 1 BE1T Sea
Energy
2 2 510 18.1%
Horns Rev 1 BE1T Sea Power 2 2 510 18.1%
Prinses Amalia BE1T Sea
Energy
2 2 510 18.1%
OWEZ BE1T Sea
Energy
3 2 510 20.7%
North Hoyle BE2T Excalibur 2 1 768 34.2%
Ormonde R2T SeaJack 5 2 1250 52.5%
Nysted R2T Sea Power 2.3 4 255 41.9%
Lillgrund R2T Sea Power 2.3 3 340 34.2%
Horns Rev II R2T Sea Power 2.3 2 510 22.8%
Belwind 1 SP5 JB 114 3 2 350 39.5%
Rhyl Flats SP5 Lisa A 3.6 1 1000 26.3%
Thanet SP5 Resolution 3 9 355.5 24.8%
Greater Gabbard
SP6 Levithan 3.6 2 450 64.6%
Thornton Bank SP6 Vagant 5 1 400 65.6%
Lynn & Inner Dowsing
SP6 Resolution 3.6 6 533.3 28.2%
Greater Gabbard
SP6 SeaJack 3.6 3 833.3 50.4%
Table 9: Statistics on “Deck load Configurations” over 14 existing projects (See Appendix C3. References
for the Offshore Projects) Vessels written in Italic are JUBs
The sample deck load scenario given in the promotional technical sheet of the installation vessel called “Pacific Ocean” (which is going to be built in 2012), shows that 12 turbines are planned to be fitted on the deck at configuration SP5. Considering the available deck space of the vessel is 4300 m2, an area requirement of 358m2 per turbine can be extracted. This value has a good agreement with the values of “Thanet” and “Belwind 1” examples given in Table 9
29 which are 355m2 and 350m2 respectively. Hence it can be stated that the values determining the deck space need for turbines in configuration SP5 are consistent.
Figure 19: Different Deck Load Configurations on a WTIV (Drawings are Illustrative), by Author
The Data given in Table 9 (columns: m2/turbine and weight capacity used) is evaluated by using the information in Table 3, Table 6, and Table 8.
As it is shown in Table 9, 5 MW turbines are observed in two projects (Thornton Bank and Ormonde) and the deck load configuration in those projects are different hence there is not enough statistical data for evaluating an average value. The weight and size of these machines are significantly different than other turbines (2MW to 5MW), and area used per turbine is not appearing to be in the range of applications.
In three of the projects shown in Table 9 (North Hoyle, Rhyl Flats and Thornton Bank), it is seen that number of turbines on the deck at a time is one and the corresponding values in the m2/turbine column for them are found to be irrelevant when they are compared to other values in the same column.
One important statement can be made depending on the statistics in Table 9 is that the weight of the turbines does not affect the transportation. In Table 9, total cargo weights are not even close to the capacities of the vessels. The maximum cargo weight is 65.6% of the vessels cargo capacity in “Thornton Bank” project.
The limitation in transporting the turbines to a construction site is the deck space of the vessel. In order to easily see how the need of deck space per turbine changes by deck load configurations, the data in Table 9 are scattered below in the Figure 20. The scatter only contains the statistics of cases which have multiple turbines on the deck at a time and only for WTIV’s (projects with 5MW turbines and single turbine transportation are excluded).
30 Figure 20: Deck Configurations vs. Area Need per Turbine, by Author
In the graph for the values on x-axis; 3 refers to BE1T, 4 Refers to R2T, 5 Refers to SP5 and 6 Refers to SP6
The values on the x-axis also correspond to the number of offshore lift for each configuration.
In Figure 20, the numbers on the x-axis refer to the deck configurations (explained immediately under the figure). The numbers also represent the number of offshore lifts per turbine. In Figure 20, only 4 Configurations can be shown since BE2T does not have enough implementation to create statistical values.
The Values in the Table 9 cannot be directly used for real cases and cannot be applied on each vessel. These numbers are evaluated through the statistics to create an approach to the concept. But in fact values for SP5 can be considered reliable.
In actual case of transportation, the stability of the vessel and weight distribution uniformity would play important roles. For instance if R2T is picked and applied on a vessel (i.e., MPI Resolution has a deck space of 3200m2), than the number of turbines that can be fitted on the deck in R2T turns out to be 12 (using 255m2/turbine) which can be unrealistic. The reason for that is the total weight of 12 rotors together represents approximately 804 tons (for the rotor of Vestas V90) that would act on one circular area of approximately 9m2 (area of the hub) on the deck which would not be applicable due to the vessels stability (in R2T, the complete rotors are put above each other as shown in Figure 19). Additionally the surface of the deck is able to resist 10 t/ m2 of pressure in general, which is another consideration. Each deck loading needs further calculations according to the technical availabilities.
When SP5 and SP6 are compared, it is seen that carrying pre-assembled towers is an advantage in terms of space use since towers only occupy an area equivalent to their circular cross-section. The area occupied by towers in SP6 is almost twice as it is in SP5 which explains the increase in the trend line to the right hand side of the graph (from SP5 to SP6). Deck load configuration choice is not only dependent on deck space, but also dependent on the vessels onboard crane SWL capacity since it is a complete process called “transportation and installation”. Each offshore turbine component has different weights so that each pre-assembled part has also different weights. The heaviest piece determines the minimum SWL capacity requirement hence not all the vessels are suitable for all T&I methods. Table 10 shows the minimum SWL requirement from the onboard crane of the installation vessel for
0 100 200 300 400 500 600 2 3 4 5 6 7
Deck Configurations Vs. Needed Area for One Turbine on the Deck m2
![Figure 1: Development of the offshore wind industry (EWEA Offshore Report, 2009) Source: [2]](https://thumb-eu.123doks.com/thumbv2/5dokorg/3273581.15570/18.892.110.822.495.912/figure-development-offshore-industry-ewea-offshore-report-source.webp)
![Figure 2: Lillgrund Offshore Wind Park, Farm Layout, Source: [3]](https://thumb-eu.123doks.com/thumbv2/5dokorg/3273581.15570/19.892.110.550.222.613/figure-lillgrund-offshore-wind-park-farm-layout-source.webp)