Degree: Master of Science, 120 credits Supervisor: Prof. Kent Eriksson Program: Financial Services
Department of Real Estate and Construction Management Thesis no. 183
Financial Services 30 credits, Graduate Level
T
HE
I
NTERNATIONALIZATION OF
S
WEDISH
SME
S
- how does internationalization affect individual firm’s capital and credit risk structure?Max Ahlgren Jacob Goldmann
Master of Science thesis
Title: The Internationalization of Swedish SMEs Authors: Max Ahlgren and Jacob Goldmann
Department: Department of Real Estate and Construction Management Master Thesis number: 183
Supervisor: Kent Eriksson
Keywords: SME, internationalization, credit risk, Z-score, Altman, Sweden, capital structure
A
BSTRACTIn this master thesis we examine how the level of internationalization, i.e. a firm’s relative exposure to foreign sales, affects individual SMEs in Sweden. Since it is conducted using a data sample with Swedish SMEs its applicability in other countries may vary. The aspects concerned in which the internationalization affects the firm’s structure is limited to the areas of capital structure, credit risk and the factors affecting credit risk. Altman’s Z-score model is employed to approximate a firm’s credit risk and the debt ratio represents the firm’s capital structure. The purpose of the thesis is to increase the knowledge and provide insights on how internationalization affects SMEs in general and in Sweden in particular. Knowledge on how internationalization affects firms is scarce and by this thesis we have extended the known area of the topic and shed light on this relatively unexplored SME aspect. Our hope is that by highlighting differences (and similarities) in credit risk attributes of high and low internationalized firms SMEs this will improve their financial transparency and ease their attracting and access to external sources of capital. To examine the effects of internationalization on Swedish SMEs we have employed statistical techniques, most importantly regression analysis.
Our study has not only implications for academics, but for all parts that has any interest in efficient credit scoring models and to understand credit risk characteristics and how internationalization affects SMEs. Banks, policy makers and credit rating agencies are constantly pursuing improvements in the efficiency and accuracy of quantifying credit risk by developing credit-scoring models. Banks because they want to minimize credit losses and maximize profitability and policy makers to secure a viable business environment for companies to nurture
economic growth, employment, innovation and the country’s competitiveness. The SME segment has received extra attention lately due to the financing barriers they are facing.
Our results are contradictory to some earlier research in the area and in line with other. This implies that the characteristics and relationship of SMEs credit risk and internationalization changes over time and/or differs between countries, perhaps even between regions within national borders. For example we arrived at the conclusion that our basic model indicates a positive relationship between internationalization and credit risk, in line with both Rugman (2009) and Caves (2007). Our analysis shows no significant difference in the firm’s capital structure depending on the internationalization, although younger companies tended to have a higher level of internationalization. This finding is contradictory to the research conducted by Burgman (2009) and the reports carried out by the European Commission whose report reaches the conclusion that older firms had a higher level of international exposure.
ACKNOWLEDGEMENTS
This Master of Science Thesis has been written by the undersigned parties at the Department of Real Estate and Construction Management at the Royal Institute of Technology in Stockholm, Sweden, during the spring semester of 2012.
We would like to extend our sincerest thankfulness to Ph.D. Sara Jonsson for sharing her data samples generated for her paper “The potential role of referral ties in the evolution of entrepreneurial networks in the startup phase” with us. This academic paper is included in her Doctoral Thesis in Industrial Economics and Management. Without this rich secondary data set our thesis would not have turned out the way it did and the depth of our analysis would not have been.
Furthermore we would like to thank Prof. Mats Wilhelmsson for assisting us in the process of selecting and utilizing statistical analysis tools and methods. In addition we also really appreciated the discussions regarding different possible angles to attack our research problem in order to ensure the reliability of results and conclusions reached in this thesis.
First and foremost we would like to thank our supervisor, Prof. Kent Eriksson, for his constant presence and great source of knowledge when we needed consultancy and help in the writing process of the thesis. Lastly we would like to thank the professor’s assistant Elias Flening for assisting us by compiling and merging the data sets which we utilized in this master thesis.
Stockholm, spring of 2012
TABLE OF CONTENTS
1 Background ... 9
1.1 Introduction... 9
1.2 SMEs and Swedish Growth ... 10
1.3 Important Markets for Swedish SMEs ... 11
1.4 Credit Risk ... 12
1.5 Credit Scoring Models... 12
1.5.1 The Z-score Model ... 13
1.5.2 The Original Z-score Variables ... 13
1.5.3 Criticism Of The Z-score Model ... 14
1.5.4 The Z-score Model For Private Firms ... 15
1.6 Internationalization ... 16
1.7 SMEs Role and Importance for the International and Swedish Economy ... 17
1.8 Internationalization of SMEs in the European Union (EU) ... 17
1.8.1 Overview and Factors Driving the Process of Internationalization ... 18
1.8.2 How Internationalization Affects Business Performance ... 18
1.8.3 ECs Recommendations For an Ongoing Policy Support of SMEs ... 19
1.9 The Definition of an SME ... 19
1.10 Bankruptcy Predictors ... 20
1.11 Justification of Research ... 22
2 Literature Review ... 24
2.1.1 Lower Risk In International SMEs ... 24
2.1.2 Higher Risk In International SMEs ... 24
2.1.3 Lending For International SMEs ... 25
2.1.4 Credit Risks and Internationalization of SMEs ... 25
3 Methodology ... 27
3.2 Purpose... 27
3.2.1 Hypothesis I ... 27
3.2.2 Hypothesis II ... 27
3.2.3 Hypothesis III ... 27
3.2.4 Hypothesis IV ... 28
3.3 Credit Risk – Z-score ... 28
3.4 Internationalization – Exports/Turnover ... 28
3.5 Research Design ... 28
3.5.1 Ordinary Least Square Regression ... 29
3.5.2 Analysis of Variance - Student’s T-test ... 29
3.5.3 Correlation ... 29
3.1 Ethical Considerations ... 29
3.2 Method Discussion ... 29
3.3 Data ... 31
3.3.1 Secondary Data ... 31
3.3.2 Descriptive Sample Statistics ... 31
Our Sample Compared To The S&P Index ... 35
4 Analysis And Results ... 37
4.1.1 Correlation Matrix for Z-score and Internationalization ... 37
4.2 The Significant Variables ... 38
4.2.1 The Basic Model For All Firms ... 39
4.2.2 The Model For Highly International Firms... 40
4.2.3 The Model For Firms With Low Internationalization ... 41
4.2.4 Comparison Between High and Low Internationalized Firms ... 42
5 Discussion And Conclusions ... 44
5.1 Final Discussion ... 44
6 Reference List ... 47
Appendix ... 51
LIST OF FIGURES Figure I. Development of Exports/GDP 2002-2010 ... 11
Figure II. The Original Z-score Model ... 13
Figure III. The Z-score Model for Private Firms ... 15
Figure IV. The Z-Score Private Firm Model. (Altman, 1993) ... 21
Figure V. Sales 2005-2009 ... 32
Figure VI. Number of Employees 2005 - 2009. ... 33
Figure VII. Average Z-scores 2005 – 2009. ... 33
Figure VIII. Average Z-score 2005 categorized by internationalization. ... 34
Figure IX. Industry Distribution. ... 34
LIST OF TABLES Table I. Zones of Discrimination (Original Model). ... 14
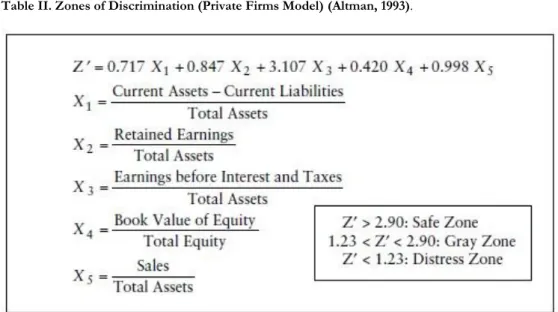
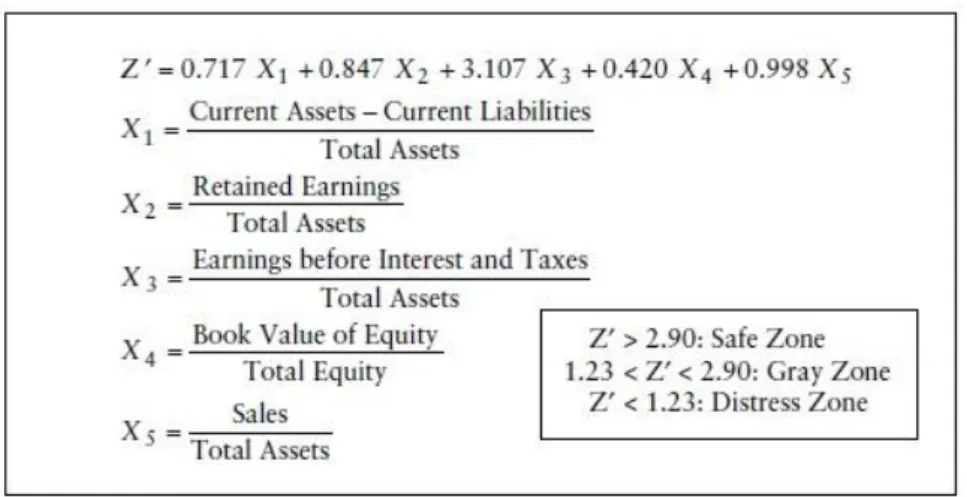
Table II. Zones of Discrimination (Private Firms Model). ... 15
Table III. Definitions of Internationalization. ... 16
Table IV. Recommended SME Definition by the European Commission. ... 19
Table V. Our Sample Sorted In Discrimination Zones. ... 33
Table VI. Mortality Rates by Original Rating ... 35
Table VII. Average Z-Scores by S&P Bond Rating, 1996-2001. ... 36
Table VIII. Estimated S&P ratings on our sample firms ... 36
Table IX. Correlation Matrix for Z-Score and Internationalization ... 38
Table X. The Basic Regression Model ... 39
Table XI. The Model for Firms With Higher Internationalization ... 41
Table XII. The Model for Firms With Lower Internationalization ... 42
Table XIII. T-test – Analysis of Variance... 43
LIST OF FORMULAS
Formula I. Z-Score Bankruptcy Model for Private Firms. ... 28 Formula II. Level of Internationalization. ... 28 Formula III. Regression Equation for the Basic Credit Risk Model ... 39 Formula IV. Regression Equation for the Credit Risk Model for High Internationalized Firms .. 40 Formula V. Regression Equation for the Credit Risk Model for Lower Internationalized Firms . 42
9
1 BACKGROUND
The following chapter will provide the reader with an introduction to SMEs1 and their
fundamental role for nation’s economic growth and activity with the Sweden market as focal point. Since SMEs are fundamental to the economic activity in a country it is (hopefully) in most people’s interest that their special needs, characteristics and peculiar situation is well understood and receives its deserved attention in order to maximize their survival rates (for example by securing their capital access) and success in the international market place.
1.1 INTRODUCTION
Small and medium-sized corporations are the backbone of the Swedish economy; almost 90 % of all new jobs are created in the SME sector. These firms have historically been dependent on bank financing since they cannot raise capital through the capital markets like bigger corporations. The fact that SMEs experience difficulties in achieving and securing it’s financing are well known (Cardone-Riportella, et al., 2011) and because their important role for economies around the world this issue really deserves its attention. The financial crisis caused the bank financing to retract overnight, which of course was problematic for many Swedish SMEs. It is essential for future Swedish growth that this will not happen again and the financing of SMEs is secured. SMEs are financially unstable compared to larger corporations; therefore the risk of a domino effect when SMEs go bankrupt is higher (Yazdanfar, 2011). In this thesis we will evaluate if the internationalization effect can be a future problem for Sweden and its global banks. We chose this subject since internationalization has been proven to have an impact on the credit risk in other economies, for example in Turkey (Arslan & Karan, 2009).
National economies have become more and more internationally interconnected for every year (Figure I) and national markets are today more integrated than 20 years ago. We will in this thesis try to explain how the internationalization and integration between national markets affects Swedish SMEs. The new Basel III regulation does not take the level of internationalization for the companies into account, but the market integration should increase even further when the borrowing firms grow internationally. Since it has been easier and cheaper for corporations to export and import goods the Swedish firms now are more exposed to the development in foreign markets than before. This might become a problem of the future and create risks for banks and the economy; therefore it is important to evaluate this potential problem as soon as possible.
10
Earlier researches on the subject have shown different results depending on the target country of research and the nature of the study. There is no earlier study on this particular subject conducted in Sweden. Both Rugman (2009) and Caves (2007) results points to the direction that an international exposure implies a lower credit risk. In contrast to Burgman (1996) who present results indicating that internationalization increases the agency costs and decreases the transparency - causing a higher credit risk.
Arslan and Karan conducted a study similar to ours in Turkey in 2009, but the Turkish market is substantially different from the Swedish market. Turkey is rather a frontier market (or perhaps an emerging market) compared to the Swedish market, which is mature market. The authors concluded that different variables affected the credit risk depending on the level of individual firm’s level of internationalization. In one way we will conduct a similar study on the Swedish SME market but without a bankruptcy predicting model but rather a comparison between firms with different levels of internationalization.
Readers of this master thesis are assumed to possess basic knowledge in, and be familiar with the basic concepts and statistical tools used within the area of Econometrics in order to assimilate this master thesis in full, especially the method and results chapter.
1.2 SMES AND SWEDISH GROWTH
During the last two decades in Sweden the SMEs2 have played an increasingly important role for
the Swedish economy. For the upcoming years SMEs are estimated to be even more important to the real economy due to the rapid technology development and a growing service sector. (Företagarna, 2012). 20 years ago Sweden had approximately 400,000 private corporations where 98.7% of them had fewer than 50 employees. Up to this date Sweden have 770,000 private companies of which 99.2% are classified as SMEs. In total the SME sector employ over 1.6 million people and Sweden, which translates into roughly 53% of the total Swedish workforce. Of even greater importance is that 9 out of 10 new jobs during the last 20 years were created within the SME sector (Företagarna, 2012). One of the most important barriers for expansion according to the survey on Swedish SMEs is the ability to attract external financing and the burden of paying high interest rates on loans. According to the same report, the situation has become even worse in the aftermath of latest the financial crisis when lending froze (Företagarna, 2012). Furthermore the problems associated with SME financing have grown even larger in the backwater of the budget deficits in southern Europe (Företagarna, 2012). SMEs are to a larger
11
extent dependent on bank credit in opposite to larger corporations where other financing alternatives are available, for example through the issuance of corporate bonds or raising equity on the capital markets. The banks have been hit hard by the PIIGS3 countries and their budget
deficits, and the new Basel rules with increased capital requirements will most certainly not have a positive impact on the availability of bank credits available for the SMEs (Företagarna, 2012).
1.3 IMPORTANT MARKETS FOR SWEDISH SMES
International trade has historically been dominated by larger Swedish corporations, but with the passage of time, more and more SMEs have moved into international operations. Shipping and freight rates have decreased and simultaneously new technology advancements has pushed through. Global trading has become far easier for corporations today compared to 20 years ago, for example companies utilizing the distribution channel of e-commerce can now access the global markets and customers with their products directly in a relatively easy and cheap way. Around 70 - 80% of the international trade is occurring within Europe, with the spatially most approximate countries as the most important, e.g. Germany and Norway (Företagarna, 2011). The Swedish SMEs mainly import goods, approximately 10% of all Swedish SMEs import while in contrast, merely 4.5% export. On the aggregate level approximately 50% (2010) of Sweden’s GDP composed by exports. In an international comparison with, for example, The United States and the World, Sweden is a very open economy. Plots for exports in relation to GDP can be viewed in Figure I below; Turkey is included for comparison due to the similar research conducted by Arslan and Karan (2009).
Figure I. Development of Exports/GDP 2002-2010 4
3 Portugal, Ireland, Italy Greece and Spain. 4 http://data.worldbank.org/
12
The fastest growing economies outside of Europe are getting more and more important by the year. At the moment it looks as if the big portion of future economic growth will be generated in countries outside of Europe and thus it is crucial for Swedish firms to be involved with those geographical areas (Företagarna, 2011) in order to not fall behind. The conventional stepping-stone for firms to extend its business abroad is by starting an international branch through an expansion into countries with a similar corporate climate and market conditions and sub-sequent, step-by-step, get more globally integrated. According to Företagarna’s5 survey this has changed
lately and a common practice nowadays is to start off with imports of goods from countries outside of Europe, for example cheap consumer goods from Asia, which has made a significant mark in Swedish SMEs behavioral pattern (Företagarna, 2011). The most popular markets for international trade outside of Europe are the United States, China and Canada. In contrast only 2% of all the Swedish SMEs was involved in trading relationships with countries in Africa, 2011 (Företagarna, 2011).
1.4 CREDIT RISK
Credit risk is defined by the Basel Committee as the probability that a borrower or counterparty will fail to meet its obligations and the terms which has been agreed upon. The goal for a bank is to maximize the risk-adjusted rate of return; hence managing credit risk is essential for long term profitability and lending. Loans (credits) are the most common credit risk that banks need to manage (Basel Committee on Banking Supervision, 2000). In this thesis credit risk will refer to the risk banks become exposed to when they lend money to companies, in our case SMEs.
1.5 CREDIT SCORING MODELS
The first credit scoring models were developed in the early 1960’s and were primarily based on rule of thumbs on financial metrics. The first credit scoring models were developed and used by practitioners, but the theorists neglected the models. The main reason for the negativity was that different financial metrics were applicable in different situations, leading to a model believed to be correct but which in reality were false. The Z-score model is categorized as a credit-scoring model. This type of models typically contains of a set of quantifiable financial indicators and points are given within different ranges for the variables (Altman & Hotchkiss, 2006). The pros with a credit-scoring model are especially time, money and the easiness of it, but the model may not be fully compatible with different sectors and companies.
13
1.5.1 THE Z-SCORE MODEL
The Z-score model was originally developed by Edward Altman 1968 and was one of the first credit scoring models. The model has been refined during the last four decades and modified coefficients, and models, have been developed for different type of firms. The Z-score model is a linear model with five different variables (can be seen more in detail in Figure II). The development started with a large sample of bankrupt and non-bankrupt firms and the originator tried to find the variables that differed within the sample. The sample period was between 1946 and 1965, a sample period of a whole 20 years. One of the downsides with designing a model after a longer period is the natural fluctuation in the financial metrics (Altman & Hotchkiss, 2006). The model aims to predict the probability of defaulting for a firm within two years’ time. Below you can see the original Z-score model designed in the late 60s primarily for manufacturing companies, at the time being the service sector were compared to the manufacturing sector really small.
Figure II. The Original Z-score Model
1.5.2 THE ORIGINAL Z-SCORE VARIABLES
Working Capital/Total Assets (X1)
This ratio is a measure of the net liquid assets within the company relative to the total assets. Working capital is defined as the difference between current assets and current liabilities (Altman & Hotchkiss, 2006).
Retained Earnings/Total Assets (X2)
This ratio measures the level of money that is reinvested in the company. The variable is depending on the pay-out-ratio of the company and is also sort of an indicator of the financial structure. A relative high RE/TA gives indications that the company primarily is financed through earlier profits. This variable has varied a lot during the last decades depending on the investment level for the companies (ibid).
14
Earnings before Interest and Taxes/Total Assets (X3)
This is measurement of the profitability of a company – how well they use their assets to generate profit for the owners. As can be seen in the formula the ratio is not affected by neither the risk level of the company, nor the capital structure, and nor the tax level. This ratio is also common in other credit scoring models. The fact that the variable is unaffected by the leverage is the main reason (ibid).
Market Value of Equity/Book Value of Liabilities (X4)
Equity is measured as the market capitalization of the stocks, including both preferred and common. The book value of the total liabilities includes both long-term and current obligations for the company. The ratio measures how much the equity can decline before the liabilities exceed the assets and the firm becomes insolvent (ibid).
Sales/Total Assets (X5)
This ratio is a commonly used financial ratio that measures the capital turnover within a company. According to some of the results by Altman the ratio actually should not be included in the model. The main problem, which is put forward, is that the ratio differs a lot depending on, primarily, which type of industry the individual company is active in.
Z-score Zone Likelihood of Bankruptcy (2 years)
> 2.99 Safe Zone Low
1.81 – 2.9 Grey Zone -
< 1.81 Distress Zone High
Table I. Zones of Discrimination (Original Model) (Altman, 1993). 1.5.3 CRITICISM OF THE Z-SCORE MODEL
One big issue with the Z-score model is that the financial ratios can be tweaked with and might therefore not always correspond to their true value. This may be done by the management of the company to convey a more positive external image of the financial situation of the firm for different reasons. The original Altman model was designed a long time ago when the firms primarily were manufacturing firms. Today other sectors have grown substantially, especially the service sector have grown a lot since the development of the model. Consequently the model may be misleading for these types of firms (Hall, 2002). The climate for firms has changed since the development of the model, for example conglomerates were a lot more common before. Even though the model has been widely accepted the model has become less successful in
15
1.5.4 THE Z-SCORE MODEL FOR PRIVATE FIRMS
The model used within our sample is the Z-score model for private firms. It is a modified and improved to specially be accurate on private firms. Since our sample only consisted of unlisted (private) companies we chose to use the specially developed model in our thesis. It was also developed by Altman, but later than the original model, in 1993.
Z-score Zone Likelihood of Bankruptcy (2 years)
> 2.9 Safe Zone Low
1.23 – 2.9 Grey Zone -
< 1.23 Distress Zone High
Table II. Zones of Discrimination (Private Firms Model) (Altman, 1993).
16
1.6 INTERNATIONALIZATION
For the time being there is no consensus in research and theory regarding the definition of the concept internationalization (Bell & Young, 1998), but however there has been several definitions suggested by different authors over the years, although they are all relatively similar.
Author(s) Definition
(Welch & Luostarinen, 1988) The process of increasing involvement in international
markets.
(Johanson & Vahlne, 1990) Internationalization as a cumulative process in which relationships are continually established, developed, maintained and dissolved in order to achieve the firm’s objectives.
(Johanson & Mattsson, 1993) Internationalization is the process of adapting firm’s
operations (strategy, structure, resources etc.) to international environments.
(Welch & Luostarinen, 1993) The process of increasing involvement in international
operations.
(Calof & Beamish, 1995) Internationalization is the process of increasing involvement in international operations
(Ahokangas, 1998) Internationalization is the process of mobilizing,
accumulating and developing resource stock for international activities.
(Lehtinen & Penttinen, 1999) Internationalization as developing networks of business
relationships in other countries through extension penetration and integration.
(Lehtinen & Penttinen, 1999) Internationalization concerns the relationships between the
firm and its international environment, derives its origin from the development and utilization process of the personnel’s cognitive and attitudinal readiness and is concretely
manifested in the process of different international activities, primarily inward, outward and cooperative operations.
(Ruigrok, 2000) Internationalization refers to SMEs outward movement of international operations.
17
1.7 SMES ROLE AND IMPORTANCE FOR THE INTERNATIONAL AND SWEDISH
ECONOMY
“Micro, small and medium-sized enterprises (SMEs) are the engine of the European economy. They are an essential source of jobs, create entrepreneurial spirit and innovation in the EU and are thus crucial for fostering
competitiveness and employment.” - Günter Verheugen
As can be inferred from the quote from the EU commissioner Verheugen, SMEs are of great importance in terms of economy, sociology and technology. In the EU area they represent somewhere around 99% of the total number of companies and employs around 90 million people.
In the year of 2010 the jobs in SMEs represented a share of around 67% of the total employment in the non-financial sector in EU; this translates into approximately 87 million jobs (EIM Business & Policy Research, 2011). Between 2002 and 2010 SME firms grew at a higher rate than LSEs where SME jobs rose by on average 900,000 per annum while LSE jobs only increased by approximately 200,000 jobs annually during the period. This means that SMEs creates more jobs than other classes of companies (ibid). The proceeds of the report is the conclusion that SMEs is of high importance for the economies in EU and that the firms, because of their importance, deserve extra attention and because of their importance qualifies for the policies targeted to improve the business environment for them (ibid).
1.8 INTERNATIONALIZATION OF SMES IN THE EUROPEAN UNION (EU)
The European Commission (EC) carried out a research study in 2009 to create an up-to-date overview of the level, and structure, of internationalization amongst the European SMEs. The purpose of the study being to create a deeper understands of the situation and what conclusions can be inferred. In the study the concept of internationalization is not limited to the company’s levels of exports but also includes other aspects, which connect the individual company with the international playing field – i.e. imports, foreign direct investment (FDI), international subcontracting and international technical co-operation.
Key findings from the report (EIM Business & Policy Research, 2010) are presented below by bullet points. Please note that they are findings, which are generally valid on the European Union level and not necessary on every national level in the individual countries included. These findings are as follows:
18
1.8.1 OVERVIEW AND FACTORS DRIVING THE PROCESS OF INTERNATIONALIZATION
There is a positive relationship between the size of the company and the level of internationalization.
There is a negative relationship between the size of the individual country and the level of its SMEs internationalization.
Perceived barriers for internationalization by SMEs:
o Internal barriers: price of the SMEs product/service offering and the high costs
often related to move into international activities.
o External barriers: lack of funds, information, public support and the
costs/difficulties with paperwork associated with distribution.
There is a positive relationship between the company’s involvement in e-commerce and their international activity. The expansion of Internet has facilitated for firms of all sizes to engage in international activities thus weakened the relationship between internationalization barriers and the size of the firms whereas smaller firms often experience the barriers stronger than larger.
There is almost no relationship between the SMEs proximity to a national border and their level of internationalization.
The most internationalized industries include trade, manufacturing, communication and research.
The level of internationalization of a company increases gradually with its age
The most common start of internationalization is represented by imports of goods and services.
Only 4% of the domestic (non-internationalized) firms plan to engage in international activities.
International partnerships within SMEs are mostly between member countries of the EU with the exception from imports from China and the relationships with the BRIC countries are in general low.
1.8.2 HOW INTERNATIONALIZATION AFFECTS BUSINESS PERFORMANCE
There is a positive relationship between SMEs engagement in international activities and high turnover growth rates.
There is a positive relationship between SMEs involved in international activities and higher employment growth than SMEs not active in international activity
19
More internationalized SMEs experience a higher level of innovation in the sense that they introduce more product/service offerings to their home market than others.
1.8.3 ECS RECOMMENDATIONS FOR AN ONGOING POLICY SUPPORT OF SMES
Public support programs should not only be aimed towards exports (outward internationalization) but also on imports (inward) of resources whereas it is needed for the SMEs to remain competitive and stimulates a broader internationalization.
Since activity in e-commerce related to higher levels of imports and exports, policy makers should have this in mind and form new policies to facilitate the continued growth of e-commerce.
Member states in the EU should cooperate in the collection of market information to overcome the lack of information mentioned by SMEs as an obstacle to internationalization.
Policy makers should support innovation to further increase internationalization since the causal effect between the two might go both ways – i.e. they reinforce each other.
The smallest segment of the SMEs – the micro firms, are the ones that potentially could benefit the most from public support programs but also the ones least aware, lowest user of them. Policy makers should therefore put more effort into improving the access of micro and small firms to public financial support systems.
The awareness of the existence of public support programs need to be increased because it has large effects on SMEs that makes use of them. When the survey was performed less than 10% of all internationalized firms used them.
1.9 THE DEFINITION OF AN SME
The recommended definition of a SME by the European Commission is based upon three attributes of the company; number of employees, turnover and total value of balance sheet. The attributes are expressed in terms of threshold limits where the number of employees must not be exceeded and the turnover and/or the total value of balance sheet not exceeded. The abbreviation represents three different segments of companies – i.e. micro, small and medium-sized.
Enterprise size Number of employees Turnover or Value of balance sheet
Medium-sized < 250 ≤ € 50 million ≤ € 43 million
Small < 50 ≤ € 10 million ≤ € 10 million
Micro < 10 ≤ € 2 million ≤ € 2 million
20
1.10 BANKRUPTCY PREDICTORS
Numerous studies have earlier tried to determine generic bankruptcy predictors for SMEs but those have often led to different and sometimes ambiguous conclusions. An international example is the “classical” Z-score model by Edward I. Altman, which is a credit risk-assessing model with financial data as input and a credit score as output. The model has been widely used through the years and constitutes the basis for further development and the modification by other researchers for different kind of industries and firm sizes. The original Z-score model was created in 1968 and originally to assess corporate loans. The financial ratios used in the Z-score model are a combination of metrics for liquidity, profitability, leverage, coverage and financial activity (Altman & Sabato, 2007).
SMEs differ from large corporations in their ability to react to changes in the macroeconomic environment; smaller companies are by nature more fragile than larger corporations (Altman & Sabato, 2007). In a study from 2004; French SMEs are concluded riskier; but more interesting within a credit portfolio of SMEs the correlation were lower compared to a portfolio of corporate-loans (Michel & Petey, 2002). Altman and Sabato (2007) measured bankruptcy among 2,010 SMEs (companies with sales less than USD 65 millions6) in the US market during the
period 1994 - 2002. 120 of these companies went bankrupt during the period and did therefore constitute the control group for which to compare with the non-bankrupt firms in order to distinguish significant differences between the two groups, so called bankruptcy predictors. The model they came up with had a prediction power that exceeded the standard Z-score model with 30% for the sample in question. Altman and Sabato measured 15 different financial metrics and the results showed that five of them were superior other predictors. The five ratios are as following for private firms:
21 Figure IV. The Z-Score Private Firm Model. (Altman, 1993)
Bankruptcy prediction models for SMEs based in Sweden have not been constructed until recently when researcher Yazdanfar conducted a new, groundbreaking research. Most of the earlier bankruptcy prediction models have been made in larger economies than Sweden’s, for example in France, USA and Germany. Sweden is an open economy which is heavily relying on its export sector where over 50% of GDP stemming from exports, a completely different situation compared to the American economy where companies are more focused on the domestic market on average. The model created by Yazdanfar was based on a sample of 4,496 SMEs, where 1,412 of the companies had become bankrupt. The sample period was 2004-2006 and Yazdanfar used the SCB definition7 of SMEs which differs slightly from the definition used
by Altman and Sabato when they constructed the Z-score model. Furthermore abnormal observations and companies with missing data were excluded from the sample. The aim of the study was to identify a set of financial ratios that differed between bankrupt and non-bankrupt SMEs in Sweden in order to come to conclusions regarding which factors can predict the probability of bankruptcy for individual firms. Yazdanfar claims, as a result of his research, that companies with certain financial characteristics have a higher risk of defaulting (Yazdanfar, 2011). The results showed that six variables were good predictors for bankruptcy in one to three years. The following ratios were determined as the strongest bankruptcy predictors for Swedish SMEs according to Yazdanfar (2011):
Short-term Debt/Total Assets
Total Leverage (short- and long-term debt/total assets)
Change in total assets from previous years
7 Number of employees between 1-200, Revenue >SEK 120 000, Assets >SEK 100 00, unlisted, complete
22
Firm Size (logarithm of sales)
Financial Expenses/Total Debt
Return on Assets
1.11 JUSTIFICATION OF RESEARCH
Creditors, financial regulators and policy makers are already discriminating between large corporations and SMEs in several ways – for example creditors are using different models and measures when assessing the credit risk and policy makers directs efforts to support and ensure SMEs access to capital due to their difficulties and needs. Therefore it is not too unlikely that it might be the case that they also should discriminate between the internationalization levels of firms in the SME segment. If the dynamics of the credit risks in SMEs vary depending on their level of internationalization they should also be looked upon differently. If the factors which affects the credit risk of a firm is different from each other so should also the bases on which they are treated on. For example one variable which is positively correlated with the credit risk of a domestic firm can be negatively correlated to a, in other aspects, similar firm which has a high level of internationalization. If those two entities are treated the same and assessed with the same models without any discrimination because the level of internationalization a lot of insightful information might be overlooked.
Our unique access to qualitative data extracted from surveys performed on Swedish SMEs with corresponding financial (quantitative) data provides us with a unique opportunity to dig deeper into internationalization and credit risk characteristics of SMEs. There has been no previous study akin to ours in Sweden, which positions this master thesis in the absolute front of research in the specific. The most similar research study we have found, glancing on the topic, is Yazdanfar’s recent research paper on bankruptcy predictor selection for Swedish SMEs (Yazdanfar, 2011).
It has been suggested on several occasions in previous research (Becchetti & Sierra, 2003) (Kolarevic & Oja, 2008) that qualitative variables, for example customer concentration, potentially could possess strong explanatory power and be viable to the prediction of bankruptcy in firms. With this said, our expectation is that the richness of our data set will prove to be connected to company’s credit risk in some way and thus enhancing the explanatory power (represented by the variable R-squared) comparing to a model with only quantitative variables as explaining ones. If not this is of course also an interesting finding since it could potentially overturn Becchetti and Sierra’s thesis, at least when applied to the Swedish SME segment.
23
In conclusion the biggest strengths in this thesis is that we provide insights of firm’s level of internationalization in a geographical area where it has not been done before and our substantial sample set with both quantitative and qualitative variables gives us a nice edge.
24
2 LITERATURE REVIEW
Earlier research has arrived at different conclusions regarding how risk variables and capital structure impacts international corporations. In this chapter we will describe earlier research on the subject and how the results differ from each other.
2.1.1 LOWER RISK IN INTERNATIONAL SMES
Both Rugman (2009) and Caves (2007) research indicates that international firms perform better than domestic firms due to the fact that their revenues are more evenly spread out over several markets where the aggregated revenue stream in general is less volatile and less relying on the performance of one specific market. Because the national markets are not fully integrated and correlated with each other, the companies can more easily absorb a downturn on a specific market (Rugman, 2009, p. 896) because the company’s success is less dependent on this one market on aggregate – their operations is diversified. This point to the idea that the business risk is less in international corporations which, combined with less volatile earnings, should make the firms able to manage a higher level of net gearing (Caves, 2007, p. 402).
Gonenc and Arslan’s (2003) studies showed results that are in line with Rugman and Cave’s. They studied publicly listed companies on the Istanbul Stock Market and concluded that international firms have a lower default rate. The authors concluded that the main reason for the lower default rates was a lower volatility and fluctuation in the companies’ cash flows (Arslan & Gonenc, 2003). Though it should be noted that the study only covered the real estate sector and thus one should be careful to extrapolate the results to other sectors and/or in other economies.
2.1.2 HIGHER RISK IN INTERNATIONAL SMES
Burgman (1996) compared multinational corporations (MNCs) with purely domestic companies (DCs) to determine if their capital structures were significantly different from each other. The sample in the study consisted of US companies listed on the New York Stock Exchange (NYSE) and the research was carried out 1987 - 1991. Financial Services companies such as banks and insurance companies were excluded from the analysis. The results showed that MNCs appeared to have a lower target debt ratio compared with DCs (Burgman, 1996). Other studies have shown that MNCs are able to sustain higher debt ratios since they are more diversified with less volatile revenue and earnings streams (Burgman, 1996). The result also indicated that agency costs were greater for the MNCs compared to the DCs. Higher agency costs could be the main explanation for the lower debt ratios of the MNCs according to Burgman (1996).
25
Gao et.al (2008) measured how company valuations were affected by the engagement in international trade and cross-border subsidiaries. This study was conducted on the US market and the sample consisted of impressing 184,000 companies. They concluded that corporations that were active in “many” different regions within the US on average carried a lower valuation than companies that focused on one specific region (Gao, et al., 2008). According to the study the results indicates that increased agency costs is one of the main reasons for the lower valuation (Gao, et al., 2008).
2.1.3 LENDING FOR INTERNATIONAL SMES
Multinational institutions have showed to sustain comparative advantages in transaction lending, and domestic institutions have an advantage within relationship lending (Berger & Udell, 2006). Larger banks are in general better in transaction lending since their risk analysis are more rigid regarding financial records, but on the other hand they lack in the qualitative analysis and face time with debtors. When financial institutions engage in cross-border lending where it by nature is harder to evaluate qualitative data because of cultural difference, language barriers and different regulatory environments (Berger & Udell, 2006).
2.1.4 CREDIT RISKS AND INTERNATIONALIZATION OF SMES
Arslan and Karan (2009) conducted a study on Turkish SMEs and how the internationalization of firms affects their bankruptcy predictors, thus their probability of default. Their sample consisted of 1,166 SMEs, where 1,074 of them were purely domestic. The analysis was based on financial records from the year 2007. 10 out of the 192 international corporations defaulted in 2008 and 87 out of the 1,074 domestic sample went bankrupt. In other words the default rates for international corporations were 5.5% and 8.8% for the domestic SMEs (Arslan & Karan, 2009). The results showed quite surprisingly big differences between the two different types with regards to internationalization. Even though the internationalized firms have far higher average sales, they hold a lower inventory level. The international corporations are also on average more liquid than domestic firms. The most striking result from the research was that predictors for bankruptcy differed between domestic and international corporations. For international firms a high level of inventories in relation to total assets was strongly correlated with the probability of default, mismanagement with the inventory levels when receiving large international orders could be the explanation (Arslan & Karan, 2009). Both the net profit to total assets and net sales to total assets were negatively associated with the likelihood of default, points in the direction that small scale exporters easily can adapt to changing conditions in the international markets (Arslan & Karan, 2009). For domestic firms financial expenses to total assets ratio were found directly
26
related to the probability of an accelerating credit risk. The gross profit margin was negatively related to bankruptcy, but the net profit margin was positively related to the likelihood of default. Resulting in a lower probability of default for domestic companies that focus on their core business and keeping a high and stable gross profit margin (Arslan & Karan, 2009).
27
3 METHODOLOGY
In this chapter we will describe our research problem, the purpose of the thesis and how we will attack the problem. Hypothesis will be formed, which later on will be tested with the statistical tools described in this chapter.
3.1 RESEARCH QUESTIONS
Is the average capital structure of firms different depending on their level of
internationalization?
Does the level of internationalization (international sales / turnover) affect the
credit risk (Z-score) of a company?
Is the average age of firms different depending on their level of
internationalization?
Do companies which are more dependent on their five biggest customers have a
higher implied credit risk?
3.2 PURPOSE
The purpose of this study is to examine if (and how) the level of internationalization of Swedish SMEs affect their capital structure, credit risk and factors affecting their credit risk.
3.2.1 HYPOTHESIS I
H0 The level of internationalization does not affect the Swedish SMEs capital structure on a statistically significant level.
H1 The level of internationalization does affect the Swedish SMEs capital structure on a statistically significant level.
3.2.2 HYPOTHESIS II
H0 The level of internationalization does not affect the Swedish SMEs Z-score (credit risk) on a statistically significant level.
H1 The level of internationalization does affect the Swedish SMEs Z-score (credit risk) on a statistically significant level.
3.2.3 HYPOTHESIS III
H0 Companies with a higher level of internationalization are not older than those with a lower level of internationalization, on average.
H1 Companies with a higher level of internationalization are older than those with a lower level of internationalization, on average.
28
3.2.4 HYPOTHESIS IV
H0 A company’s dependency on their five largest customers (customer dependency) does not differ between firms with different levels of internationalization.
H1 A company’s dependency on their five largest customers (customer dependency) differs between firms with different levels of internationalization.
3.3 CREDIT RISK –Z-SCORE
Altman’s Z-score equation for private firms is one of our two most important and central variables for our research, and together with internationalization it constitutes the very core of our problem. The formula below will be used to calculate our company’s Z-score for 2005 and these figures will be inserted in our statistical analysis.
Formula I. Z-Score Bankruptcy Model for Private Firms. (Altman, 1993)
3.4 INTERNATIONALIZATION –EXPORTS/TURNOVER
The internationalization variable we will use throughout our analysis will be defined as the quota between the individual firm’s exports (sales abroad) and the firm’s total amount of sales (turnover = domestic + non-domestic sales), i.e. the outward internationalization.
Formula II. Level of Internationalization.
3.5 RESEARCH DESIGN
The quantitative research conducted in this master thesis is a mix between exploratory and causal research. We will test causal relationships between internationalization and credit risk and which factors affects credit risk. In that sense the research is also exploratory since our final variables are unknown and we are likely to bump into new insights which might change the direction or way to approach our research problem.
Initially we will employ the built-in “correl” function in STATA, which provides a correlation matrix of our variables. This tool will be used to explore and paint an initial picture of which correlation exists between our variables used. This will provide us and the reader with this information to give an initial insight about how the variables relates to one another, especially internationalization and Z-score. This coefficient measures the strength of the linear relationship between two given variables.
29
3.5.1 ORDINARY LEAST SQUARE REGRESSION
The statistical method employed to analyze our data set is the logistic regression model. We will utilize a software called STATA8, which is a statistical tool used to perform a variety of statistical
analysis. The main motivation behind our choice that we are familiar with it and have used it in previous studies and the fact that it has all the functions we need and is suitable for our line of research.
3.5.2 ANALYSIS OF VARIANCE -STUDENT’S T-TEST
We will perform the statistical tool Student’s t-test on our sub-sample sets “low” and “high” internationalization in order to determine if any averages of interest is significantly different from each other. When the test is performed the null hypothesis that the difference between the two means are equal to zero. If this can be rejected it means that the differences between the means are non-zero and thus the means differ.
3.5.3 CORRELATION
The correlation measures dependence between two variables and its value is ranging between -1 and +1 depending on the relationship between the variables. It is useful to analyses correlation between variables in an early stage in statistical analysis to give the researcher(s) a hint about how the input variables relates to each other of what strength.
3.1 ETHICAL CONSIDERATIONS
The identities of the companies included in the sample data will remain anonymous throughout the whole thesis and also in the appendix where the data is compiled. This has been done to avoid any potential issue for the individual companies.
3.2 METHOD DISCUSSION
Below we have collected our own critical reflections upon our master thesis on areas which we see as potential flaws or threats to the validity of our findings and conclusions.
Potential subjectivism in data sample
Some numbers and figures that is the basis of our analysis and thus results has been reported by the companies themselves, hence the results and conclusions are dependent on the reliability, honesty and authenticity of the data. Even though they have been submitted to us by the Swedish
30
state organ SCB9 they are based on questionnaires sent out to the companies and thus could
potentially be subject to some sort of bias. Here the conventional principle of Garbage in, garbage out (GIGO) which basically means that the quality of your output depends on the quality of your input.
Data is a snapshot from a specific point in time
This study is has been conducted using data snapshots from a specific point in time and it is important to keep in mind that it is most likely that the examined relationships and dynamics change over time. A deeper study on the topic could, for example, incorporate an analysis of how these relationships change over time and what the changes relates to, but that is outside the scope of this study.
The accuracy of the Z-score model
As discussed earlier in this thesis there has been some criticism directed to Altman’s Z-score model regarding its accuracy and applicability. Since the Z-score is one of our two most important and for the thesis most central variables our results are of course very dependent on reliability of the same.
Narrow sample available
Our data represents a specific segment (SME) in a specific geographical area, Stockholm and Uppsala, in the relatively small economy of Sweden which makes it very particular. Therefore anyone reading this should be careful before extrapolating the results and conclusions on other types of firms and/or other geographical areas, especially economies which is significantly different than the Swedish.
Benchmarks from the US market
Benchmark data (e.g. bond ratings, mortality rates etc.) was originally generated for the US market (S&P) and its applicability to the Swedish equivalences is not confirmed.
Risk of variables bias
Mention that other (omitted) variables potentially could have a significant, though we have done our best to review and browse through relevant research on the area to minimize omitting any
31
fundamental variables with a significantly explanatory power. The omitting of important variables out of a regression model, i.e. variables whose coefficient is significantly different from zero, leads to estimators that are biased. This type of bias in a model is called omitted-variable bias (Hill, et al., 2007).
Causal relationships not always obvious
A problem, which we are perfectly aware of, is to without any doubt establish a conclusion in which direction the potential causal effects works, i.e. what variables is explaining which.
3.3 DATA
3.3.1 SECONDARY DATA
In our thesis we have only employed secondary data from earlier research, SCB and the database Affärsdata10. The main motivation and reasoning behind this choice are that the necessary data
were available and it also saved us resources both in terms of time and money. This enabled us to start elaborating with our analysis in a relatively early stage of the thesis writing process and start outlining the thesis and our analyses with a point of departure in the sample data. The larger databases are better on collecting this kind of information since they have the right tools for gathering financial information and therefore the quality should be better, or at a minimum as good as, primary data (Ghauri & Grønhaug, 2010). Furthermore information collected and distributed by the government and the governmental statistical bureau are subject to great scrutiny and should therefore carry a high quality and reliability.
The downside with secondary data is especially that it was originally designed for a different object and research problem; this is a potential problem for the survey in our thesis, although a so called luxury problem because we can simply pick the data which could be useful for our purpose. It is important to bear in mind that the original survey aims to solve a different research question (Ghauri & Grønhaug, 2010).
3.3.2 DESCRIPTIVE SAMPLE STATISTICS
Our initial data sample consisted of 306 Swedish companies with activity in the Stockholm and Uppsala regions in Sweden. The originally generated by researchers from Stockholm School of Economics, Uppsala University and from The Royal Institute of Technology. The data was obtained through a random selection process and was received from Statistics Sweden’s Business
32 0 20000 40000 60000 80000 100000 120000 140000 160000 180000 2005 2006 2007 2008 2009
Sales 2005 - 2009 (SEK 1,000s)
Average MedianRegister (SCBs Företagsregister). Their original sample consisted of 2000 firms, and was later cut down gradually and finally to 306 companies. The reason for this was that only 306 of the companies responded to their final questionnaire. The data set consisted of SMEs, with 6 - 249 employees at the time and at least 10% of their annual sales were generated by customers outside of Sweden, i.e. international sales, during 2005. The data sample consists of both financial data and survey answers from top management within the corporations. This sample was extended and complemented manually with financial data for 2006. This quantitative data was extracted from Affärsdata’s databases, still sticking to the 306 sample firms.
After we had complemented the sample we needed to clean up the sample. All companies that had missing numbers for their export 2005 were deleted from the sample. The export numbers that were obtained from the SCB were in a range; therefore we used the lower number in the range to obtain the approximated internationalization for our companies. This is important to have in mind when we are analyzing our data.
Our final sample consists of 245 Swedish SMEs. As can be seen in the figure above the revenues within the sample varies a lot. As illustrated in Figure V the average sales for 2005 were SEK 139 million and the sales are rising every succeeding year until 2009. After 2009 the average sales declined sharply from 162 million back to the level in the initial year 2005. The median sales vary between SEK 62 - 82 million during our sample period.
33 2,43 2,45 2,55 2,13 2,11 2005 2006 2007 2008 2009 Z-score (2005-2009)
Year
Average Z-score 2005-2009
Figure VI. Number of Employees 2005 - 2009.
As can be seen in Figure VI above the average employees vary between 53 and 56 during the period of 2005 - 2008. There is a drop in the number of employees in 2009, which might be due to the financial crisis, which forced many companies to cut their costs – including their labor costs. Both the number of employees and the average revenue decrease around 10% between 2008 and 2009. The median is severely lower than the average in our sample.
Figure IV shows that the average Z-score have increased 2005 - 2007 and later on decreased after the financial crisis. Remember that the Z-score is measuring how high the credit risk is, hence quantifying how high the probability of a default is in the future. According to the model the average credit risk in firms increased significantly in 2008.
Zone No. of companies Percentage
Safe 70 29%
Grey 138 56%
Distress 37 15%
Table V. Our Sample Sorted In Discrimination Zones. Figure VII. Average Z-scores 2005 – 2009.
34 Manufacturin g 56% Wholesale 29% Service 15% 0% %
Industry Distribution
Figure VIII. Average Z-score 2005 categorized by internationalization.In Figure VIII we grouped our sample into five different categories depending on their internationalization level. The by far biggest group is the one with firms with less than 20% internationalization - this group consists of 124 companies. It is important to have in mind that we used the lower number in the export range that we received from SCB; therefore the sample by is a bit skewed to a lower level. As we can see the highest Z-score, hence lowest probability of defaulting can be found in the group with the highest exposure. On the other hand the group with lowest export exposure is not that far behind.
In Figure IX we sorted in our sample companies to three different broad business sectors. As you can see the biggest industry is manufacturing with 56% of the sample. 15% of our sample companies are operating in the service sector. This implies that the manufacturing companies are over weighted in our sample compared to a cross section of the Swedish small and medium sized corporations. The service sector is rather under weighted - in Sweden the service sector represent
2,51 2,13 2,16 2,41 2,65 <20% 20-40% 40,1-60% 60,1-80% >80% Z-score
Average Z-scores
35
approximately 60 - 70% of the overall contribution to GDP. It is somewhat reasonable that the service sector is underweighted since services by nature are harder to sell/operate across borders.
OUR SAMPLE COMPARED TO THE S&PINDEX
The closest we managed to come to a compare our sample and their Z-score and put it into perspective is the below comparison, and translation, of Z-scores to bond ratings for the S&P. In Table VIII the same categorization has been projected on our sample firms.
We have compared our sample with the rating distribution for the companies in the Standard & Poor index. As you can see in the tables above the distributions are pretty similar. Our sample is clearly overweighed for the CCC rating and underweighted in AAA, A and D. The distribution in our sample and within the S&P Index can be seen in Table VII and VIII. Anyhow the sample distribution clearly shows that one or more companies in our sample should have gone bankrupt according to theory and the associated statistics. If the mortality rates in Table VI are applied to our sample we can conclude that the sample is clearly underrepresented in low ratings.
Table VI. Mortality Rates by Original Rating: All Rated Corporate Bonds, 1971 - 2004 (Altman & Fanjul, 2004). In Table VII below statistics are presented for S&P companies and its’ Z-score depending on the bond ratings for the years 1996 - 2001. The data was compiled by Altman and Hotchkiss where the data was extracted from Compustat11 data tapes. Although we believe that the Z-score model
used to calculate the average scores is Altman’s original model (and not the one for private firms which we used), it is as good as it gets when it comes to approximate the creditworthiness (rating) of our sample companies. It should also be noted that the S&P companies are a lot bigger and do
36
not fit under the term SME. Nonetheless we are including this comparison to put the Z-score into some perspective and give the reader a chance to get a feel for where on the more conventionally used credit rating scale the Z-scores qualifies on average.
Rating Number of firms % of total Average Z-score SD
AAA 66 2.6% 6.2 2.06 AA 194 7.8% 4.73 2.36 A 519 20.8% 3.74 2.29 BBB 530 21.3% 2.81 1.48 BB 538 21.6% 2.38 1.85 B 390 15.7% 1.8 1.91 CCC 10 0.4% 0.33 1.16 D 244 9.8% -0.2 N/A
Table VII. Average Z-Scores by S&P Bond Rating, 1996-2001 (Altman & Hotchkiss, 2006).
Estimated Rating Number of firms % of total
AAA 2 0.8% AA 19 7.7% A 41 16.7% BBB 43 17.5% BB 43 17.5% B 48 19.5% CCC 41 16.7% D 9 3.7%
37
4 ANALYSIS AND RESULTS
In this chapter we will explain and present our results and findings related to how internationalization affects firms and how those with higher differs from those with lower levels of internationalization. The statistical models constructed have been constructed in line with previous research, which has given us indications and inspiration to what variables to include, i.e. those who are thought to be, or proved to be, important to credit risk aspects.
In our regressions we have followed the guidelines by Harris (1985). He suggests that a multivariable regression should contain observations ten times the amount of variables. Our model contained 24 variables and a sample of 245 observations, which according to Harris thus should be legit. This rule of thumb can according to Harris offset many of the problems that otherwise might occur in the analysis.
Initially we included a total of 20 quantitative variables and additionally four qualitative variables from the questionnaire as our explaining variables. We extracted the variables from earlier literature which has covered similar areas as that of our research. From the research by Altman and Sabato (2007) we used five variables and from Yazdanfar (2011) we used his final six significant variables for predicting bankruptcy amongst Swedish SMEs. To these eleven bankruptcy predicting variables we added the rest of them from Arslan and Gonenc (2009) and also “our own” internationalization variable. Arslan and Gonenc (2009) measured how Turkish SMEs were affected by their internationalization level which made it seem natural for us to use this as well. Unfortunately none of the qualitative data were significant for the Z-score, which was quite surprising since several has indicated that this might be useful for assessing credit risk and predicting bankruptcy (Altman & Hotchkiss, 2006). Our results will be presented more in detail in the upcoming sector in tables.
4.1.1 CORRELATION MATRIX FOR Z-SCORE AND INTERNATIONALIZATION
The correlation matrix below does not necessarily prove anything, but it gives an initial hint about the relation between the variables which can be interesting. The correlation between the variables Z-score and Internationalization is -0.20 which means that there is a negative relationship between the two variables, i.e. the higher level of internationalization, the lower the Z-score and vice versa. The correlation between the internationalization and the other significant variables are pretty interesting. All variables that earlier were concluded as positive for the Z-score except the capital structure have a negative correlation with the internationalization. The basic model contained one negative variable, the Earnings/Net Sales, and this variable is the only variable with a positive correlation with the internationalization. It should though be noted that
38
the correlations may, or may not, imply a causal relationship between the variables and if it does the cause for the relationship might be indirect or even unknown. Therefore it should merely be viewed as an initial indication about the structure of the variables later tested in the model.
Correlation
Z-Score
Internationalization
Z-Score 1.00 -0.2010
Internationalization (%) -0.2010 1.00
EBITDA/Total Assets 0.6304 -0.1016
Debt/Total Assets -0.1062 -0.0856
Change in Total Assets 04-05 -0.0916 -0.0010 Return on Assets (05) 0.6345 -0.0206 Trade Credits/Total Assets 0.4766 -0.2185
Earnings/Net Sales -0.0137 0.2547
Logarithm(Sales/Total Assets) 0.6154 -0.5052
Revenue/Employee 0.3788 -0.0299
Table IX. Correlation Matrix for Z-Score and Internationalization
4.2 THE SIGNIFICANT VARIABLES
Internationalization
This variable is a measurement of how much of the company’s sales is generated from business outside of Sweden, i.e. international sales.
Earnings before Interest Depreciation and Amortization/Total Assets – a
measurement between the total assets and the profitability of the company before taking the financial structure into account.
Debt/Total Assets
The ratio between the debt of the company and the total assets (debt + equity) whereas a higher ratio, ceteris implies a higher financial risk and represents the firm’s capital
structure.
Change in Total Assets 04/05 (%)
This is a measurement of how the assets in the company have changed since the year before; this is somewhat a measurement of the reinvestment rate in the company.
Return on Assets
This is a measurement of the profitability in the company or in other words how efficiently it utilizes its assets to generate profit.
Trade Credits/Total Assets
Earnings/Net Sales