GRO:NT
FFI
Project Manager: Michael L SenaFinal Report
Ver. 0.4 Date 2011-12-31GRO:NT
Grön Rutt Optimering och Navigering
för Tunga fordon
Green Route Optimisation and Navigation
for Heavy Trucks
GRO:NT
FFI
Project Manager: Michael L SenaFinal Report
Ver. 0.4 Date 2011-12-31Vinnova diarienummer: 2010-01340
Projekttitel: Energieffektiv Navigation för tung trafik
Bidragsmottagarens namn: 556084-0976 Scania CV Aktiebolag
Projektets startdatum – slutdatum: 2010-12-01 – 2011-09-30
Report Authors
Executive Summary Project Team
Introduction Michael L . Sena
User and Usage Requirements Magnus Hjälmdahl
Data Per-Olof Svensk
Route Calculation and Optimization Kees Wevers
System Architecture Anders Johansson
Business Models Michael L. Sena
Fuel Optimization Per-Olof Svensk
Conclusions and Recommendations Project Team
GRO:NT
FFI
Project Manager: Michael L SenaFinal Report
Ver. 0.4 Date 2011-12-31Table of Contents
Table of Contents ... 3 Distribution ... 7 Document History ... 7 Definitions ... 7 1 Executive Summary ... 8 1.1 Objective of Analysis ... 81.2 Methodology and Structure ... 8
1.3 Background ... 9 1.4 Future Work ... 10 1.5 Acknowledgements ... 11 2 Introduction ... 12 2.1 Purpose of Project ... 12 2.2 Participants ... 12
2.2.1 Project Team Members ... 12
2.2.2 Project Team Member Tasks... 12
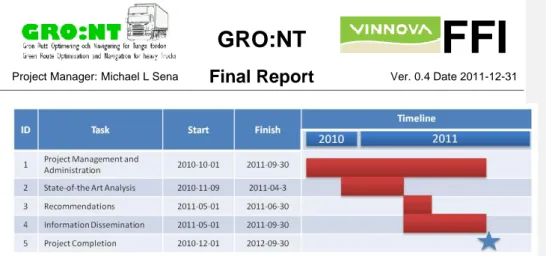
2.3 Funding and Timetable... 13
2.3.1 Budget ... 13
2.3.2 Project Schedule ... 13
2.4 The Nature and Operations of the Large Vehicles ... 14
2.5 Heavy Vehicle Navigation ... 19
2.5.1 Trucking Logistics Terminology ... 19
2.5.2 Security... 22
2.5.3 Logistics ... 24
2.5.4 Operations ... 25
2.5.5 Compliance ... 26
3 User and Usage Requirements ... 28
3.1 Introduction ... 28
3.1.1 Objectives ... 28
3.1.2 Scope and delimitations ... 28
3.2 Method ... 29
3.2.1 Databases used ... 29
3.2.2 Keywords ... 30
3.3 Users and stakeholders of a navigation system for heavy vehicles ... 31
3.4 Identification of User Requirements ... 32
3.4.1 Drivers ... 33
3.4.2 Fleet owners ... 34
3.4.3 Authorities ... 37
3.4.4 Data providers, Truck manufacturers, System providers ... 37
3.4.5 Discussion ... 37
4 Data ... 39
4.1 Introduction ... 39
4.1.1 Data as part of the state-of-the-art study... 39
4.1.2 Prerequisite and background ... 39
4.1.3 Objectives ... 39
4.1.4 Scope and delimitations ... 40
4.2 Useful data ... 40
4.2.1 Overview ... 40
4.2.2 Data for transport planning ... 41
4.2.3 Data for determining allowable routes for LGV ... 41
GRO:NT
FFI
Project Manager: Michael L SenaFinal Report
Ver. 0.4 Date 2011-12-314.2.5 Data for navigation instructions ... 46
4.2.6 Needed quality on data ... 46
4.2.7 Comments on useful data ... 47
4.3 Available data ... 47
4.3.1 NAVTEQ ... 48
4.3.2 Trafikverket, Sweden ... 48
4.3.3 RDT ... 50
4.3.4 Other sources for static data ... 53
4.3.5 Other sources for dynamic data including real time probe data ... 55
4.3.6 Historical probe data ... 57
4.3.7 Summary of available data ... 57
4.4 Currently used data ... 58
4.4.1 Navigation system suppliers ... 58
4.4.2 Summary of currently used data ... 62
4.5 Usability of data ... 63
4.5.1 Mapping useful data towards available data and currently used data ... 63
4.5.2 Available but not used data ... 68
4.5.3 Missing data ... 68
4.5.4 Creation of new attributes and possible enhancements ... 68
4.6 Data provision chain ... 69
4.6.1 Overview ... 69
4.6.2 Services, Interfaces and Standards ... 69
4.7 Conclusions regarding data ... 73
4.7.1 Data for route optimization ... 73
4.7.2 Data describing transfer terminals ... 74
4.7.3 Data for logistics – planning and operating a fleet ... 74
4.7.4 What could be achieved with data available today ... 74
4.7.5 Expected development next 5-10 years ... 74
4.7.6 Expected development in the next 5-10 years ... 75
4.7.7 Possible action items ... 76
5 Route Calculation and Optimization ... 78
5.1 Introduction ... 78
5.1.1 State of the art study ... 78
5.1.2 Topics of study of the subgroup ... 78
5.1.3 Scope of the document ... 79
5.2 Vehicle navigation ... 79
5.2.1 History ... 79
5.2.2 Functionality ... 79
5.2.3 Components ... 80
5.2.4 Digital map ... 80
5.2.5 Exchange format and physical storage format ... 81
5.3 Route calculation ... 81
5.3.1 Route calculation: a single-source shortest path problem ... 82
5.3.2 Dijksta's algorithm ... 83
5.3.3 A* algorithm ... 84
5.3.4 Example of a simple A* implementation ... 86
5.3.5 Cost function ... 86
5.3.6 Bidirectional search ... 89
5.3.7 Restrictions ... 89
5.3.8 Dynamic information: traffic ... 90
5.3.9 Historic traffic information ... 91
5.3.10 NAVTEQ Traffic Patterns ... 92
5.3.11 Predictive traffic ... 92
5.3.12 Link transition cost ... 93
5.4 Vehicle fuel consumption ... 93
GRO:NT
FFI
Project Manager: Michael L SenaFinal Report
Ver. 0.4 Date 2011-12-315.5.1 Eco-driving and eco-routing ... 97
5.5.2 Minimal fuel routing ... 98
5.5.3 Base fuel cost component ... 99
5.5.4 Gradient fuel cost component ... 100
5.5.5 Fuel cost component related to variations in speed (braking fuel cost) ... 102
5.5.6 Discussion ... 103
5.6 The EcoMove project ... 103
5.6.1 Description and goals of the EcoMove project ... 103
5.6.2 EcoMove components ... 105
5.6.3 Ecomove research questions ... 106
5.6.4 Discussion on the 20 % reduction goal ... 106
5.6.5 Elements of EcoMove particularly relevant for GRO:NT ... 107
5.7 System Availability ... 110
5.7.1 Introduction ... 110
5.7.2 Truck routing applications ... 110
5.7.3 Eco-routing applications ... 111
5.7.4 Eco-predictive cruise control for trucks ... 111
5.7.5 Conclusion ... 112
5.8 Evaluation, discussion and general conclusion ... 112
5.8.1 Topics of study revisited ... 112
5.8.2 General conclusion and further work ... 114
5.9 References ... 114
6 System Architecture... 116
6.1 Objectives ... 116
6.2 Surrounding systems and current initiatives ... 116
6.2.1 Systems optimizing transport operations ... 116
6.2.2 Communication channels ... 122
6.2.3 Communication and computing platforms ... 125
6.3 Recommendation/Comments ... 127
6.3.1 On-board vs off-board route calculation ... 128
6.3.2 Important aspects to consider... 131
6.3.3 Relation to Transport Management Systems ... 133
6.3.4 Interaction with vehicle systems (ADAS etc.) ... 134
6.3.5 Communication channels ... 134
6.3.6 Wireless communications and computing platforms ... 135
6.4 References ... 135
7 Business Models ... 136
7.1 The Nature of Business Models ... 136
7.2 Roles ... 140
7.2.1 Navigation Systems and Services Eco-System ... 140
7.2.2 Data Providers ... 144
7.2.3 Navigation Map Engine Suppliers ... 147
7.2.4 End Users ... 150
7.2.5 User generated content ... 151
7.2.6 Demand for information ... 152
7.3 Updates ... 153
7.4 Payment Models ... 153
7.4.1 Who Pays Whom ... 153
7.4.2 Original Equipment – Embedded Navigation... 154
7.5 Market Size ... 161
7.5.1 Vehicle Sales ... 161
7.5.2 Navigation System Sales ... 163
7.5.3 Truck Navigation ... 166
7.5.4 Fleet Management ... 167
GRO:NT
FFI
Project Manager: Michael L SenaFinal Report
Ver. 0.4 Date 2011-12-318.1 Objective of the comparison ... 170
8.2 Description of the simulation ... 170
8.2.1 Test environment ... 170
8.2.2 Model for fuel optimization... 170
8.2.3 Chosen routes ... 171
8.3 Results ... 171
8.3.1 Statistics ... 171
8.3.2 Examples ... 173
8.4 Conclusions ... 180
9 Conclusions and Recommendations ... 182
9.1 Requirements ... 182 9.2 Data ... 182 9.3 Route optimization ... 182 9.4 System Architecture ... 183 9.5 Business models ... 183 10 Appendices ... 184
10.1 Annex 1 - Truck routing applications on the market ... 184
10.1.1 ALK ... 184 10.1.2 BECKER ... 184 10.1.3 Falk... 185 10.1.4 Garmin ... 186 10.1.5 Masternaut ... 186 10.1.6 NAVIGON ... 186
10.1.7 NavGear (distributed by Pearl) ... 187
10.1.8 PTV ... 188
10.1.9 Rand McNally (only US and Canada) ... 188
10.1.10 Snooper ... 189
10.1.11 TeleType ... 190
10.1.12 TomTom ... 191
10.2 Annex 2 - Eco-routing applications on the market ... 193
10.2.1 Bosch ... 193
10.2.2 Fiat ... 193
10.2.3 Garmin ... 194
10.2.4 Hyundai ... 195
10.2.5 TomTom ... 197
10.3 Annex 3 - Eco-predictive cruise control for trucks on the market ... 198
GRO:NT
FFI
Project Manager: Michael L SenaFinal Report
Ver. 0.4 Date 2011-12-31Distribution
Receiver Date Version
GRO:NT Project Team FFI- Secretariat
Document History
Version Date Responsible Comments
0.1 2011-08-01 MLSena
0.2 2011-11-16 MLSena Integration of User Requirements and
Route Optimisation
0.3 2011-12-11 MLSena Edits
0.4 2011-12-31 MLSena Inclusion of Fuel Optimization chapter and
general edits
Definitions
Acronym Description
IVSS Intelligent Vehicle Safety Systems ADAS Advanced Driving Assistance System
ADAS rp Advanced Driving Assistance System Research Platform DMO Digital Mapping Organization
GDF Geographic Database Format LAT Look-a-side Attribute Table DNDC Internal NAVTEQ database format CPM Customer Program Management PM Product Management IS Information Systems DDT Digital Data Team POI Point Of Interest TPD Third Party Data GWS Geographic Work Station
DGPS Differential Geographic Position System QA Quality assurance
SIF Standard Information Format P&RP Product & Release Planning
GRO:NT
FFI
Project Manager: Michael L SenaFinal Report
Ver. 0.4 Date 2011-12-311
Executive Summary
1.1
Objective of Analysis
The Swedish program for strategic automotive research (FFI) financed a one-year study of energy efficient navigation for heavy vehicles beginning October 2010. Scania is the leading party in the project with participation by Navteq, Triona AB, Michael L Sena Consulting AB, the Swedish Transport Administration and the Swedish National Road and Transport Research Institute (VTI).
The project has investigated the issues that can lead to the delivery of energy efficient navigation for heavy vehicles1. A state-of-the-art study has been made analyzing data and usage issues, route optimization algorithms, the actors and business cases required for the accurate and timely data delivery to heavy vehicles. Concrete recommendations are presented concerning which are intended to serve as a foundation for an eventual full implementation of energy efficient navigation for heavy vehicles.
Goals of Project
Increase road safety
•
Fewer truck-related accidents and deaths Stimulate economic growth•
Reduced fuel usage•
More effective routing Encourage technology development•
Advanced systems for truck safety and performance improvements1.2
Methodology and Structure
The objective of the project is to build a substantial base of knowledge regarding energy efficient navigation for heavy vehicles. This will pave the way for truck manufacturers to offer integrated navigation solutions and for
1 Officially in the EU called LGV for Large Goods Vehicles. LGVs are classified by the European Union as motor vehicles (i.e. trucks/lorries) with a maximum allowed mass (MAM) or gross
combination mass (GCM) of over 3,5 tonnes. There are two sub-categories: N2 – vehicles up to and including 12 tonnes; and, N3 – vehicles over 12 tonnes.
GRO:NT
FFI
Project Manager: Michael L SenaFinal Report
Ver. 0.4 Date 2011-12-31fleet operators in include navigation and route optimization adequately suited for heavy vehicles in their offerings. To reach the overall objective, the project has addressed the following:
Identify and clarify the requirements on the functionality and the interaction between different actors and roles in the data supply chain and the current payment flows.
Analyze current navigation and route optimization algorithms, determine what is required for adapting these to heavy vehicle route planning, and provide suggestions for improved algorithms for navigation which are specifically designed for heavy vehicles.
Make it possible to take advantage of data and platforms that are already available. Today this is done in a very limited way.
A new generation of navigation systems designed for heavy vehicles is expected to reduce the negative effects on the environment while improving the safety and economy for fleet owners and drivers. To ensure the commercial interest of large operators, a global perspective is set. At the same time, opportunities are identified where data and solutions from local actors can be utilized.
1.3
Background
The European transportation sector must improve the energy efficiency of its vehicles in order to achieve the EU Commission's goal of a 27% energy saving by the sector prior to 2020. There are a number of areas that need to be improved in order to provide owners and drivers of heavy trucks, buses and other equipment the best possible support for energy efficient navigation, including the provision of specific road data attributes that are necessary for route planning, the development of route optimization algorithms tailored to heavy vehicles, and the design of business models that offer measurable returns to all involved parties. Currently, drivers of heavy vehicles are often using navigation systems designed for private cars. These systems and the data they contain are not specifically designed for the weight, height, width or turning radii of heavy vehicles, and
GRO:NT
FFI
Project Manager: Michael L SenaFinal Report
Ver. 0.4 Date 2011-12-31their use is leading to heavy vehicles following inappropriate, unsafe and inefficient routes.
To date, relatively few navigation systems have been developed for heavy vehicles, and those that are available do not incorporate all the data and functionality to minimize emissions, reduce fuel consumption and restrict effects of heavy vehicles on environmentally sensitive areas. In order to guide the eventual efforts of a full-scale implementation of route optimization and navigation for heavy vehicles, it is essential that the fundamental conditions are clarified and presented in an understandable manner.
1.4
Future Work
The results show that optimization for fuel definitely is possible. However, for a commercial product, a model is needed which combines optimization for:
Lowest amount of fuel usage
Fastest route
The use of major roads
How to weight these factors against each other will be a task for each navigation provider. A suggested solution that would be more flexible would be to allow the user to do the weighting as shown in the HMI example below. Least fuel Fastest route Major roads
Max Max Max
GRO:NT
FFI
Project Manager: Michael L SenaFinal Report
Ver. 0.4 Date 2011-12-311.5
Acknowledgements
The FFI-Programme has provided an opportunity and a framework for Swedish companies and research institutions involved in the intelligent transport arena to cooperate on finding solutions to complex problems affecting their industry which will improve their own competitiveness and society in general. The requirement that participating private companies finance 50% of their costs has helped ensure that only those companies who are serious about collaboration and open to sharing their knowledge on common ground with both partners and competitors take part in the programme. The structure provided by the FFI-Programme and the assistance of the Secretariat have been invaluable throughout the entire project.
GRO:NT
FFI
Project Manager: Michael L SenaFinal Report
Ver. 0.4 Date 2011-12-312
Introduction
2.1
Purpose of Project
The principal aim of the project is to analyse the preconditions for implementing solutions that optimise energy efficient route planning for heavy vehicles while at the same time accomplishing the following:
Clarify the relationships between the different participants in the entire eco-system, including data assembly, data delivery and payment processes.
Prepare recommendations on how Green Routing for heavy vehicles can be implemented in Sweden, Europe and globally.
2.2
Participants
2.2.1 Project Team Members
Scania CV AB – Södertälje, Sweden
Trafikverket – Borlänge, Sweden
VTI – Linköping, Sweden
Triona AB – Borlänge, Sweden
Michael L. Sena Consulting AB – Åsa, Sweden
Navigation Technologies Sweden AB – Stockholm, Sweden
2.2.2 Project Team Member Tasks
The project team is made up of members who were part of the IVSS-funded SOLVI Project2 with the addition of VTI. Each team member brings to the pre-study a specific set of knowledge in vehicle systems, navigation and routing, navigable databases and dynamic data. VTI adds the important component of user requirements and its experience from the HeavyRoute project.
2 SOLVI – Safe Operation for Large Vehicles Initiative; IVSS-funded project; completed September 2009.
GRO:NT
FFI
Project Manager: Michael L SenaFinal Report
Ver. 0.4 Date 2011-12-31Scania is the lead company in the project and has been responsible for the
System Architecture state-of-the-art review.
Navteq has been responsible for leading the investigation of route
optimization and routing algorithms as well as contributing its extensive knowledge in he area of navigable data bases.
Trafikverket has focused on the collection, processing and quality
assurance of road information for safety and performance improvements in heavy truck operations.
Triona has served as the lead for data analysis.
Michael L. Sena Consulting AB has been responsible business model
analysis and for project management.
VTI has been responsible for user and usage requirements, and brings
extensive knowledge of evaluation criteria.
2.3
Funding and Timetable
2.3.1 Budget
4 674 750 MSEK (€4.5 million)
Project funding is provided through the Intelligent Vinnova FFI-Programme. Project team members receive 50% funding from Vinnova, and contribute the remaining 50% themselves. A partner agreement among all project team members defines the commercialisation and intellectual property rights of the participating parties.
2.3.2 Project Schedule
GRO:NT
FFI
Project Manager: Michael L SenaFinal Report
Ver. 0.4 Date 2011-12-31Figure 2.1:GRO:NT Project Timetable
2.4
The Nature and Operations of the Large Vehicles
A legitimate question that could be asked is why should time and resources be devoted to improving the performance of a road-based freight hauling alternative when carbon monoxide emissions for trucks (105 grams per ton of transport per kilometer) are three times greater than for rail (35 g/tkm), and over five times greater than for shipping (18 g/tkm). The answer lies in the current statistics of freight movement. Eurostat, in its Energy, transport and environment indicators, 2009 edition, quantifies the amount of freight shipped by road, rail and water, comparing figures for 2000 and 2008. In the EU27, the amount shipped by road during this eight-year period increased by 2.7% to 76.4%.
Table 2.1: Modal split of inland freight transport in percent of total inland tonne-kilometers (tkm)
GRO:NT
FFI
Project Manager: Michael L SenaFinal Report
Ver. 0.4 Date 2011-12-31The heavy reliance of freight shipments on road transport occurred gradually over the period from 1950 to 1985, and then accelerated dramatically after that. Part of the reason for the increase was the completion of new motorways in many European countries allowing fast city-to-city travel. Another reason which has gained in importance during the past twenty years in Europe is a phenomenon that began in the US with the founding of Walmart (known as Wal-Mart until 2008 when the official name was changed to Walmart).
Sam Walton founded Wal-Mart in 1962 in Bentonville, Arkansas. Mr. Walton himself delivered all the goods to his first handful of stores in his
GRO:NT
FFI
Project Manager: Michael L SenaFinal Report
Ver. 0.4 Date 2011-12-31station wagon.3 His warehouse was his garage. At the time of his death on April 5, 1992, he was the second richest person in the world, after Bill Gates. In 1997, Wal-Mart became the largest employer in the US with 680,000 “associates” (everyone in the company, up to and including the CEO, is referred to as an associate by the company, rather than an employee). In 2002, Wal-Mart topped the Fortune 500 List as the largest company in the world in terms of sales, $218 billion. In 2004, sales rose to $287 billion and the number of employees worldwide had grown to 1.5 million at more than 3,600 stores in the U.S., and more than 1,500 stores in Mexico, Puerto Rico, Canada, Argentina, Brazil, China, South Korea, Germany4 and Britain. By 2009-10, the number of employees had risen to 1.4 million in the U.S. with 4,300 stores.
Walmart’s success in attracting so many customers is based in large part on always delivering the lowest prices on all the goods it sells—not just on certain goods, or not just during special sales promotions, but always. They have perfected the art and science of penny-pinching, primarily by paying low wages to their staff, all of whom are non-unionized, and by squeezing their suppliers for lower prices and more donated labor. Because of their size, they can negotiate huge volume purchases, which drives down the prices they will accept from their suppliers to rock bottom. This, in turn, results in suppliers being forced to reduce their own costs of production. Fully 80% of the goods sold in Walmart stores now originate in low-cost countries, mostly China.
The company has its own private fleet of 7,100 trucks and employs 8,000 of its own drivers5. This puts Walmart Logistics in a league just below truckload carriers Swift, Schneider and J.B. Hunt. The Walmart fleet carries all goods to its Walmart and Sam’s Club stores, and, whenever possible, leverages its fleet by backhauling inventory from manufacturers’ locations. This reduces the amount of contract shipping that is required, saving shipping costs. In fact, the suppliers pay Walmart a fee for the
3 In the UK, this type of vehicle is called an ”estate car”.
4 In the summer of 2006, Wal-Mart sold its eighty-five stores in Germany and left the market, taking a one billion charge against its earnings. The reason: its local competitors, especially Metro, were better at the Wal-Marting game than Wal-Mart.
GRO:NT
FFI
Project Manager: Michael L SenaFinal Report
Ver. 0.4 Date 2011-12-31service. The company reportedly saved close to $1 billion in freight costs in 2004 by backhauling inventory.
Source: Image downloaded from Walmart site describing energy-efficient trucks
Goods are moved first from ports or producers’ shipping points to one of Walmart’s 173 worldwide distribution centers. In the U.S, Walmart has around forty general merchandise distribution centers that support stores within a 130-mile radius. There are another forty-or-so distribution centers for groceries that are within a 156-mile radius of the stores they service. There are twenty more centers for Sam’s Clubs, seven for fashion, two for tires and one for e-retail fulfillment.
Rather than functioning primarily as storage facilities, as the traditional warehouse, there are cross-docking facilities at the distribution centers where goods are moved from supplier trucks to Walmart trucks in the shortest possible time. Fifty percent of goods are cross-docked from delivery truck to a waiting distribution truck in less than twenty-four hours. The goal is to make just-in-time deliveries of exactly the right combination of goods to each individual store. And when the goods get to the stores, they are placed on shelves, not in storage.6 The entire idea is to eliminate storage space, which is purely a cost for Walmart, and to get goods into shopping carts and out the doors as fast as possible. High volume stores can have multiple deliveries and many shelf re-stockings per day. Warehouse space has moved from a fixed facility to moving vehicles: large tractor trailers; shelf-stacking carts; customers’ shopping carts; and customers’ vehicles.
What is most interesting about the Walmart logistics solution is that it was the daughter of necessity. The key to the company’s original success was
6 Some stores have evolved into warehouse shopping facilities with a minimum of frills and no service, and with goods piled up on pallets for picking by the customers. High shelves in the same space where he customer is shopping are packed with goods that would normally be in a storage facility out of the customers sight.
GRO:NT
FFI
Project Manager: Michael L SenaFinal Report
Ver. 0.4 Date 2011-12-31that it located its facilities in poor, rural areas, starting in Arkansas.7 Poor people shopped in their stores because they did not have much choice. Because Walmart’s facilities were not on high traffic routes, Walmart initially had trouble getting its suppliers to deliver to its stores. This was the principal reason for the distribution centers, to provide more convenient locations for suppliers to drop off their goods. To get the goods to the stores from the distribution center, Walmart was, in essence, forced to operate its own fleet of trucks. Once it owned the trucks, it could decide how to use them, and this is where the just-in-time delivery method and backhauling came into existence.
Walmart’s logistics ingenuity has been copied worldwide with the result that larger trucks and moving around in smaller spaces on our roads. Shipping by truck is preferred because it is, overall, the cheapest, most convenient, most flexible and most effective means for moving goods in a Walmarted world. Although environmentalists would prefer that a greater percentage of total freight could, and should, be moved on rails and water8, it simply is not as practical as it was fifty years ago. There is nothing on the horizon that is going to change that fact, barring a catastrophic event of an unthinkable proportion, like the total and immediate lack of available fuel.
There are even serious calls for longer and heavier trucks on the basis that it is more energy-efficient for one tractor to pull two or more trailers than the same tractor to pull just one trailer. Volvo Trucks and Scania, two Swedish truck manufacturers and among largest in world-wide sales of large trucks, have proposed that all European countries adopt the 24 meter standard length of truck allowed in Sweden and Finland, and drop the 18 meter maximum length restriction in force today in the other European countries. Their reasoning is that it will reduce traffic, in spite of how counter-intuitive it sounds. They argue that it will reduce the total number of trucks by one-third, but it will also increase the total length of each truck by 25%. And
7 Arkansas ranks 49th out of 50 in Median Household Income: 1999-2001; 1st in Persons Below Poverty Line: 2000-2002; and 46th in Average Annual Pay: 2002. U.S. Census Bureau, Statistical Abstract of the United States (2004).
8 Carbon monoxide emissions for trucks (105 grams per ton of transport per kilometer) are three times greater than for rail (35 g/tkm), and over five times greater than for shipping (18 g/tkm).
GRO:NT
FFI
Project Manager: Michael L SenaFinal Report
Ver. 0.4 Date 2011-12-31road freight traffic will continue to grow, so that there will eventually be more and bigger trucks competing for space.
2.5
Heavy Vehicle Navigation
2.5.1 Trucking Logistics Terminology
Heavy Goods Vehicles (HGV, or now officially in the EU called LGV for Large Goods Vehicles) are classified by the European Union as motor vehicles (i.e. trucks/lorries) with a maximum allowed mass (MAM) or gross combination mass (GCM) of over 3,5 tonnes. There are two sub-categories:
N2 – vehicles up to and including 12 tonnes
N3 – vehicles over 12 tonnes
According to a report published by ANFAC (Asociación Española de Fabricantes de Automóviles y Camiones in 2008), European Motor Vehicle
Parc 2003-2008, there were a total of 4.5 million vehicles corresponding to
this categorization in use in 2008 in the EU 15 countries, a decrease of 0.4% from the 2003 number. However, the heaviest truck class, those over 16 tonnes, rose sharply from 2003 through 2007, tapering off in 2008 as the first signs of recession began to show. The total number of trucks over 16 tonnes rose by 13% between 2003 and 2008, from 49,733 to 56,329.
The physical characteristics of Heavy Vehicles compared to both light commercial vehicles and passenger cars (i.e., their sheer weight, length, height, noise generation, emissions, slowness of acceleration and length of stopping, and their difficulty to maneuver) generate distinct and complex challenges for providing suitable route planning. Larger and heavier vehicles tend to require more road space and are slower to accelerate, and so cause more traffic congestion than smaller, lighter vehicles. The relative congestion impact of different vehicles is measured in terms of “Passenger Car Equivalents” or PCEs. Large trucks and buses tend to have 1.5-4 PCEs, depending on roadway conditions, and even more through intersections or under stop-and-go driving conditions. A large SUV imposes
GRO:NT
FFI
Project Manager: Michael L SenaFinal Report
Ver. 0.4 Date 2011-12-311.4 PCEs and a van 1.3 PCEs when traveling through an intersection.9 The end result is that as their numbers increase, they add disproportionately to the amount of congestion on the roads.
It is not only traffic that increases; safety is a major issue with large, heavy vehicles. Over 40,000 people are killed on European roads each year, and around 10% of those deaths involve heavy truck accidents. In Sweden, heavy truck traffic has increased by 60% during the past 20 years, and now consists of 8% of road traffic, but trucks are involved in 22% of traffic-related deaths.
There are other characteristics of large trucks which complicate route planning even further. These include the types of loads that the vehicle carries and, related to this, the distances that the vehicle is prepared to travel. Types of loads are:
Truckload (TL) - Truckload freight moves from point A to point B without being transferred, and the shipper pays for the entire truck with its freight the only load on the truck. Full truckload carriers move freight that is loaded into a semi-trailer. Semi trailers are typically between 26 and 53 feet (7.92 and 16.15 m).
Less-than-Truck-Load (LTL) - LTL shipping is the transportation of relatively small freight. This is anything too big to be shipped by a parcel carrier (e.g. FedEX or DHL) as a small package, but not a complete truckload. Parcel carriers usually handle small packages and freight that can be broken down in to units less than 150 pounds (68 kg). The LTL load is typically a product on skids that can be handled by a pallet jack or a forklift, but it can also be loose items. In this case the freight moves with other freight from origin to destination through a series of cross-dock terminals. The alternatives to LTL carriers are parcel carriers or full truckload carriers.
The principal distance categories for heavy trucks are:
9 Raheel Shabih and Kara M. Kockelman, Effect of Vehicle Type on the Capacity of Signalized Intersections: The Case of Light-Duty Trucks, University of Texas at Austin, 1999).
GRO:NT
FFI
Project Manager: Michael L SenaFinal Report
Ver. 0.4 Date 2011-12-31 Long-haul - A truck designed to haul for long distances, equiped with an ample cab hosting from a simple bed to almost a full house amenities like toilet, tv, sound, air-conditioning, kitchen and so on. a long haul truck is a truck used for long distance.this usually means it has a sleeper cab and is gone from its home place more often than it is home.
Short-haul or day cab – A truck that only runs locally, usually within 100 miles of its home base.
The process of moving goods involves many different actors who have an interest in the timely delivery of those goods10. The shipper is the person or company who is usually the supplier or owner of commodities shipped. Another term for shipper is consignor (pronounced ‘cun-SIGN-or’). The
freight forwarder is a person whose business is to act as an agent on behalf
of the shipper. A freight forwarder frequently makes the booking reservation. The freight carrier is any person or entity who, in a contract of carriage, undertakes to perform or to procure the performance of carriage by rail, road, sea, air, inland waterway or by a combination of these modes. A freight carrier can be an individual who owns or leases one or more trucks, and who drives the truck him/herself or hires employs drivers. The
consignee is a person or company to whom commodities are shipped. A
shipment of goods is a consignment to a consignee. These are just the main actors.
Shipper Freight Forwarder Freight Carrier Consignee
Transportation Supplier
There are four principal issues that Freight Carriers must address for their own business and on behalf of the Shipper and the Consignee:
10 Global Logistics Network, Inc.
GRO:NT
FFI
Project Manager: Michael L SenaFinal Report
Ver. 0.4 Date 2011-12-31 Security – Protecting the driver and the load from injury, damage and theft. The objective is to ensure that the load reaches its destination when it is expected.
Logistics – Moving goods as quickly and economically as possible from shipping point to destination, minimizing waiting and loading times, providing information on the status of all stages of goods movement. The objective is to maximize profits while delivering the highest quality of service. Traffic congestion is a major problem.
Operations – Operating the vehicle and all of the associated support activities necessary to keep the vehicle on the road, and to do this at the lowest possible costs. The objective is to keep the vehicle on the road for the maximum amount of time at the lowest possible cost. High and erratic fuel costs, the scaricity of skilled drivers are major problems.
Compliance – Ensuring that all laws in all countries where goods are moved are compied with. The objective is to avoid paying more than the necessary amount of money in taxes and fees and to avoid non-compliant behavior that results in fines. Duty of care, work time directives, road charging and environmental regulations are major problems,
2.5.2 Security
The illustration below shows both the visible and hidden costs of a truck being stolen. Visible costs can be covered by insurance and tax reductions, but the hidden costs can have major, long-lasting cost costly effects on the consignee’s business.
GRO:NT
FFI
Project Manager: Michael L SenaFinal Report
Ver. 0.4 Date 2011-12-31Source: AB Volvo
The two main types of crimes are:
Vehicle Robbery
What is the real cost of a truck robbery?
Visible
•
Cargo / vehicle losses
•
Indemnities
- death
- handicaps
•
Insurance policy cost
growth
•
Contract fines
•
Freight cost increase
(12-15%)
GRO:NT
FFI
Project Manager: Michael L SenaFinal Report
Ver. 0.4 Date 2011-12-31o Occurrence – low value cargo
o Destination – dismantling for parts sales; exchange for other goods (e.g., drugs or weapons)
Cargo Robbery
o Occurrence – value cargo, easy to spread in the market o Destination – sales and distribution in the black market In Brazil, the number of truck cargo robberies increased 300% from 1995 to 2003, and the value of losses increased by 500% during this same period.
In Europe, driver protection, load security and stolen vehicle tracking are important in all countries, but the problem is more acute in the eastern countries, especially Russia. Daimler-Benz has identified security telematics as a new field of positive growth. Securitas is aggressively pursuing security telematics for fleet applications as a major growth opportunity.
2.5.3 Logistics
Frost & Sullivan report that third-party logistics providers and the petrochemical industry are the highest adopters of telematics solutions.
GRO:NT
FFI
Project Manager: Michael L SenaFinal Report
Ver. 0.4 Date 2011-12-31Daimler-Benz claim that the use of solutions like their FleetBoard offer savings potentials up to €9100 per year per vehicle, and that logistics management that increases transport efficiency generates the largest share, 43%. According to Daimler-Benz, efficient logistics management results from the following:
o Fewer empty trips
o Real time order processing, status and order updates
o Optimal integration of driver and shipments in the entire order/delivery chain
o Fuel costs savings of up to 4% through truck navigation with the company’s own points of interest.
o Easier integration of subcontractors.
Third-party logistics providers are demanding continuous improvements in their service level agreements while at the same time requiring better management of their costs. This is why this sector has the highest usage of telematics of all sectors, according to Frost & Sullivan.
2.5.4 Operations
The total energy consumption of heavy vehicles can be considered significant on a large, nation-wide scale. In the United Kingdom, for example, data in 2008 (National Statistics Publication 2008, Transport Statistics Publications 2008, National Statistics Publication 2009) indicates that the energy consumed by heavy goods vehicles annually account for about 6.1% of the total national energy consumption (approximately equal to 9.4 million tonnes of oil-equivalent). This amounts to about 22% of the energy used by all the road vehicles, despite the small number of all heavy vehicles of only 1.3% relative to all road vehicles (Transport Statistics Publications 2008). Cars, on the other hand, make up about 80% of the road vehicles, but consume slightly more than twice of that consumed by heavy vehicles, or 56% of the total road transport energy.
In a business where, on average, administrative costs account for 16.8%, personnel costs for 32.9% and fuel costs for 18.7% of total costs, freight
GRO:NT
FFI
Project Manager: Michael L SenaFinal Report
Ver. 0.4 Date 2011-12-31carriers are constantly in search of even the slightest cost reduction potential. Economic survival in the field of transport logistics depends on the fast improvement of fleet performance in combination with a reduction of fixed and variable costs. Mobile solutions, such as telematics services, represent a highly promising approach in this context.
2.5.5 Compliance
In the European Union, drivers’ working hours are regulated by EU regulation (EC No 561/2006, which entered into force on April 11, 2007). The non-stop driving time may not exceed 4.5 hours. After 4.5 hours of driving the driver must take a break period of at least 45 minutes. This can be split into 2 breaks, the first being at least 15 minutes, and the second being at least 30 minutes in length. The daily driving time shall not exceed 9 hours. The daily driving time may be extended to at most 10 hours not more than twice during the week. The weekly driving time may not exceed 56 hours. In addition to this, a driver cannot exceed 90 hours driving in a fortnight. Within each period of 24 hours after the end of the previous daily rest period or weekly rest period a driver must take a new daily rest period.
Emissions compliance
European emission standards define the acceptable limits for exhaust emissions of new vehicles sold in EU member states. The emission standards are defined in a series of European Union directives which define the progressive introduction of increasingly stringent standards. Below is an example:
Currently, emissions of Nitrogen oxides (NOx), Total hydrocarbon (THC), Non-methane hydrocarbons (NMHC), Carbon monoxide (CO) and particulate matter (PM) are regulated for most vehicle types, including cars, trucks, trains, tractors and machinery and barges. These regulations exclude seagoing ships and airplanes. For each vehicle type, different standards apply. Compliance is determined by running the engine at a standardised test cycle. Non-compliant vehicles cannot be sold in the EU, but new standards do not apply to vehicles already on the roads. No use of specific technologies is mandated to meet the standards, though available
GRO:NT
FFI
Project Manager: Michael L SenaFinal Report
Ver. 0.4 Date 2011-12-31technology is considered when setting the standards. New models introduced must meet current or planned standards, but minor lifecycle model revisions may continue to be offered with pre-compliant engines.
For passenger cars the standards are defined by vehicle driving distance, g/km. For trucks they are defined by engine energy output, g/kWh.
GRO:NT
FFI
Project Manager: Michael L SenaFinal Report
Ver. 0.4 Date 2011-12-313
User and Usage Requirements
3.1
Introduction
3.1.1 Objectives
The objectives of User Requirements (UR) are in a first step to identify users and stakeholders of energy efficient navigation for heavy vehicles and in a second step identify their needs and requirements.
3.1.2 Scope and delimitations
As part of the GRO:NT project the research questions related to energy efficient navigation are formed. The process here was that each partner wrote down the research questions of interest for their company. The research questions where then sorted and collected in an Excel document and prioritised based on how important they were rated by the partners.
For UR there were 16 research questions identified that was considered important. These questions could be grouped into four categories described and colour coded below:
What is the fleet owners’ opinion/acceptance on energy efficient navigation and what requirements do they have on it today with regard to functions, settings and route optimization?
What is the truck drivers’ opinion/acceptance on energy efficient navigation and what requirements do they have on it today with regard to functions, settings and route optimization?
What users are there are the market today and where does different requirements come from
What could be the special requirements for navigation for heavy trucks within 10 years?
This question is applicable to both yellow and green above
The color coding corresponds to the relevant research question in Table below.
Table 3.3: The research questions relevant for User requirements
ID Question Importance
S21 What are the special requirements on navigation for heavy trucks today? 9,0 (x)
Tri22
How do Fleet owners want to optimize their routes? What is their opinion on what is most important to optimize for?
7,8 x
S23
From whom does the different requirement on navigation of heavy trucks come from (drivers, fleet owners, authorities, OEMs,..)?
7,3 (x)
GRO:NT
FFI
Project Manager: Michael L SenaFinal Report
Ver. 0.4 Date 2011-12-31 Tri39 What kinds of players are using which kinds of navigation systems? 7,3 (x)V07
What are the drivers' opinions about energy-efficient navigation systems? Do they want/need them?
7,1 x
V09
What are the fleet owners' opinions about energy-efficient navigation systems? Do they want/need them?
7,0 x
Tri23
How should you take into account different boundary conditions, such as rest periods?
7,0 (x)
S22
What could be the special requirements for navigation for heavy trucks within 10 years?
6,7 (x)
S15
What functions do fleet owner want today? / What are their requirements today?
6,5 x V08 What are drivers' requirements? (HMI, settings/options etc) 6,4 x V10 What are fleet owners' requirements? (HMI, settings/options etc) 6,3 x
S10 What actors are interested in data/information today? 6,0 (x?)
S14
What functions do heavy truck drivers want today? / What are their requirements today?
6,0 x S11 Which actors could be interested in data/information within 10 years? 5,9 (x?)
Tra07
It is likely that the routing algorithms will point out a road network with a higher tax rate (motorways). How will the end users react to this?
5,4 x
Tri30
How to get acceptance from the truck and bus drivers regarding system solutions?
5,2 x
3.2
Method
The main method of work in the User requirements subgroup has been literature studies and the search was based on the research questions above. The search was coordinated with the other subgroups.
The search was carried out by staff at the VTI library and databases used and search criteria are described below.
3.2.1 Databases used
The following databases was used
TRAX – the library database at VTI. TRAX was established 1976 and contains more than 130.000 references to publications, including about 13 000 documents freely availabe on internet. The database covers all modes and aspects of transport. TRAX is available at www.transguide.org
ITRD - International Transport Research Documentation. An international
database produced jointly by institutes and organisations from more than 23 countries. Started 1972 and contains more than 400 000 references to publications on transport and transport research. More information at
GRO:NT
FFI
Project Manager: Michael L SenaFinal Report
Ver. 0.4 Date 2011-12-31www.itrd.org. ITRD is available at http://trid.trb.org/ as one of the sources of TRID.
TRIS – Transportation Research Information Services, a database produced in USA containing more than 600 000 references to transport literature. TRIS is available at http://trid.trb.org/ as one of the sources of TRID.
Scopus – a reference database with more than 40 million records from the
scientific, technical, medical and social sciences areas of research, and more lately also from arts and humanities. Scopus is produced by Elsevier. More information at http://info.scopus.com/.
CSA - CSA Engineering Research Database is an international database
containing more than 8 000 000 million records covering international serial and non-serial literature pertaining to civil, earthquake, environmental, mechanical, and transportation engineering. More information at http://www.csa.com/factsheets/engineering-set-c.php.
Inspec - a database containing nearly 12 million records to literature in the
fields of science and technology, the five main subjects being physics; electrical engineering and electronics; computers and control; information technology for business; and mechanical and production engineering. More information at http://www.theiet.org/publishing/inspec/.
3.2.2 Keywords
In general all words have been searched for different endings, like lorry/lorries, road haul?, navig? and different spellings, like routing/routeing.
3.2.2.1 In Swedish (searching Trax)
Lastbil, tunga fordon, tung trafik, yrkestrafik, yrkesförare.
Navigation, navigering, econavigation, econavigering, rutt, rutter, ruttval, ruttoptimering, ruttplanering.
GRO:NT
FFI
Project Manager: Michael L SenaFinal Report
Ver. 0.4 Date 2011-12-31 Lorry, truck, motor carrier, heavy vehicle , heavy goods vehicle, goods vehicle, freight vehicle, hgv, commercial vehicle, trucking, road haul, road haulage, road haulier.
Navigation, navigating, navigational, econavigation, ecoguidance, ecoroute, eco route, eco routing, route, route choice, route guidance, route optimisation, optimal,route, green route, green routing, dynamic routing, dynamic route guidance, shortest route, fastest route, routing algorithm, routeing, guidance system.
Selection of references
The search returned 350 references (roughly 300 unique references). To select the most relevant ones the abstracts were divided between all partners and scored from 1-10. The score 7-10 indicated that the reference was interesting enough to retrieve in full text. In total there were 67 references (61 unique) that were considered interesting enough for a second read. (See Appendix 1 for the full list of references.)
3.3
Users and stakeholders of a navigation system for heavy
vehicles
When identifying users and stakeholders a first list was formed based on the users and stakeholders found among all the research questions. This resulted in a first version of users/stakeholders. When going through the literature searching for the information on what needs and requirements they had, it was also searched whether there were any users/stakeholders missing or if there were any that did not appear at all in the literature. Based on this the list was then modified.
The first set of users/stakeholders based on the research questions are:
Drivers
o Truck drivers o Bus drivers
Fleet owners
Authorities
o Swedish Transport Administration o Local authorities in Sweden o Other European countries
GRO:NT
FFI
Project Manager: Michael L SenaFinal Report
Ver. 0.4 Date 2011-12-31 Data providers o Map providers
o Suppliers of "free" data, such as OpenStreetMap and Google? o Data providers of both static and dynamic data
Truck manufacturers
System providers (only mentioned once) o Third party vendors providing "Apps"
When going through the references no new stakeholders appeared. A reflection however is that drivers, fleet owners and to some degree authorities are the most frequent mentioned in terms of requirements.
3.4
Identification of User Requirements
When searching the literature it was soon concluded that UR regarding energy efficient navigation is not a well-researched area. It was very hard to find any literature dealing directly with UR, instead requirements where hidden in the aims or identification of problems. An example could be a paper on route optimization arguing that this would lead to savings for the fleet owner or less congestion. This mean that the UR may reflect the view of the researcher rather than UR of the stakeholder.
When UR where identified it was primarily the fleet owners requirements that were found but drivers and authorities were also mentioned.
An attempt was made to categorize the UR into groups based on their character. There are of course more than one way to “cut the cake” and there are several UR that fit into more than one category. Each category also has subcategories and some subcategories would probably benefit by a second level of subcategories. This was however deemed to be too ambitious for the needs of this project.
The categories are:
Navigation
o Avoiding obstacles o Energy efficient routes o Comfortable route o Etc. Planning o Planning routes o Optimizing routes o Etc. Management o Operational control/support o Monitoring
GRO:NT
FFI
Project Manager: Michael L SenaFinal Report
Ver. 0.4 Date 2011-12-31o Etc.
Information
o Parking along route o Restrictions along route o Etc.
Miscellaneous
o Reliability / system trust o Easy and safe UI o Etc.
3.4.1 Drivers
Drivers are, together with fleet owners, the categories most mentioned in the literature. The driver is sometimes described as the main user for which systems should be designed and in some cases he is described merely as a driver of the vehicle with little influence on where and how to drive.
3.4.1.1 Navigation
User Requirements identified for the drivers mainly deals with navigation in the sense of finding the “best” route, but also as important is to avoid routes which are unsuitable for trucks. ”Best” route depends on the scope of the paper identifying the UR and includes amongst others shortest, fastest, most fuel efficient, most comfortable and most optimal route depending on several factors.
Examples of unsuitable routes are routes consisting of obstacles such as:
small roads
restricted roads
bridges and tunnels with weight/height restrictions
roundabout with unsuitable dimensions
etc.
If there is dynamic data available it is also of interest to get information on accidents, congestion, severe weather conditions, temporary lorry bans along the route.
Other requirements with regard to navigation are the possibility to choose streets with a preferred size, especially in urban areas as well as choosing routes with the fewest curves and slopes.
As a legal/safety feature speed-limit regulations are also mentioned. Drivers (and their employers) are interested in having the current speed limit presented to the drivers. Dynamic speed limits are also mentioned
GRO:NT
FFI
Project Manager: Michael L SenaFinal Report
Ver. 0.4 Date 2011-12-31here, i.e. recommending an appropriate speed based on the current road and traffic conditions. Other UR concerning legal/safety issues is information on maximum axle loads and minimum inter-vehicle distances where applicable.
3.4.1.2 Planning
There are not many UR related to drivers and planning since this relates more to the fleet owners. The requirements that are mentioned that affects the drivers is planning for stop and rest times and often in combination with suitable LGV parking, restaurants, hotels and other amenities so the driver can stop at a suitable place. Information on delivery places and their opening hours is also mentioned as well as access periods into cities relevant for the LGV they are driving.
3.4.1.3 Management
When it comes to management and drivers there aren’t any specific UR related to energy efficient navigation. The UR found instead relates to secondary usage of the hardware such as the possibility to write time reports, confirm deliveries and communicate with the head office etc.
Another interesting use of the hardware that relates to navigation is the possibility to use the technology for a social network where drivers can warn each other of for instance vehicle hazards.
3.4.1.4 Miscellaneous
Other UR for drivers found in the literature relates mainly to the use of the system such that the user interface should be easy to use and safe to operate while driving. There are also UR that relates to reliability of the system, mainly concerning the information given. There is a requirement, and even skepticism towards current systems, that the information given should be trustworthy and up to date.
3.4.2 Fleet owners
There is a wide range of Fleet owners ranging from private companies with just a few trucks to global corporations with large truck fleets and even
GRO:NT
FFI
Project Manager: Michael L SenaFinal Report
Ver. 0.4 Date 2011-12-31ships and planes. The UR will of course vary largely depending on the size of the companies but also depending on what type of transports the fleet is carrying out and what requirements their customers in turn have on them.
Instead of grouping fleet owners UR in one section like it is done in this report it may have been more appropriate to group them depending on size or type of business. On the other hand there is not enough information in the literature to make it meaningful to break down into further subcategories. As a general remark one can conclude that most UR refers to medium sized and large fleets rather than the smaller fleets.
Most UR also relates to planning and management but many of the drivers UR on navigation comes back to Fleet owners in the planning section.
3.4.2.1 Navigation
User Requirements for fleet owners related to navigation mainly concerns situations where the planned route needs to be changed for some reason, for instance when there is an extra pick up along the route. There are also some UR where fleet owners want to be able to send/upload destinations and even complete routes to the navigation system in the truck.
3.4.2.2 Planning
Planning is the area where the most UR for fleet owners can be found in the literature and there is a large overlap between the UR for navigation for drivers in terms of selecting the best routes and avoiding unsuitable routes (see 3.4.1.1 for examples). The difference between the two is that drivers want information to be dynamic, up to date and relevant for their specific route while planners will have to rely on historical data.
Apart from UR on choosing a route suitable for LGV, planners are interested in optimizing the routes. Optimization requires the information to be reliable, relevant and up to date. UR with regard to optimization are:
To optimize with regard to the expected speed profile along the route, including stops at traffic lights etc.
To decide departure and arrival time based on historical data on traffic flows
To decide on departure time based on suitable platoons to join
GRO:NT
FFI
Project Manager: Michael L SenaFinal Report
Ver. 0.4 Date 2011-12-31 To contain information on delivery places and their arrival/opening hours
To contain information regarding restrictions for certain goods or vehicle types, for example axle loads or environmental zones
To contain information regarding available parking for LGV and space availability
One key issue that appeared in many of the papers was that the system and the information given had to be reliable, accurate and up-to date. This issue refers both to real time data but also the historical data. With more accurate estimates of travel times the truck companies would be able to better coordinate pick-up and delivery windows to minimize waiting times.
3.4.2.3 Management
For management the main UR deals with reliable real time data and communication with the drivers. As a general UR regarding management it is expected that a system would cut costs and ease the burden on management since this is under high pressure in many companies.
There is a great interest in accurate real time data since this would bring many benefits. It is of course a general interest to avoid congestion or places where there has been an incident but it would also allow for the trucking companies to warn customers about delayed transport, or even early if that was the case. It would further allow for them to better estimate whether additional pick-ups/stops were feasible.
For communication the UR refers to things that would make the administration/management easier such as notification of delivery completion and warning other drivers of hazards. But it also refers to monitoring of the drivers and mentioned in that respect are:
Speed violations
Resting time violation
Load regulation violations
Control if delays reportedly due to congestion are plausible 3.4.2.4 Miscellaneous
Other information found in the literature that is of interest is that there is a demand for data security so that strategically information about the trucking companies business is not spread.
GRO:NT
FFI
Project Manager: Michael L SenaFinal Report
Ver. 0.4 Date 2011-12-31It is also of interest to connect the navigation system to tracking and tracing of packages. This may interfere with the remark on data security above.
3.4.3 Authorities
User Requirements for authorities often refers to restrictions and traffic control. For instance authorities are interested in restricting LGV traffic in certain areas or at certain times during the day. This may be due to reducing noise or to enforce environmental zones. It may also be that some areas are restricted for certain type of goods, examples are water protection areas.
Another UR for authorities, or the public at large, is to minimize the sum of truck kilometers. This of course is in the interest of drivers and fleet owners as well.
3.4.4 Data providers, Truck manufacturers, System providers
For these three stakeholders no specific UR was found in the literature. This may of course be an effect of the search criteria rather than there not being any specific UR from these stakeholders. One could also argue that these three stakeholders represent system providers while the stakeholders above are end users and thereby potential customers. Thus, it is in the interest of the system providers to satisfy the UR from the customers and thereby their UR will overlap to some extent.
3.4.5 Discussion
When searching the literature for User Requirements a first step was to identify who the users were. A first set of users was identified by the project partners and this set was then to be verified by the literature. The main findings there were that it was primarily drivers and fleet owners that were mentioned as users, or at least users with specific requirements. Authorities were also mentioned but for the other users identified by the project partners (Data providers, Truck manufacturers and system providers) there was no information on requirements. This may be that they in a sense are more of providers than users and thereby follow the requirements of the user/customer.
GRO:NT
FFI
Project Manager: Michael L SenaFinal Report
Ver. 0.4 Date 2011-12-31Looking at the requirements of the identified users of energy efficient navigation it turned out to be a more difficult task than expected. There was very little research that had looked at this specifically; instead UR had to be extracted from the aims and problem identifications in papers. The requirements found was categorized into five categories; Navigation, Planning, Management, Information and Miscellaneous. Of these, navigation and planning were the most frequent.
It was early in the project decided to not perform surveys but to rely on existing knowledge. In retrospect it may have been more relevant to perform some kind of investigatory survey given the low number of relevant studies found.


![Figure 5.3 - Fuel consumption versus vehicle speed. Source: [20], based on information of the US Department of Energy (see e.g](https://thumb-eu.123doks.com/thumbv2/5dokorg/4939912.135968/96.892.72.608.149.1139/figure-consumption-versus-vehicle-source-information-department-energy.webp)

