A Study on Children and School Pedestrians’ Safety in
89
0
0
Full text
(2) LiU-ITN-TEK-A--08/072--SE. A Study on Children and School Pedestrians Safety in Urban Areas, A Case Study From Norrköping City, Sweden Examensarbete utfört i kommunikations-och transportsystem vid Tekniska Högskolan vid Linköpings universitet. Veysel Dogan Akgul Handledare Kenneth Asp & Ghazwan Al-Haji Examinator Kenneth Asp Norrköping 2008-05-29.
(3) Upphovsrätt Detta dokument hålls tillgängligt på Internet – eller dess framtida ersättare – under en längre tid från publiceringsdatum under förutsättning att inga extraordinära omständigheter uppstår. Tillgång till dokumentet innebär tillstånd för var och en att läsa, ladda ner, skriva ut enstaka kopior för enskilt bruk och att använda det oförändrat för ickekommersiell forskning och för undervisning. Överföring av upphovsrätten vid en senare tidpunkt kan inte upphäva detta tillstånd. All annan användning av dokumentet kräver upphovsmannens medgivande. För att garantera äktheten, säkerheten och tillgängligheten finns det lösningar av teknisk och administrativ art. Upphovsmannens ideella rätt innefattar rätt att bli nämnd som upphovsman i den omfattning som god sed kräver vid användning av dokumentet på ovan beskrivna sätt samt skydd mot att dokumentet ändras eller presenteras i sådan form eller i sådant sammanhang som är kränkande för upphovsmannens litterära eller konstnärliga anseende eller egenart. För ytterligare information om Linköping University Electronic Press se förlagets hemsida http://www.ep.liu.se/ Copyright The publishers will keep this document online on the Internet - or its possible replacement - for a considerable time from the date of publication barring exceptional circumstances. The online availability of the document implies a permanent permission for anyone to read, to download, to print out single copies for your own use and to use it unchanged for any non-commercial research and educational purpose. Subsequent transfers of copyright cannot revoke this permission. All other uses of the document are conditional on the consent of the copyright owner. The publisher has taken technical and administrative measures to assure authenticity, security and accessibility. According to intellectual property law the author has the right to be mentioned when his/her work is accessed as described above and to be protected against infringement. For additional information about the Linköping University Electronic Press and its procedures for publication and for assurance of document integrity, please refer to its WWW home page: http://www.ep.liu.se/. © Veysel Dogan Akgul.
(4) Linköpings Tekniska Högskola. “A Study on Children and School Pedestrians’ Safety in. Urban Areas, A Case Study From Norrköping City, Sweden” Veysel Doğan AKGÜL April, 2008. Handledare: Kenneth Asp Trafiksystem, ITN Linköping University Department of Science and Technology Linköpings Universitet SE-60174 Norrköping, SWEDEN. Ghazwan Al-Haji Trafiksystem, ITN Linköping University Institutionen för Teknik och Naturvetenskap Linköpings Universitet 601 74 Norrköping.
(5) Child Pedestrian Safety ___________________________________________________________________________ Acknowledgements I would like to thank first my supervisor Ghazwan Al-Haji for his great support, patience, inspiration and leadership all through the stream of this work. I would also like to thank my senior supervisor Kenneth Asp for his kind and strong backup and friendly attitude, not only for this project but also in all our meetings. Thank you for teaching me how to think with criticizing. I would like to thank my program coordinator, Jan Lundgren for his non stop positive leadership and hospitable help in all subjects. I would like to thank Linköping University and particularly ITN, for providing me valuable resources and a basis to help build and improve a professional experience and status. I express my gratitudes to Johan Larsson and Ingemar Hillerström for their kind help and leading. I owe gratitudes to Karen Margrethe Ekman and Maria Lund from Skarphagsskolan, Kay Lyckebo from Villastadsskolan. Special thanks to Anders Wellving for his endless friendly and warm attitude on my studies and for his encouragement. Finally, I owe gratitudes to my family for their sheer support and motivation all through my life.. ___________________________________________________________________________ -2-.
(6) Child Pedestrian Safety ___________________________________________________________________________ Abstract Child pedestrian safety is one of the biggest safety issues regarding planning of a well arranged urban traffic. The fact that vulnerable road users suffer most from traffic incidents also raises concern for children. Children need special care while considering traffic safety. The factors are various that they differ from adults by many aspects. For their physically smaller size, immature ability to judge the traffic situations, lack of experience about traffic and mental deficiencies like losing concentration after short periods, they are much more susceptible to the traffic hazards than adults. Various studies have been carried and many applications regarding child and school pedestrian safety worldwide and the most hazardous periods were found as afternoon hours. Age factor generally is flexible but as the child grows older, mobility increases and risks become larger. The risk factors also include the social and economical environment that children living in good life standards suffer less than those are not. Education is also crucial on adopting the sense of road safety on children’s perspective. Simulation based studies have proved to be effective in order to draw child’s attention to the subject, however it should be combined with field trips to gain a more realistic and solid idea about the matter. Besides, engineering measures rise up as another milestone where roadside and land use planning is important. Traffic calming measures have proved to be effective to warn road users and thus form a safer traffic environment for children. Special applications for school zones such as flashing lights, narrowed crossways or 30km/h areas have been effective. The case study concerns the evaluation of child pedestrian safety in the vicinities of various accidents previously happened in Norrköping. Two methods were used to examine the degree of safety for the places of incidents. For locations near an intersection, road safety audit and traffic conflicts technique were applied, while, for the incident points along streets, only road safety audit technique was used. It is stated that, because of the multivariable aspect of the problem, collective application of various safety evaluation solutions would give better idea on the risk of the location and possible improvements for the future. Keywords: Child pedestrian safety, RSA, conflict technique, traffic safety, road safety. ___________________________________________________________________________ -3-.
(7) Child Pedestrian Safety ___________________________________________________________________________. TABLE OF CONTENTS. Chapter 1: Introduction ......................................................................... 12 1.1. Background .................................................................................. 12 1.1.1. Road Safety ......................................................................... 13. 1.2. Aim and Research Questions ................................................... 14. Chapter 2: Methodology and Study Design ............................. 15 2.1. Method ........................................................................................... 15 2.2. Theory ............................................................................................ 15 2.2.1. Stage 1 ................................................................................. 16 2.2.2. Stage 2 ................................................................................. 16 2.2.3. Stage 3 ................................................................................. 16 2.3. Practice .......................................................................................... 16 2.3.1. Stage 1 ................................................................................. 16 2.3.2. Stage 2 ................................................................................. 16 2.3.3. Stage 3 ................................................................................. 17 2.3.4. Stage 4 ................................................................................. 17 Chapter 3: Literature Review ............................................................. 17 3.1. Introduction .................................................................................. 17 3.2. Vulnerable Road Users ............................................................... 17 3.3. Pedestrians ................................................................................... 18 3.3.1. How is the Pedestrian Behavior?...................................... 20 3.4. Child Pedestrian Safety .............................................................. 22 3.4.1. The Problem and Importance ............................................ 23 3.4.2. International Comparison in Developing Countries ........ 25 3.4.2.a. Background .............................................................. 25 3.4.2.b. Pedestrians and Children ......................................... 25 3.4.2.c. Results ..................................................................... 27 3.4.3. Accident Analysis ............................................................... 27 3.4.3.a. Physical and Mental Factors .................................... 27 3.4.3.b. Environmental Factors ............................................. 28 3.4.3.c. Vehicle Speed .......................................................... 29 3.4.3.d. Social Factors .......................................................... 29 3.4.3.e. Parental Factors ....................................................... 30 3.4.3.f. Age............................................................................ 30 3.4.3.g. Time Based Factors ................................................. 31 3.4.4. Crash Type .......................................................................... 32 3.4.5. The Bus Travel .................................................................... 32 3.4.6. Summary (Risk Factors)..................................................... 33 3.5. Research Data ............................................................................... 35 3.5.1. Accident Prevention ........................................................... 35 3.5.1.a. Study 1 ..................................................................... 35 3.5.1.b. Study 2 ..................................................................... 35 3.5.1.c. Study 3 ..................................................................... 36 3.5.1.d. Study 4 ..................................................................... 37 3.5.1.e. Example 1: United Kingdom..................................... 38 3.5.1.f. Example 2: Germany................................................ 38 ___________________________________________________________________________ -4-.
(8) Child Pedestrian Safety ___________________________________________________________________________ 3.5.2. Enforcement........................................................................ 38 3.5.2.a. Study 1 ..................................................................... 38 3.5.2.b. Study 2 ..................................................................... 39 3.5.2.c. Example 1: Netherlands ........................................... 40 3.5.3. Education ............................................................................ 40 3.5.3.a. Study 1 ..................................................................... 40 3.5.3.b. Study 2 ..................................................................... 41 3.5.3.c. Basic Tips................................................................. 41 3.5.3.d. Example 1: USA ....................................................... 42 3.5.3.e. Example 2: Netherlands ........................................... 42 3.5.4. Engineering ......................................................................... 42 3.5.4.a. Study 1 ..................................................................... 42 3.5.4.b. Study 2 ..................................................................... 43 3.5.4.c. Instructions for Safe Design of Roadside for Chld. ... 44 3.5.4.d. The Kea Crossing..................................................... 46 3.5.4.e. Land Use.................................................................. 46 3.5.4.f. Vehicular Properties on Safety.................................. 47 3.5.4.g. Example 1: Sweden ................................................. 47 3.5.4.h. Example 2: Netherlands ........................................... 48 3.5.4.i. Example 3: United States .......................................... 49 3.5.5. Summary (Practices) .......................................................... 50 Chapter 4: Case Study ........................................................................... 51 4.1. Introduction .................................................................................. 51 4.2. The Situation in Sweden ............................................................ 51 4.3. City of Norrköping ....................................................................... 53 4.3.1. Accident History for Child Pedestrians ............................ 53 4.4. Problem Formulation .................................................................. 54 4.4.1. Road Safety Audit ............................................................... 54 4.4.2. The Swedish Traffic Conflicts Technique......................... 54 4.5. School Survey .............................................................................. 55 4.5.1. School 1: Villastadsskolan................................................. 55 4.5.1.a. Infrastructure Changes............................................. 55 4.5.1.b. Education ................................................................. 57 4.5.2. School 2: Skarphagsskolan ............................................... 57 4.5.2.a. Infrastructure Changes............................................. 57 4.5.2.b. Education ................................................................. 59 4.5.3. School 3: Murklans Förskola ............................................. 59 4.5.3.a. Infrastructure Changes............................................. 59 4.5.3.b. Education ................................................................. 61 4.6. Accident Analysis ........................................................................ 61 4.6.1. Accident 1:Norra Promenaden .......................................... 62 4.6.1.a. Data.......................................................................... 62 4.6.1.b. Analysis and Recommendations .............................. 63 4.6.2. Accident 2: Finspångsgatan .............................................. 63 4.6.2.a. Data.......................................................................... 64 4.6.2.b. Analysis and Recommendations .............................. 64 4.6.3. Accident 3: Södra Promenaden......................................... 64 4.6.3.a. Data.......................................................................... 65 4.6.3.b. Analysis and Recommendations .............................. 65 ___________________________________________________________________________ -5-.
(9) Child Pedestrian Safety ___________________________________________________________________________ 4.6.4. Accident 4:Ektorpsgatan.................................................... 65 4.6.4.a. Data.......................................................................... 66 4.6.4.b. Analysis and Recommendations .............................. 66 4.7. Play Gardens ................................................................................ 66 4.7.1. Location 1: Eneby ............................................................... 67 4.7.2. Location 2: Ektorp .............................................................. 69 4.7.3. Location 3: Ljura ................................................................. 70 4.8. Conflict Analysis .......................................................................... 72 4.8.1. Results for the Junctions................................................... 72 Chapter 5: Discussion ........................................................................... 72. Chapter 6: Conclusion and Final Comments ........................... 73 Chapter 7: References ........................................................................... 75 Chapter 8: Appendix ............................................................................... 80. ___________________________________________________________________________ -6-.
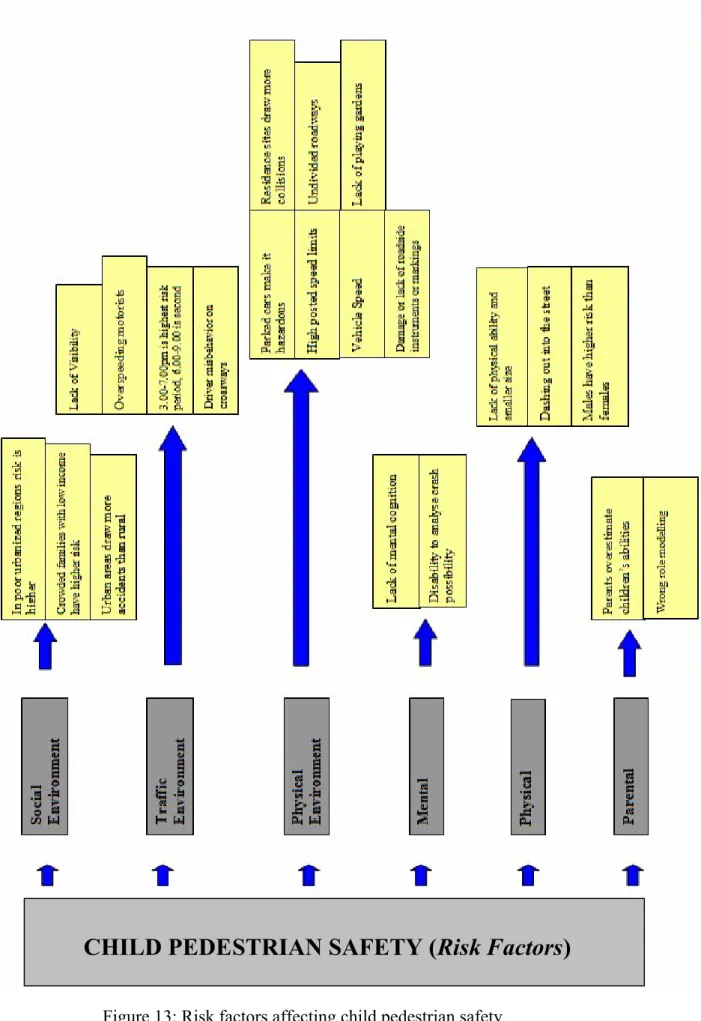
(10) Child Pedestrian Safety ___________________________________________________________________________. LIST OF FIGURES Figure 1: Study Method.......................................................................................................15 Figure 2: Diagram showing fatality groups (%) in Europe, 1994 .......................................19 Figure 3: Pedestrian fatalities and total fatalities by month in EU 2004.............................19 Figure 4: Approximate trend for fatality rates’ relation of age and severity ......................20 Figure 5: A child accident in situ survey.............................................................................23 Figure 6: Pedestrian deaths of 2005 ....................................................................................25 Figure 7: Pedestrian injuries of 2005 ..................................................................................25 Figure 8: Pedestrian casualties by age and gender, by age group and sort of traffic (1-14 years) California, 1991-1999 .........................................................................................................30 Figure 9: Pedestrian casualties by age and gender, by age group and sort of traffic (1-14 years) California, 1991-1999 .........................................................................................................30 Figure 10: Distribution of child fatalities by daily hours and days of week (Source: CARE/2006)........................................................................................................................31 Figure 11: Distribution of child fatalities by daily hours and days of week (Source: CARE/2006)........................................................................................................................31 Figure 12: Death zones around the bus ...............................................................................33 Figure 13: Risk factors affecting child pedestrian safety....................................................34 Figure 14: Division rates among school children on safety comments and ideas on improvements on the various junction locations .............................................................................................................................................37 Figure 15: Chicane ..............................................................................................................44 Figure 16: Speed Hump.......................................................................................................44 Figure 17: Speed Sign .........................................................................................................44 Figure 18: Kea crossing in operation ..................................................................................46 Figure 19: Stop for pedestrians warning .............................................................................48 Figure 20: Pre-painted road surface ....................................................................................48 Figure 21: Reconstructed junction in Drivein University Place,WA..................................49 Figure 22: Overlook of the junction and modifications, Berkshire Street ..........................49 Figure 23: National facts from Sweden...............................................................................51 Figure 24: Causes for child fatalities in Sweden.................................................................51 Figure 25: Unintentional fatality rates for children of 0-19 years per 100.000 people by gender .............................................................................................................................................52 Figure 26: Fatality rates for pedestrians of 0-19 years per 100.000 people by gender .......52 Figure 27: Norrköping Community.....................................................................................53 Figure 28: Age groups and crash severity in Norrköping Community (2006) ...................53 Figure 29: Conflict points at an intersection .......................................................................54 Figure 30: Conflict technique, severity zones .....................................................................55 Figure 31: Villastadsskolan .................................................................................................56 Figure 32: Improvements at upper edge, Lokegatan...........................................................57 Figure 33: Fences to be replaced with bus stop, Lokegatan................................................ 57 Figure 34: Improvements at lower edge, Lokegatan...........................................................57 Figure 35: Traffic rules booklet for students.......................................................................57 Figure 36: Skarphagsskolan ................................................................................................58 ___________________________________________________________________________ -7-.
(11) Child Pedestrian Safety ___________________________________________________________________________ Figure 37: Improvements at upper edge, Gotthemsgatan ...................................................58 Figure 38: Improvements at middle section, Gotthemsgatan..............................................58 Figure 39: Improvements at lower edge, Gotthemsgatan ...................................................58 Figure 40: Student field trip ................................................................................................59 Figure 41: Hand out leaflet for students..............................................................................59 Figure 42: Murklans Förskola .............................................................................................60 Figure 43: Improvements on Brännestadsgatan ..................................................................60 Figure 44: Child pedestrian crashes in Norrköping (2000-2008) .......................................61 Figure 45: Accidents by hours ............................................................................................61 Figure 46: Accidents by age................................................................................................61 Figure 47: Ratio of female and male victims ......................................................................62 Figure 48: Accident No: 1, location ....................................................................................62 Figure 49: Norra Promenaden, left arm ..............................................................................63 Figure 50: Norra Promenaden, right arm ............................................................................63 Figure 51: Accident No: 2, location ....................................................................................63 Figure 52: View from junction, Finspångsgatan .................................................................64 Figure 53: View from junction, Finspångsgatan .................................................................63 Figure 54: Accident No: 3, location ....................................................................................64 Figure 55: Accident location on Södra Promenaden...........................................................65 Figure 56: Accident No: 4, location ....................................................................................65 Figure 57: South approach on Ektorpsgatan .......................................................................66 Figure 58: Parked cars, south approach on Ektorpsgatan ...................................................66 Figure 59: Legend for school illustrations .........................................................................67 Figure 60: Overview of Eneby ............................................................................................67 Figure 61: Illustration of Eneby zone with schools............................................................. 68 Figure 62: Enebyparksskolan ..............................................................................................68 Figure 63: Green areas in Eneby region..............................................................................68 Figure 64: Large size midblock island ................................................................................68 Figure 65: View from Eneby region ...................................................................................68 Figure 66: View from Eneby region ...................................................................................68 Figure 67: Overview of Ektorp ...........................................................................................69 Figure 68: Illustration of Ektorp zone with schools............................................................69 Figure 69: View from Ektorp region...................................................................................70 Figure 70: View from Ektorp region...................................................................................70 Figure 71: View from Ektorp region...................................................................................70 Figure 72: View from Ektorp region...................................................................................70 Figure 73: View from Ektorp region...................................................................................70 Figure 74: Overview of Ljura..............................................................................................70 Figure 75: Illustration of Ljura zone with schools ..............................................................71 Figure 76: View from Ljura region .....................................................................................71 Figure 77: View from Ljura region .....................................................................................71 Figure 78: View from Ljura region .....................................................................................71 Figure 79: View from Ljura region .....................................................................................71 Figure 80: Ektorpsgatan-Skarphagsleden............................................................................ 72 Figure 81: Karlshovsvägen-Finspångsgatan .......................................................................72. ___________________________________________________________________________ -8-.
(12) Child Pedestrian Safety ___________________________________________________________________________. LIST OF TABLES Table 1: Pedstrn.fatality rates by amount of daylight by country, 2004 .............................18 Table 2: Percent rate of drivers who intend to stop while approaching pedestrians ...........26 Table 3: Per cent rate of pedestrians performing safety tasks.............................................26 Table 4: No of fatal crashes for child pedestrians from 5 to 12 age by road and crash type (1992) ..................................................................................................................................31 Table 5: Fatality rates for 5 to 12 age.................................................................................. 31 Table 6: Types of deadly crashes for ages 5 to 12 ..............................................................32 Table 7: Status of speeds at different school locations at different stages of flashing light implementation....................................................................................................................40 Table 8: Role of physical measures on injury reduction .....................................................45 Table 9: Summary of study findings from literature regarding child pedestrian safety......50 Table 10: Planned improvements for Villastadsskolan zone ..............................................56 Table 11: Planned improvements for Skarphagsskolan zone..............................................58 Table 12: Planned improvements for Murklans Förskola zone ..........................................60. ___________________________________________________________________________ -9-.
(13) Child Pedestrian Safety ___________________________________________________________________________. GLOSSARY BAC. : Blood Alcohol Concentration, which is concentration of alcohol in blood stream and is often expressed as mass/volume. CARE. : A charity organization working in 69 countries to help the poor and those in need for survival. Casualty. : Someone being injured or killed in an accident. Chicane. : A non-straight designed roadside to warn and slow drivers. Countermeasure. : Methods or solutions brought to improve or achieve desired characteristics like safety etc.. Divided road. : Roadside with a median or refuge in the middle that separates both direction of lanes. EEVC. : European Enhanced Vehicle Safety Committee, a constitution making research on the motor vehicle basis to improve and evaluate safety. EU. : European Union. EuroNCAP. : European New Car Assessment Program, a constitution testing and ranking recent production cars under certain categories and criteria. Fatality. : A case of death which results from an accident or a disaster. FORS. : Federal Office of Road Safety in Australia. Injury. : Any physical damage to the body caused by violence or accident. Kerb. : An edge between a pavement and a roadway consisting of a line of kerb stones. Motorist. : Someone who drives (or travels in) an automobile. NHTSA. : National Highway Traffic Safety Administration. Overspeeding. : Driving at a too high speed or above the posted limits in a particular area, in a way which brings hazard. Park city. : In-city dwelling type which is surrounded by certain arteries and has its own social, educational and residential zones. ___________________________________________________________________________ -10-.
(14) Child Pedestrian Safety ___________________________________________________________________________ including no roads with heavy traffic Pedestrian. : A person in the traffic environment who travels by foot. Road user. : Members in the traffic network that share the traffiğc environment such as drivers, pedestrians, cyclists, or twowheel riders. Speed hump. : Barrier located transversely on roadside to hinder high speed of vehicles. RSA. : Road Safety Audit. STRADA. : Swedish Traffic Accident Data Acquisition. Toddler. : A young child. UK. : United Kingdom. USA. : United States of America. Zebra cross. : Pedestrian cross way painted as black white stripes on a street or at junctions. ___________________________________________________________________________ -11-.
(15) Child Pedestrian Safety ___________________________________________________________________________ 1. INTRODUCTION Rising population and need for mobility emphasizes need for safety on roads. Mobility both on rural and urban roads, together with increasing number of travel patterns, is affecting road users at a higher grade. Vulnerable road users especially children are of those suffering more than other traffic members. Child safety is a significant title of concern because of special parameters and situations other than adult road users. Children, in both mental and physical way, need more care and show less attention compared to adults on streets. Basically, children have the highest need to explore the environment around, discover the flow and characteristics of life. On the other hand, special and extra attention must be paid while examining a child related title. The subject is a big problem in many societies especially developing countries. However, developed and civilized countries also suffer from child pedestrian incidents on the road side as well as other non-intensional child injuries. The sense, together with continuous education should be a part of the public attention and knowledge to maintain a safe and desirable environment. The paper focuses on a sample approach to examine and help improve a “children-friendly” environment in the Norrköping city of Sweden who is one of world’s leading countries in terms of road safety. 1.1. BACKGROUND Children actively exist in traffic. As they are open to behavioral change, road safety education would be a major factor to improve a good sense of road behavior. A child-oriented attitude will be more beneficial in terms of highlighting the awareness of the subject. During the growth line of a child, interactions with family are replaced with that of peer group so early education is stated important to build a base. There should be the environment where children could travel home and school in a secure way where traffic safety is the main solution here. This is also necessary for their need of playing, learning and enjoying the outer world freely. However, there are factors affecting the chance of this freedom. Parental sufficiency and social conditions have important effect here. Other parental factors may emerge as taking children to school by car which is often disapproved by authorities that they cause crash risk, pollution and lower chance of movement for children who may experience several diseases without exercise as stated by research. A healthy and efficient growth needs both promoting children to walk and play freely and letting them to find the suitable and safe place as well. This sense should not only be a responsibility for the family but also public should be adequately knowledged. Child pedestrian safety is also a serious concern at road and urban planning. Physical and infrastructural modifications like spacious pavements, building zebra-cross ways, and other similar calming methods are best benefited as they are established comprehensively for entire road users. Child behavior acts greatly here that their travel is more open to interruption. A child is unable to retain concentration for long durations compared to an adult who can preserve attention during the time active traffic.. ___________________________________________________________________________ -12-.
(16) Child Pedestrian Safety ___________________________________________________________________________ Enforcement and legal regulations are also complementary on ensuring child safety as pedestrians. Speed limitations and traffic regulations at local scale are examples to this subtitle [1]. 1.1.1. ROAD SAFETY Traffic safety is the whole activities and regulations to maintain a safer environment for those using the roads in an out of the city. For that inside the city has a more active running cycle of movements, greater attention should be given to interactions between motorized and nonmotorized road users [4]. Road safety is the important topic when it comes to mobility of goods and persons. It includes driver and pedestrian perception merited with nationally adopted safety standards. Being stated, It is known that one of the biggest health problems in the society is the traffic accidents [3]. It is reported that road accidents are the main factor acting in the death of people in the European Union who are up to 45 years old. Most of the accidents are caused by at least one traffic violence. It is also mentioned that crashes overall, add up to a cost of 160 billion euros [4]. It is reported that roadside crashes make up one of the most important health related problems. Also reported that as a consequence of road crashes, 1.2 million population lose lives and at least 20 million get wounded as annual data. World Health Organization (WHO) notes that around a 85 percentile of roadside collisions take place in countries of lower financial gain. Also in those countries there is lack of medical treatment facilities for those injured. WHO alsa cites that assessment of economy, health and socially related expenses for the roadside crashes let us realise the severity of the danger and the need for bringing and adapting counterneasures. In countries of lower financial gain, the value of the crashes is estimated to correspond to 1% of the total nationwide income. For those with mid-level financial income, the rate is 1.5% and for those with high financial gain, becomes 2% [5]. In order to make a safe and optimum balance between the two groups and in general, traffic safety brings regulations some of which are examined mainly under, speeding, drink driving, drug use, seat belt use and vulnerable road user safety. Speeding: It is noted that over speeding stands as the biggest reason in terms of accident likelihood. The accident intensity caused by irregular or high speed is denoted as a significant safety warning. Rise in vehicle speed contributes to the incident likelihood and intensity. Alcohol: Even though drink driving is not so often, the outcome hazard is quite high. Concerning EU, the car trips have a 3% percentage of non-allowed blood alcohol concentration (BAC) however the injury rate of the driver because of alcohol is 30%. Drugs: The failure or miss operation in the driving process can also be put down to physical condition and use of known drugs.. ___________________________________________________________________________ -13-.
(17) Child Pedestrian Safety ___________________________________________________________________________ Seatbelt Use: It is known that seat belt use is compulsory for the driver and front passenger seat in Europe. Despite this regulation, degree of conforming this rule changes in different countries. In some countries rear belt usage is also mandatory. It is reported that the usage rate of front seat belts in EU in 1996 was around 80% [4]. Regarding the vulnerable road users, their most hazardous activity is to cross the street. According to Transport Research Center (AVV) in Netherlands, the percentage of pedestrian deaths happened during the crossing. It is also noted that the biggest share belonged to individual cars and heavy good carriers. Among these death cases, rate of those using a zebra crossing was 25%. Considering death rates for older pedestrians, %75 fall in the group who were crossing the street. Obviously one of the highest threatened groups is children. Children are non-adult humans often neglected. Especially in poor countries, child education and infrastructure based measures are missing. Road safety is one big important issue in transportation engineering concept and most of the active traffic flow takes place in urban areas where more people are under risk. So, traffic safety should also care more about vulnerable road users such as cyclists or pedestrians. Among these road users, children and school pedestrians are the proportion of road users who are in need for more care and attention while using the traffic environment. Considering hospitalization, children younger than 11 years make up the majority group. Danger for children is so high that they are under as much danger as pedestrians over 75 years [6]. 1.2. AIM AND RESEARCH QUESTIONS The purpose of this study is to investigate the criteria acting on safety of children as pedestrians in urbanized areas. In the study, the target group is defined as children between 0-15 age group. The paper explains the problem in a broad term of children but in practical study, school children were taken as evaluation group. Research aims to define risk factors by conducting a literature study where various practices from different countries including low income countries. Study solutions so far and common risks help to build a model to evaluate a possible safety study scenario. The model is then aimed to evaluate practices in the selected city. The Norrköping city is chosen as host location to test the criteria and make an evaluation. The study includes a series of research steps. The topic with the traffic and pedestrian safety is a wide subject that in this paper topic is narrowed down to children and school pedestrians’. For that reason the study process has been grouped under several research questions. The first research question: What is the role of vulnerable road users as pedestrians in traffic safety? The second research question: How serious is the child pedestrian safety problem? The third research question: ___________________________________________________________________________ -14-.
(18) Child Pedestrian Safety ___________________________________________________________________________ What are the common risk factors to child&school pedestrians? The fourth research question: What are worldwide studies and practices to improve child pedestrian safety? The fifth research question: What are the common problems and good practices in developing countries? The sixth research question: What level of good practices are currently present in the city of Norrköping? The seventh research question: How could the child pedestrian safety and risks be measured by using different techniques? 2. METHODOLOGY AND STUDY DESIGN 2.1. Method The study structure is conducted and presented in two main parts as theoretical and practical parts followed by a concluding section. At the beginning of the study the subject was introduced with transportation and road safety topics and related to the aim of child pedestrian safety. Then the concept was supported with literature to extract problem factors and results. The further literature included up to date research to improve child pedestrian safety in various aspects in different locations around the world. The findings and reputable solutions are also included in a section summary. Depending on the data in hand a model is defined by help of the criteria in the theory part. The model is then applied to real situation and evaluated upon which conclusions are stated. The study can be briefly sketched as the stages shown in Figure 1. Introduction Theory&Statistics Parameters Model Evaluation Results. Figure 1: Study Method 2.2. Theory The study concerned with theoretical background of child pedestrian hazards by presenting statistical data on accident types and risk groups which was followed by previously done research. Both sections are described by a concluding summary defining the main findings to identify risks, problems, and solutions.. ___________________________________________________________________________ -15-.
(19) Child Pedestrian Safety ___________________________________________________________________________ 2.2.1. Stage 1 The first section of the theory part was designed as the literature review. The initial part is intended to give a background of the problem by beginning with the problems involved in vulnerable road users and pedestrians in general. An international comparison is done to see general failures and disabilities that lead to lack of child pedestrian safety, by indicating good and bad practices from developing countries. 2.2.2. Stage 2 The next part includes statistical data on child pedestrian collisions and the severity of the subject is presented by various statistical examples from different studies. Following that, most common hazards have been identified by scanning various research. These risk factors are then summarized in a sketch under various risk groups. 2.2.3. Stage 3 The third and last part of the literature review was designed as research based on improvements in children’s position as pedestrians in traffic. The research practices and findings were grouped under various types such as education and engineering and presented. Finally, the studies were summarized in a tabular view with their location data, problems, suggested solutions and resultant effects. 2.3. Practice The practical part concerns field studies on various locations in the city of Norrköping. Regarding the surveys, locations of elementary schools were selected for examining elementary school students in their school hours. Besides, children’s play gardens were also considered as a main parameter in terms of child pedestrian safety. The places of green areas, residential zones were visited and evaluated. 2.3.1. Stage 1 The first stage was the data collection for the future observations. Norrköping Municipality was visited and interviews were made on traffic planning, children’s play gardens, and infrastructural changes for three school locations in the city. Project print-outs were obtained with necessary documentation. Accident reports generated by STRADA were collected to be used in analyzing by Road Safety Audit. The municipality was also visited several times during the progress of the study. Schools where physical changes were to be made were visited and documentation regarding traffic safety was collected. 2.3.2. Stage 2 According to the projects and descriptions obtained, results on infrastructural changes in the school vicinity for three locations have been mentioned in tables. Officials from the same schools were also interviewed in order to get information on traffic safety education.. ___________________________________________________________________________ -16-.
(20) Child Pedestrian Safety ___________________________________________________________________________ 2.3.3. Stage 3 Land use was studied by means of documentation collected from the municipality. The residential settlements were examined for Norrköping and visited. Observation results together with comments and other geographical data was described. 2.3.4. Stage 4 The last stage was the evaluation of the accident points in the city. Accident reports obtained from STRADA database were used. Child pedestrian related crashes between years 2000 and 2008 were considered including ages 0-15. Accidents were examined and expressed in charts based on time and age. Four accidents were picked to apply RSA and conflicts technique to assess accident risk and come up with traffic safety solutions. Four locations were examined with the RSA technique where observations and possible suggestions were made. Two out of four locations were also examined with conflicts technique for they were junctions. The remaining locations were streets so they werenot considered in the conflicts study. In the junctions, traffic activity on the intersections was recorded by a video camera during peak hours (7.00am to 9.00am for Finspångsgatan & 3.30pm to 5.30pm for Skarphagsleden). The videos were watched thoroughly and by means of project print-outs of junctions, speed and distance values were recorded by using a chronometer. The distance between the vehicles as evasive action was taken and speed at the same time were recorded on pre-sketched sheets to help find TA (Time to Accident) values (see Appendix). 3. LITERATURE REVIEW 3.1. INTRODUCTION In this section, a general overview of vulnerable road users is given and among them, pedestrians are highlighted. As next step, child pedestrians, an overlook to the situation is presented with common factors leading child pedestrian related crashes. Studies regarding prevention of these collisions are stated and finally risks and solution practices are summarized at the end of the section. 3.2. VULNERABLE ROAD USERS The group of road users who are under the biggest danger on roads are named as vulnerable road users. In meaning, they have the least protection compared to vehicle drivers for instance. Among them are pedestrians, motorcycle or moped riders, or cyclists for the reason that they would need more care and have more trauma risk at the time of any crash. This brings about more need of being protected for them. However, pedestrians and cyclists make up a safe proportion of the vulnerable road users, moped or motorcycle riders pose a bigegr danger to all other road users. Consequently, it is cited by the professionals that pedestrians and bicyclers are main subject to the term “vulnerable” [7]. Among pedestrians, the two fore coming groups are the elderly and children. Children especially fall into the “vulnerable“group for they are not completely well enough to handle traffic safely for the reason that their growing lets adapt traffic awareness at a gradual pace. In this way, in terms of life risk the first ten – eleven years are of great concern. There is danger ___________________________________________________________________________ -17-.
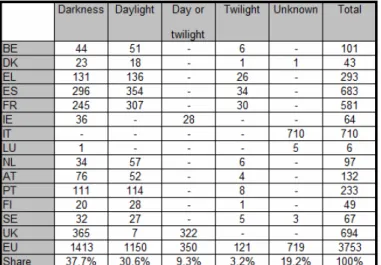
(21) Child Pedestrian Safety ___________________________________________________________________________ for them anywhere having high amount of vehicle traffic, lack of or poor vision or drivers who care more about the cars around instead of vulnerable road users. It is noted that even though children have better recovery rate than a mature human, it is almost impossible to guess the severity of the shocking effect caused by a collision in traffic environment. It is noted that protecting children does not only depend on their good behavior but also policy makers are responsible for the safety issues to warrant secure pedestrian walking on and around roadside also by enforcing vehicles [7]. 3.3. PEDESTRIANS The meaning of the pedestrian according to the member countries of OECD, is someone who uses feet for movement or carries a baby car or wheelchair, or travels by cycling or riding two wheeler vehicle. According to the Wisconsin Community, a pedestrian is: “Any person afoot or any person in a wheelchair, either manually or mechanically propelled, or other low-powered, mechanically propelled vehicle designed specifically for use by a physically disabled person.” [8] There ara also other countries which accepts skaters as pedestrians as well. Considering those, pedestrians can be said to be a mixed community of people using the road. Some other threats for the pedestrians are the polluted air especially in the peak hours, deficiency of the road size by existence of dog walkers or skaters or those out for shopping near stores on the sidewalk [7]. It is noted that drives and pedestrians can separately pose danger on crossways. Factors such as hazardous pedestrian movement, reckless actions, or insobriety can add to danger for being hit by the vehicle. Furthermore, negative effects like precipitation or lack of daylight together can improve hazard for the road environment. Lack of daylight and rain are reported to be strong factors in terms of crash history. The Table 1 below is the representation of the fatalities distributed by daylight within the one day period. From the picture it is seen that UK, Denmark and Sweden are the prominent northern countries where fatalities mostly occur during the dark period of the day so this gives an idea of need for illumination or special care during such hours.. Table 1: Pedestrian fatality rates by amount of daylight by country, 2004 (Source: ETSC ) ___________________________________________________________________________ -18-.
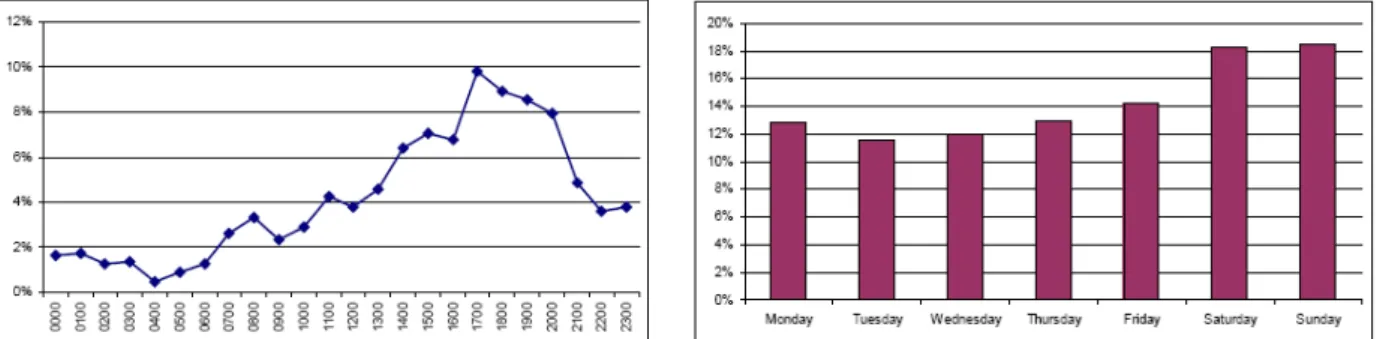
(22) Child Pedestrian Safety ___________________________________________________________________________ Another main reason is cited as overspeeding [4]. Figure 2 below shows a breakdown picture of the fatality distribution among various road user groups. From the picture it is seen that pedestrians have the second highest fatality rate after cars in the traffic environment.. Figure 2: Diagram showing fatality groups (%) in Europe, 1994 (Source: Noordzij, P.C.,Forke, E) [9] The Figure 3 below also represents the occurrence of pedestrian accidents in EU by comparing months of the year. As can be seen, pedestrians experience fatality especially in winter periods which would give us an idea on poor visibility and darkness during the day.. Figure 3: Pedestrian fatalities and total fatalities by month in EU 2004 [10] (Source: European Road Safety Observatory) Figure 4 shows the trend of fatality cases as pedestrian age versus severity per value-million population. The rightmost edge indicates that older pedestrians pose a fatality rate after the age 65 and greater which could be attributed to loss of perception capability and quickness. The rates are even lower around age 80. Also in the early times of the age span, after age 10 the fatality trend makes a steep jump up which indicates the children’s risk [3].. ___________________________________________________________________________ -19-.
(23) Severe pedestrian impacts per population. Child Pedestrian Safety ___________________________________________________________________________ male. female. 120 100 80 60 40 20 0 0. 10. 20. 30. 40. 50. 60. 70. 80. 90. 100. 110. Pedestrian age, years. Figure 4: Approximate trend for fatality rates’ relation of age and severity [3] (Source: Evans, L) 3.3.1. HOW IS THE PEDESTRIAN BEHAVIOR? When we consider the pedestrian motion generally, we see that there is no certain alignment pattern for it. Their movement is often unable to be underestimated for they have various patterns of motions like walking with various speeds, carrying baby cars, etc. This character of them is stated as a possible reason for an unexpected risk [7]. The act of a pedestrian’s street crossing in a junction consists of activities; anticipation, sensing, detecting, cognition, choosing, action and reacting processes. Given an intersection with signalization, visibility and sensing color stand as the primary progressive abilities needed to perform a secure crossing through the road surface [11]. Walking activity can be classified in three groups as work trips, school trips and free time activity trips. During the time people are on way for work, always the closest path is chosen by the work goers. They are also good at conforming the traffic regulations. One risk is that shortest route means dismissing crosswalks, and if the traffic light phase is extra long they tend to disobey the red light rule. The disobey rate increases when the path is an everyday route. People whose aim is to do exercise tend to pick the most secure route to make their journey last long. Talking among each other during active traffic weakens people’s concentration. During the play time of children, they always have the risk for jumping out to the roadside or nearby. Older pedestrians have poorer sense of reacting and perceiving which makes their journey hard to handle different hazardous traffic positions. As a summary, It is noted that pedestrians do not pose as much conformity to traffic regulations as drivers do. While people have the right of walking, they are also supposed to conform to regulations. For instance, disobeying the traffic signalizations exist also in places where forbidden. The primary reason is estimated that the road surroundings and settlement is ___________________________________________________________________________ -20-.
(24) Child Pedestrian Safety ___________________________________________________________________________ designed in accordance with only the motorists, taking for granted that pedestrians agree on waiting for traffic lights or they can walk a long distance to cross the street. On the other hand, for instance considering Japan, the rate of pedestrian factor in accident is solely 15%. The most often cause is cited as rushing into the roadside, make crossing very close to vehicle bumpers disregarding the lights [7]. In a study carried by Corben & Diamantopoulou (1996), analysis and design critera for possible improvements in pedestrian safey in Victoria, Australia was studied. Traffic situation was taken from 58 various problem bearing stretches, being observed and studied during a seven year interval. According to the survey, collisions regarding pedestrians mainly take place on arteries without divided paths (Struik, 1988). According to the outcome, main realities come up as follows; . . . An obviously large rate of collisions happen as mid block crashes by 53% rather than junctions by 46%. Collisions regarding pedestrians happened in places without traffic controlling by 75%. However, 7% accounts for crashes at signalized locations for pedestrians. Zones of residence posed a higher rate of pedestrian based collisions by 23% than the entire locations by 13%. Number of crashes with right-side impact while crossing was double the frequency of those with left-side impact –considering left lane flow- the accidents can be said to happen within the first half-distance of the crossing path. Collisions happened at at greater extent on Fridays compared to other days Considering the arteries, stationary vehicles often were stated as problem as they blocked both driver and pedestrian visibility while moving into the roadside from among parked vehicles. As stated, weekdays and afternoon intervals pose the greatest risk for accident likelihood. Around 33% of the crashes are cited to happen at hours of darkness. As stated in certain zones trams acted serious role in collision during get on/off or by being hit by a tram. Pedestrians tend to choose the closest path to make crossing and reach their destination. Collisions on signalized junctions mostly were caused by not conforming to the light sessions. Fast cars lower the time for the pedestrian to run away, and they bring danger to human life. Roadside elements and markings lead to increase in accident likelihood if they have lost quality being old enough or having lost their visibility. Roadside surface is hazardous if the friction capability is lost as well. [12]. ___________________________________________________________________________ -21-.
(25) Child Pedestrian Safety ___________________________________________________________________________ 3.4. CHILD PEDESTRIAN SAFETY It is clearly stated that child pedestrian trips between school and home is indeed a critical and complicated activity. Every means of transport is cited to come with its own causes of risk. This risk depends on local municipalities, schools and also being stated, transferring from one means to another means of travel has also effect on the context of safety in various residential settlements [56]. People, in general, aging under sixteen are stated as child pedestrians [66]. Children and school pedestrian’s safety calls great attention in many aspects of public life. For that children require special care in traffic all members of road users should have a well adopted sense of traffic behavior towards children. While vulnerable road users need care in traffic, it is pointed that special care should be given to children as pedestrians in many ways. It is clear that both physical and mental traumas could bring more damage to the child than an adult. National authorities and universities have regularly assisted studies concerning child safety and we can say that the overall study of child pedestrians cannot be concluded by fixed standard instructions for the regulations and statistics often differ from country to country and degree of urbanization. The main trouble with children in traffic can be listed roughly as follows: . Disability to be seen easily by motorists Ability to dash out into the street abruptly and have less control over their movements. Being continuously in action while in street. Experiencing trouble at sensing the direction of the sound Not being good at perceiving vehicle speed. Having limited period of concentration and not focusing on more than one thing at the same time. Paying attention especially on what lies ahead of them, causing “head turns” problem Having also poor concentration when with other pupils [13]. According to a study report from USA, more than 70% of all the casualties are reported to be traffic associated. It is cited by the committee that there is higher risk for younger children concerning pedestrian related fatalities. The fatality rate for children under age 9 is 20% more than those between ages 10 and 14. It is reported that fatality rate is higher among males than females which is around 57% of the total [14]. According to Australian Transport Safety Bureau, after the age of 7, there is a fall in number of fatalities which is attributed to children’s gaining traffic related knowledge. On the contrary, there is an upward trend after age of 11 which is attributed to increase in number of collective transit modes [15]. This calls a possible attention for their route planning within the way back home or vice versa. We can further classify children according to age groups in order to get an idea of their travel length and area of activity. It is cited that only when assisted by an adult do children go for ___________________________________________________________________________ -22-.
(26) Child Pedestrian Safety ___________________________________________________________________________ walking out of their vicinity. The time for their walking alone is stated to begin with school years. For children of higher age, going on foot or cycling is preferred. This age group is stated to use a wider portion of the environment surrounding them. It is cited that children begin to form a complete sensing ability on traffic and build up a “database” for traffic regulations around age 10, before when, they are cited as unable to handle complicated traffic positions and may confuse the actual world “scenes” with imaginary thinking. [7] 3.4.1. THE PROBLEM AND IMPORTANCE The child pedestrian safety title is of great concern for many aspects. The main concern with the children is that they are far different than adults in behavior, thinking and many other sights. A child’s perception of a heading car on his way is much poorer compared to an adult. Similarly, their sensing disability causes lack of understanding of the way of the sound of a vehicle. A child thinks that if he/she looks at the driver, the driver will certainly see him/her at that moment. Also they think that a vehicle can suddenly stop if there is the need, without knowing the complex situation of braking or trying to think as a driver. All those statements show children’s insufficient cognition mechanism to their environment which is a natural outcome of growth. According to another aspect, childhood is stated as a period when people tend to behave in freedom as an outcome of growth. This “freedom” is also supported by parents but leaving the child always alone is stated as wrong. It is noted that a little number of children are able to cop with traffic under age 10, in a safe way [55]. It is noted that people from numerous fields have carried studies and given effort for child pedestrian fatalities. Although fields like city planning, child development, vehicle production, and engineering have tried a lot, the problem is stated to be still complex and need more care in all aspects covering social sights also [54]. The Figure 5 shows a photo after a truck hit a child while turning fast on the road. The situation shows the severity of a possible child injury and why strict measures are definitely needed for child safety on roads. The measures should include multiple aspects. It is cited that road safety should be paid attention by concern for each school, parents and regional school community members [57]. It is reported that rate of entire collisions related to child pedestrians existing on motorways are 10% of the total road accidents [21].. Figure 5: A child accident in situ survey (Source: Source: Schieber,R., A. Vegega, M, E.) ___________________________________________________________________________ -23-.
(27) Child Pedestrian Safety ___________________________________________________________________________ It is cited that in the EU, damage in traffic to pedestrians cover 15% of total deaths occurring in traffic. It is stated that biggest risk counts for those older than 55 and younger than 12 which emphasizes the importance on children [30]. It is known that in public life, children make up the group of people who are most unprotected and are often in continuous movement. It is also wide studied that involving in a car accident is one of the foremost factors leading the fatality and damage of children. The biggest risk group is the children between ages 5 to 9, and they fall in danger in their home vicinity. It is expressed that children own limited knowledge and recognition of traffic hazards. Their behavior of approach is often abrupt without forethought like taking time to evaluate safe conditions around. Another point is cited that they have lack of sense to perceive car speeds towards them. Paralelly, drivers experience visual difficulty in seeing them. The first thing to do is cited that adults should pay individual attention to impose good traffic behavior and approach of decision during the hours in traffic. It is noted that guidance along the age 9 is of great importance. The responsibility on children’s safety is also stated to be on the drivers’ side. The basic driver attitudes are reducing speed in areas of school settlement, parks and recreational areas, or anywhere in the vicinity with child population. An example to that are parents who take their children to school by car. While they are concentrated on own child, other commuting pedestrian children may be neglected by them thus cause risk. The situation is similar for school buses which will be touched in later chapter [16]. Finally, children are subject to great risk in terms of pedestrian casualties in various aspects. If we sum up the general attention points we can list some statements as follows: . Children are little sized which is trouble for being seen by motorists in traffic, particularly when they are waiting among parked vehicles around the border of the road. When younger, children in most cases cannot analyze distance to and speed of a car precisely which is crucial on deciding the traffic conditions’ sufficiency of safety when crossing the street for instance. Parents may think that their children would perform better in a traffic environment then he/she really is. However, most children going to elementary school are unable to recognize traffic signals and judge motorist behavior enough. One more common failure is that both sides as children and motorists suppose that the opposite part will probably give way. [17]. ___________________________________________________________________________ -24-.
(28) Child Pedestrian Safety ___________________________________________________________________________ killed. injured 500000 450000 400000 350000 300000 250000 200000 150000 100000 50000 0. 6000 5000 4000 3000 2000 1000. <5 5-9 10-15 16-20 21-24 25-29 30-34 35-39 40-44 45-49 50-54 55-59 60-64 65-69 70-74 75-79 80+. <5 5-9 10-15 16-20 21-24 25-29 30-34 35-39 40-44 45-49 50-54 55-59 60-64 65-69 70-74 75-79 80+. 0. Figure 6: Pedestrian deaths of 2005 Figure 7: Pedestrian injuries of 2005 (Adapted) by NHTSA,Center for statistics [18] (Source: NHTSA) The Figures 6 and Figure 7 above express the risk groups in pedestrians for both those killed and injured. In the first figure the number of injuries makes a peak at the interval of 16-20 age group starting to jump after around age 9. The trend in fatalities also looks almost the same. 3.4.2. INTERNATIONAL COMPARISON IN DEVELOPING COUNTRIES 3.4.2.a. Background According to studies by Downing (1991&1993), child pedestrian fatalities up to age 15 account for 20% of total deaths in traffic collisions in developing countries [50]. It is stated that developing countries account for 75% of the raodside crashes although they make a 32% of the entire vehicle motor population. It is noted that child pedestrian casualties is one of the most significant fatality factors in developing countries. It is also noted that roadside collisions in Asia and Africa have posed a 300% rise over the last couple of ten years while there was a 30% rise on the developed countries’ side. It is also noted that despite having similar roadside vicinities, risk may vary from one country from another where, this time the local policies, legislations, physical conditions and arrangement of the road, and road user behavior of children and motorists should be factors to be focused [48]. It is also stated that because of lack of school attendance in some countries, public campaigns should be promoted [50]. 3.4.2.b. Pedestrians and Children It is stated that pedestrians in developing countries are a significant fatality suffering group. In Africa, pedestrian fatalities account for at least 40% of entire road collisions. This rate is at least 50% in the Middle East. The same rate is 20% when we consider USA and Europe. Downing and Sayer (1982&1981) cited that the collisions are caused by lack of education both by the driver and pedestrians. Below, Table 2. shows the percentage distribution of drivers intending to stop as pedestrians are about to cross. Cairo (Egypt), Karachi (Pakistan), and Surabaya (Eastern Java) are the three worst cases with 1 and less than 1 drivers yielding way to pedestrians. In Table 3, Egypt and Pakistan are compared in terms of safety task performed by pedestrians. As can be seen, Pakistan performs better than Egypt. ___________________________________________________________________________ -25-.
(29) Child Pedestrian Safety ___________________________________________________________________________. Table 2-3: 2) Percent rate of drivers who intend to stop while approaching pedestrians 3) Per cent rate of pedestrians performing safety tasks. (Source: Transport Research Laboratory, UK) In a study conducted in India on 787 students concerning traffic safety issues, it was found that 40% students didnot have sufficient traffic knowledge. For instance, rate for lack of information on speed limits was 67.3%. 40% of students didnot know about risk factors. Considering the violations, school children who didnot cross at the correct signal were 28.2%. In a study carried in Bangladesh, it was cited that pedestrian casualties happen in 62% of the roadside collisions. In a questionnaire, students identified risk causes as driving without helmet by 62%, and driving during night time without having headlights by 59.5%. Another problem is stated as young drivers who started driving below age 10 by 13.3%, and those start driving after age 12 were 57.3% which is a serious threat for both themselves and other students as well as pedestrians in common. Among them 26% were found without licentiate to drive [49]. The high population in these countries also results in high likelihood of accidents for more people walk on the street thus making more frequent use of the roadside. In Turkey, despite being better than most poor income countries, still there are gaps in school children safety as well as pedestrian safety. One common failure is that drivers’ lack of knowledge. Until couple of years ago, getting a driving license only depended on answering standard questions and many people could take an exam without necessity to attend classes. Even a primary school graduate could get a license after age 18 which then required at least a high school degree by new regulations. So, it can be said that the main hazard is careless drivers for child pedestrians. Secondly, lack of crossways and special markings, construction etc., makes it difficult to draw attention by the driver and make it feel safer for the children. Another factor is the lack of individual student boxes which let them leave belongings emerging as an important gap when compared with Sweden for instance. This makes especially in government schools that children carry heavy bags on their back. This is also unhealthy for the growth as well as being a high risk factor in road traffic. However, school zones are provided with school signs and school buses have back lamps when students get on and off. Also there are organizational campaigns to promote traffic education.. ___________________________________________________________________________ -26-.
(30) Child Pedestrian Safety ___________________________________________________________________________ In a survey of traffic education on developing countries, it was found that in 11% of the developing countries traffic education was given in a single course format. In Islamabad, Pakistan, 26% of the schools are cited to have road safety education. This rate is 34% for Zimbabwe where urbanized zone schools performed better practice than schools in rural areas. In Islamabad, road safety terminology was stated to be taught in 8% of the schools [50]. 3.4.2.c. Results The main shortcomings were drawn out as listed below: Children working for family has higher risk of injury School timetables are overloaded that lack time for safety education There is lack of sources and financial aid Teaching equipment is needed and current ones are mostly useless Trained staff is needed on education of road safety Rural zone collisions are important because of driver inattention. [50] In addition to good practices, it is also stated that eight out of twenty African countries in a study, owned their national road safety committees, around ten were stated to be in a preparation process of high-scale developments. It is stated that because of lack of school attendance in some countries, public campaigns should be promoted. It is cited that around half of the developing countries had road safety in their education program. Zimbabwe is stated to have such an education. In Botswana and Zimbabwe it was stated that at least 75% of schools had road safety education. Also being cited, “dangers of parked cars” was very rarely taught. In Pakistan, it is cited that play garden and posters or films are stated to be used as equipment in 10% of the schools. In Botswana teacher guided courses were stated as highly significant [50]. 3.4.3. ACCIDENT ANALYSIS Children and school pedestrian safety has been wide studied and various countries have kept records and statistics on occurrence of fatalities and injuries and set measurements. The best performing countries in terms of prevention of child pedestrian fatality on the other hand are are Sweden, Netherlands, UK, and Germany. [47] 3.4.3.a. Physical and Mental Factors These factors make the basis of the child pedestrian safety problem. Why we are interested in child crash prevention is basically that children lack enough physical ability and mental cognition together with traffic experience and hazard analysis in order to save themselves. In Australia, according to Federal Office of Road Safety (FORS), of the 31 pedestrian deaths concerning 5 to 12 age group in 1992, 28 incidents were able to be analyzed with enough data. Of those, 24 incidents were caused only by child failure. The main cause to this was stated as insufficient child attention to the on-going traffic environment. In both events, during the street crossing children did not conform to traffic lights or signs. For the incidents where motorist failure was the reason, the main factor was stated as over speeding [20]. ___________________________________________________________________________ -27-.
Figure
![Figure 3: Pedestrian fatalities and total fatalities by month in EU 2004 [10] (Source: European Road Safety Observatory)](https://thumb-eu.123doks.com/thumbv2/5dokorg/5468950.142260/22.892.264.636.529.743/figure-pedestrian-fatalities-fatalities-source-european-safety-observatory.webp)
![Figure 4: Approximate trend for fatality rates’ relation of age and severity [3] (Source: Evans, L)](https://thumb-eu.123doks.com/thumbv2/5dokorg/5468950.142260/23.892.187.686.126.427/figure-approximate-trend-fatality-relation-severity-source-evans.webp)

+7

![Figure 15: Chicane [51]](https://thumb-eu.123doks.com/thumbv2/5dokorg/5468950.142260/47.892.109.778.89.323/figure-chicane.webp)
Related documents
The largest informal area within our project area is located south of Khulti Street/Mblini Street (see page 41) on land used as storm water detention ponds and the area floods
Characteristics Foresight Passion Lateral thinker Skills Decision- making skills Training decision Outsourcing decision Hiring decision Communication skills Bridge between
46 Konkreta exempel skulle kunna vara främjandeinsatser för affärsänglar/affärsängelnätverk, skapa arenor där aktörer från utbuds- och efterfrågesidan kan mötas eller
where r i,t − r f ,t is the excess return of the each firm’s stock return over the risk-free inter- est rate, ( r m,t − r f ,t ) is the excess return of the market portfolio, SMB i,t
Both Brazil and Sweden have made bilateral cooperation in areas of technology and innovation a top priority. It has been formalized in a series of agreements and made explicit
The increasing availability of data and attention to services has increased the understanding of the contribution of services to innovation and productivity in
10 clusterings were performed per dataset (40 in total). 4) Reproducibility of SOM using noisy data. Hence, it is the clustering reproducibility in the presence of
A six weeks observation period took place at a control department that governs the risk management issues of a business unit named IA (Investment Advisory). IA is
