SKI Report 96:70
Risks from Nuclear Waste
Jan-Olov Lijenzin
Jan Rydberg
November 1996
ISSN 1104-1374 ISRN SKI-R--96/70--SERevised edition
SKI Report 96:70
Revised edition
Risks from Nuclear Waste
Jan-Olov Liljenzin
Jan Rydberg
Radiochemistry Consultant Group AB,
Tigerstigen 11, SE-426 72 V. Fr6lunda, Sweden
November 1996
SKI Project Number 95056
This report concerns a study which has been conducted for the Swedish Nuclear Power Inspectorate (SKI). The conclusions and viewpoints presented in the report
CONSULTANT
GROUP AB
Jan-Olov Lil~enzinl Jan Rydberg
RISKS FROM NUCLEAR
WASTE
CONTENT
PageSummary ii
Samrnanfattning iii
1. Introduction 1
2. What is a risk? Some general comments.
2
3. Nuclear risks 3
4. The source term, nuclide decays 4
5. Radioactivity as risk factor 5
6. Dose based radiological risks 6
6.1 Risk expressed as dose value 7
6.2 Relative dose risk 7
6,3 Committed and collective dose risk 8
6.4 Cancer induction risk 8
6.5 Number of allowed doses, recommended dose limits, lethal doses, etc 9
7. Dose-effect relations 9
8. Radionuclide concentrations in water and food 11
9. Waste toxicity and hazard indices 12
9.1 Radionuclide concentration based hazard indices 12
9.2 Radionuclide body burden based hazard indices 13
9.3 Relative hazard indices 13
9.4 Other hazard indices 15
10. Choice of hazard index reference systems 15
10.1 The ore hazard index, NOreHirs 15
10.2 Total heavy metal hazard, THMHirs 15
10.3 Unused fuel hazard, UFHirs 16
10.4 Mine refuse hazard, MRHirs 16
10.5 The consumed fuel hazard, CFHirs 16
10.6 Others 16
11. Hazard indices of different fuel cycles 17
11.1 The thermal Th/U breeder cycle 17
11.2 The thermal U/Pu fuel cycle 17
11.3 The U /Pu fast breeder fuel cycle 17
11.4 The Th/U accelerator driven breeder cycle 17
12. Some general comments and conclusions 18
13. Literature review and references 20
1 Prof., Tekn. Dr. J. O. Liljenziu, Dept. of Nuclear Chemistry, Cbalmers Univ. of Techno!ogy, Goteborg, Sweden.
SUMMARY
The first part of this review discusses the importance of risk. Man seems to have a longing for risks, like a part of the human nature. If risks are missing, they have to be invented, as needed parts in the emotional attraction of sports, amusement parks, traveling, etc.; this is the emotional part of risk. There is also a rational part of risk, in selecting such objects in ordinary life big industry, with a technology poorly understood by the general public, is a favored target. In that category no better choice can be made than the nuclear industry in general, and the nuclear waste in particular. To the public, through laymen like journalists and politicians, the risk from nuclear waste seems only to be treated emotionally, while to the scientists and technicians it is an object of exact calculation: probability of accident times consequence. If there is any relation between the emotional and the rational risk perceptions (for example, it is believed that increased knowledge will decrease emotions), it will be a desirable goal for society, and the nuclear industry in particular, to improve the understanding by the laymen of the rational risks from nuclear energy. This review surveys various paths to a more common comprehension -- perhaps a consensus -- of the nuclear waste risks.
The second part discusses radioactivity as a risk factor and concludes that it (becquerel) has no relation in itself to risk, but must be connected to exposure, either external or internal, leading to a dose risk, i.e, a health detriment, which is commonly expressed in terms of cancer induction rate. Dose-effect relations are discussed in light of recent scientific debate.
The third part of this report describes a number of hazard indexes for nuclear waste found in the literature and distinguishes between absolute and relative risk scales. The relative risk is obtained by dividing the risk value associated with the source (e.g. a waste repository) by the risk (derived according to the same principle) of some known risk source (e.g. a uranium ore deposit in nature). The absolute risks as well as the relative risks have changed over time due to changes in radiological and metabolical data and by changes in the mode of calculation. Some of the effects of such changes are summarized in two Tables and an Appendix, and in a number of diagrams showing different absolute and relative risks vary with radiation protection data, reference choice, waste source, and time.
To judge from the literature, the risk discussion is huge, even when it is limited to nuclear waste. It would be very difficult to make a comprehensive review (or, rather, brew) where all viewpoints are digested, and from that extract the essentials. Therefore, we have chosen to select some publications, out of the over 100 at the end of this report, which we summarize rather comprehensively; in some cases we also include our remarks.
SAMMANFATTNING
I rapportens fOrsta avsnitt diskuteras betydelsen av risk. Vilken betydelse man an vill lagga in i detta begrepp, sa tycks det vara starkt kopplat till marmiskans natur. Manniskan tycks ha en benagenhet att uppsoka risker, och saknas sadana sa maste de skapas, t.ex. i sport, nojesparker, resor, etc.; detta kan sagas utgora riskbegreppets emotionella del. Det flnns ocksa en rationell del; harfOr vaIjes lampliga riskobjekt, Lex. tung industri med en teknologi som ar daIigt fOrstadd av allmanheten; i denna kategori tycks karnkraftindustrin vara ett favoritobjekt, i synnerhet dess avfallshantering. Allmanhetens uppfattning om det radioaktiva avfallet, vanligtvis fOrmOOlad av lekman t.ex. journalister och politiker, ar genomgaende emotionell, mOOan vetenskapsmans och teknikers installning praglas av rationella varderingar: sannolikheten fOr olycka multiplicerad moo dess konsekvens. Om det flnns ett samband mellan emotionell och rationell riskuppfattning (t.ex. anses ofta att okad kunskap kan minska radslan fOr en viss risk), da bor samhallet, inklusive karnkraftindustrin, verka fOr att allmanhetens kunskap om karnavfallets risker hojes. Denna rapport analyserar olika satt att na en mera all man forstaelse -- kanske en enighet mellan alla grupper -- om karnavfallets risker.
I det fOljande avsnittet diskuteras radioaktivitet som en riskfaktor; slutsatsen ar att becquerel-tal i sig inte kan ge en riktig uppfattning om en risks storlek. Sadana tal maste kopplas till exponeringen for den radioaktiva stralningen, externt eller internt, lOOande till en
dos-risk, som vanligen uttryckes i form av en sannolikhet fOr uppkomst av cancer. Det nu anvanda dos-effekt-sambandet diskuteras i belysning av den vetenskapliga debatten harom.
Rapportens sista avsnitt beskriver de olika val av risk-index (hazard indexes) fOr karnavfallet, som forekommer i den vetenskapliga litteraturen, dar man skiljer mellan absolut risk och relativ risk. Den relativa risken erhaIles genom att dividera riskvarden for kallan (t.ex. ett avfallsfOrrad) moo risken (beraknad enligt samma grunder) fran en kand kIDla (t.ex. en uranmalm i naturen). De absoluta riskvardena har i likhet med de relativa forandrats med tiden beroende pa bl.a. andrade radiologiska och metaboliska indata. Konsekvenserna harav sammanfattas i tabeller, appendix, och i ett antal diagram som visar hur sadana absoluta och relativa risker varierar moo straIskyddsnormer, val av referenskIDla, avfallets ursprung, och med tiden.
Risklitteraturen ar mycket omfattande, aven den som bara avser radioaktiva avfallslager. Det ar narmast ogorligt att sammanfatta denna i sin helhet och att darur destillera fram allmangiltiga slutsatser. I denna rapport har darfor valts ett annat satt: ur de mer an 100 referensema till denna rapport har ett antal utvalts, som refereras mera ingaende, och dar slutsatsema kommenteras.
1. INTRODUCTION
In man's pursuit of happiness, which is said to be the ultimate goal of living (85ADL), man looks with anxiety on all risks confronting him and takes all available measures to avoid them. In modern society social safety systems have to some extent relieved man of the paramount worries: to get food, clothing, housing, protection against harm, etc. However, to worry about the future is a natural instinct. Recently L. Sjoberg (96SJO) pointed out that risk aspects has a higher priority to most man than taking chances to improve living conditions. Therefore, man (Le. mankind) looks for all kinds of disturbances on his pursuit of a good life. No easier target can be chosen than industrial technology, the opposite to the "good, old (and illusory 'safe') days". Some 60 million people, soldiers and civilians, were killed by the enormous amounts of weaponry produced in factories during the two world wars, climaxed by the atomic bomb. This creates a picture of industrial technology as something evil, and the main obstacle not only to man's goal of achieving happiness but also to the survival of mankind.
Still, from an evolutionary standpoint, succeeding or failing in the risk race has formed present man, the survival of the fittest (Charles Darwin 1859). Even though news media argue for zero risks, this is probably not of advantage to the society, at least not in the long perspective.
If industry is the main target of anxiety, which industry to designate as the foremost culprit? Some psychological facts can explain why the nuclear industry was chosen.
The industrial and post-industrial society has become too complex to understand for most people, based, as it is, on technical diagrams and economic tables, statistics, predictions, etc. Non-professional people can only digest simpler - or even only simplistic - pictures, as those commonly presented in the news media. Peelings will dominate over figures, something which is also scientifically proven. Adding the journalistic fact that "bad news sell better than good news" - possibly a consent to the human desire of anxiety - the public has been fed by a long list of "risks" from industry, and in particular from the nuclear industry. And partly correctly as the nuclear industry is big industry, and the threat is assumed to be larger the bigger the industry is.
Nuclear reactions and radioactivity are outside common knowledge - they are "inhuman", as some clergymen claim. Radiation risks are of concern also to the technicians, of course, but for a different and more professional reason; usually their large number of data and practical experience show that risks can be well controlled and that they are exaggerated in the public debate. However, the many figures and the extreme safety precautions adapted by the nuclear industry only heightens anxiety: "When they have to make such efforts to improve safety, then it must be terribly dangerous". One of the main problems in the relation between technicians/scientists and the public/journalists is the lack of a comprehensible risk scale, i.e. something which ordinary people can understand and compare with. This point is reiterated in numerous scientific publications, some reviewed in this report (e.g. 91SUZ). It may also be noted, that between the public and the technicians stand confused politicians, which are of little or no guidance to the layman (e.g. 89HAN).
It is important already in this introduction to realize that we deal with two risk aspects: 1) the public perception of the risks from the nuclear industry, and 2) the scientific/technical quantification of the risks. In this paper we mainly discuss the quantitative risks from the radioactive waste. We focus our interest on the relative risk rather than the absolute risk of the waste, i.e. what in society or nature to compare the risk of the nuclear waste with; this is actually a bridge to the public perception of the risk. A goal of these efforts is to find a useful and easily understandable risk comparison standard.
At the end of this report (§ 13) we review some literature on nuclear waste risks as presented by "nuclear people". In the main text we compare the risk concepts and comment upon difficulties, comprehensiveness, etc. Excellent reviews have recently been presented in this field, e.g. by 95KAN, of which we also include a review. In this context, it is unavoidable to discuss the application of the (radiological) no-threshold linear-dose-effect relationship, as it is at the root of the whole risk debate; we quote some critical publications in this field to get further perspective of the risk debate, particulary recent findings presented at the IRPA'9 congress (Vienna april 1996). Finally, we admit that we are no experts on risks; but only concerned nuclear chemists. 1,2
2. WHAT IS A RISK? SOME GENERAL COMMENTS
The Webster Dictionary definition of risk is "the possibility of suffering harm (or loss)". Risk is more a concept than a simple word. In Roget's Thesaurus, synonyms of "risk" are danger, gamble, investment, probability, uncertainty (also indecent, risquee, when using French spelling). We talk about political risks, economic risks (credit risk, etc), psychologic risks (risk of losing ones face), health risks, risk of failure (of some equipment), etc. A recent report (950RN) on the risks of the nuclear fuel cycle includes externalities, i.e. health effects to the general population due to transportation accidents, impact on environmental quality, etc. "Risk" (especially, radiation risk) has become emotionally loaded, something bad that we should try to completely eliminate from our life. (So also with "waste", making nuclear waste a prime hate object.)
Risks can be divided into two main categories:
1. Risks which can be derived objectively and thus quantified (we call this the
quantitative risk). This risk is a product of two properties:
Risk (R) = Probability of occurrence (P)
x
Consequence (C) (1)This is the common scientific definition of risk. For example, parachute jumping involves a very serious consequence although its probability of occurrence is small. On the other hand, the probability of getting a flue is usually high, but the consequence only moderately severe. Rasmussen (74WASH-1400), Hubert (94HUB), and others present risks in diagrams showing the probability of accident versus the severity (number of fatalities per accident).
It may be difficult to get reliable numbers of consequences when they can be described in several ways. Lindell and Sjoberg (89LIN) therefore consider expression (1) to be only "semi-scientific,,3. However, a consequence can often be described with greater accuracy (a bang if something hits a drum), than its probability of occurrence (hitting the drum by throwing stones). Probabilities can only be based on a large volume of experience (experiments) and are described by statistics, which allows rare but large deviations, particulary when low numbers are involved (e.g. few experiments).
Il. Risk as a (psychological, perceived) feeling, which cannot be objectively quantified (we call this the qualitative risk4). Feeling of risk can occur also to animals. The psychological
3 This is a somewhat surprising statement by the former head of the Swedish Radiation Protection Institute (SSI) as SSI has rigidly adhered to the radiological no-threshold linear dose-effect relationships to predict cancer deaths from radioactive releases (se also §4).
4 If risk according to I is semi-scientific, then risk according to n may be classified as "un-scientific". However, we do not suggest such a simplification.
risk perception may therefore be considered as a natural instinct, closely related to (but not identical with) the survival instinct. Some risks may be perceived both by man and dog (e.g. to be run over by an approaching car), while others may be experienced only by man (to receive a parking ticket).
Extensive risk research is nowadays carried out by most serious organizations. While technical organizations like the Swedish Nuclear Power Inspectorate (SKI) does risk analysis according to aspect I, above, other serious organizations like The Swedish Risk Academy (SRA) and the Center for Risk Perception (CRP) are mainly concerned with aspect H. It may be illuminating
to list the SRA principal study subjects: 1. identification of a risk,
2. the size of the risk and its consequences (if it occurs), 3. is the risk acceptable,
4. how to inform of the risk,
5. what protective steps can be taken to avoid the risk, 6. how to control the risk, and
7. how is the risk perceived.
This list covers all aspects from vague human feelings to industrial hardware and may involve people of all groups of society. Maybe, this is what society is.
The CRP researchers at the Stockholm School of Economics point out that it is impossible to describe a risk of type H with a single numerical value, as too many non-quantifiable aspects (for example, ethical) turns up in the single concept "risk". The SRA sums up this situation by describing "risk" as a "multifactorial" concept.
In this report, we will only deal with quantitative risks (aspect I), though we readily admit that the psychological experience of risk is an important issue in presenting scientific risks to the public - perhaps the most essential one in case of risks from nuclear waste.
3. NUCLEAR RISKS
To-day most industrial countries require that risk analysis of nuclear power cover statistical, epidemiological, technological, environmental, psychological and economical aspects (91SESEE). After the IRPA'9 meeting one would like to add: biological and genetic aspects, too. However, risk in nuclear technology and science usually has a more limited scope and means either (i) possibility of some physical accident (reactor accident, accidental waste releases, etc), and/or ii) radiological accident (exposure to radiation). Normally the first risk is assumed to be followed by the second one.
Risks can be classified according to probability of occurrence. Thus SKI in Sweden uses the scale (i) high risk, if the probability of occurrence is >0.01, in which case the risk must be addressed, and (ii) normal risks with a probability of occurrence of < 0.01. In the US (i) all kinds of risks from nuclear power must be < 0.1 % of all other accidental risks, while (ii) the radiologic risk to the population is prescribed to be <0.01 % of all cancer risks (91HOG).
In this report we will not discuss accident probabilities. Reactor accidents have been extensively analyzed in a large number of studies, the most prominent ones being the Rasmussen report (74WASH-1400) and studies of the Three Miles Island accident. The probability of a nuclear waste accident, although included in the 9lSESEE study, has not been analyzed with equal rigor, although much effort is presently put into that subject by the national waste authorities.
Although severe reactor accidents have occurred, people (in 1995) seem to have been convinced that a "Chernobyl-type" accident is not likely to occur in modem LWR's (BWR or PWR). Polls indicate that the main worry of the public is the "risk of the radioactive waste", which "cannot be safely stored". Even if the "waste risk" only is a small leakage of radionuclides from a repository, it may still "poison the population" and "threaten future generations". Though this risk formally belongs to the small ones, perhaps the smallest nuclear accidentS, presently it causes the greatest public concern. In this report we only discuss this latter risk, though - with reference to eqn. (1) - only the "consequence (C)" term, sometimes referred to as the intrinsic (radiologic) risk of the nuclear waste.
4. THE SOURCE TERM, NUCLIDE DECAYS
The radioactive source may be a whole reactor, the spent fuel annually taken out, the radioactivity contained in a spent fuel storage basin or deposited in an underground repository at a given time. Because of decay, the source term always decreases by time. For the products in spent fuel elements, the source term is conveniently 1 kg or 1 ton of spent fuel (not counting grid, hulls, etc) from some type of reference reactor (usually a 1000 MWe reactor at 33% thermal efficiency, burning out the U02 fuel to 33 000 MWd/ton). The spent fuel elements are cooled (1-3 years) in the reactor storage pond, and then perhaps transported to a central storage facility (CLAB in Sweden) were they are further stored for up to 40 years under water. They should then be recanned and deposited in a final repository. Thus a number of "dates" can be given for the source term. For simplicity, data in most reference sources begin at 1 or 10 years after discharge from the reactor.
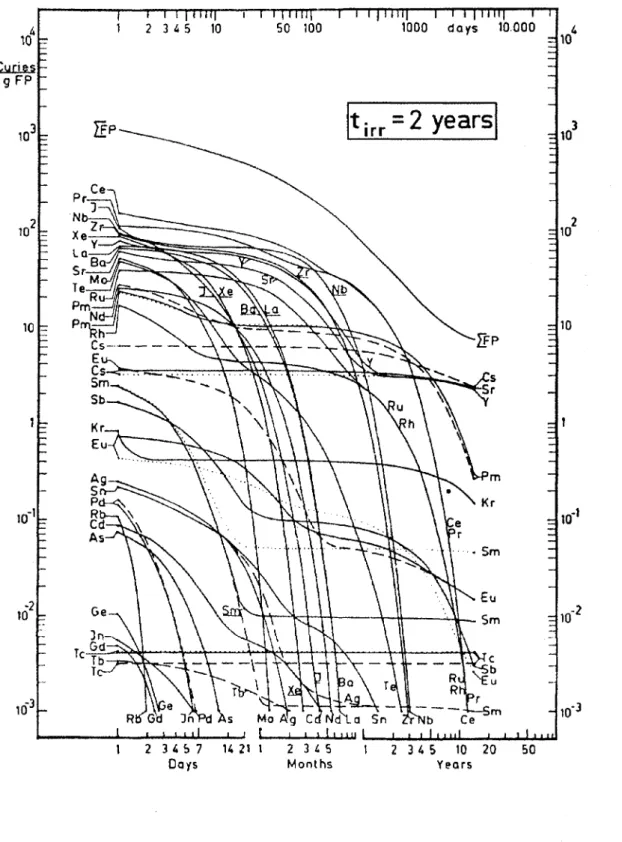
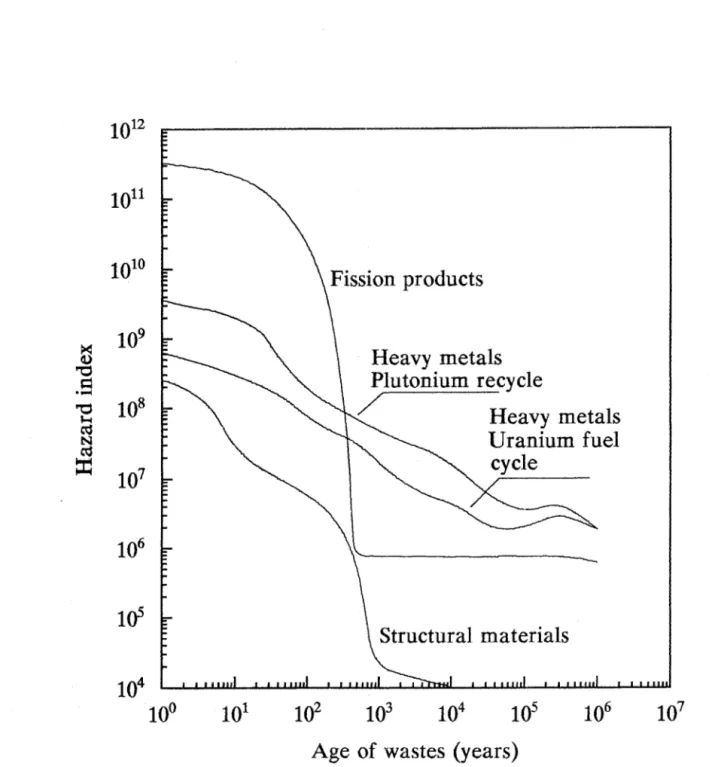
Historically, the first comprehensive information on formation of fission products and actinides in neutron irradiated uranium was obtained from declassified documents of the Manhattan Project (around 1947). A selection of such papers was edited and published in a series of volumes (National Nuclear Energy Series, McGraw Hill Book Co, New York) in the early 1950-ties. Detailed decay curves were presented by 58PRA (Fig. 1) before computer calculated data became available. More exact values on the amount of products in spent reactor fuel was later obtained by various computer codes, e.g. ORIGEN (73BEL), ORIGEN 2 (80CRO), OREST (88HES), BEGAFIP (72ELK), etc. Many more or less complete sets of data have been published for various reactors, modes of operation and fuel cycles. In general, minor deviations between these sets of data are observed, even for identical input data (see e.g.
800LS/HAG/SVE for a comparison of test results). These differences originate from (i)
different ways of handling the effect of neutron energy spectra on cross sections, (ii) differences in the mathematical methods and approximations used, (iii) differences in the assumed time dependence of neutron energy spectra and fluxes, (iv) different self-shielding corrections, etc. However, these minor differences are insignificant for risk analysis, and the data are in all cases probably good enough for use in this context. As a comparison, ALI-values6 are usually not
given with more precision than 1 digit, i.e. ± 10 to ±50% precision (depending on the numerical value of the single digit).
5 If the collective dose commitment concept is combined with the no-threshold linear-dose-effect, however, the "poisoning" of the population by low radioactivity contaminations of drinking water can be shown to be the largest risk.
6 Annual Limits of Intake (ALl), in Bq/year, for occupational exposure are calculated for radionuclides by the International Commission on Radiological Protection (ICRP). An intake of one ALl per year corresponds to a total committed dose equivalent of 50 mSv per year.
In the 1974 Rasmussen Report (74WASH-1400) the release of various radionuclides was calculated according to (estimates of) their high-temperature chemistry. This required, of course, reliable source terms (nuclide composition of the reactor core). The importance of having good source term values became evident at the Three Miles Accident 1979 and the Chernobyl accident 1986 (actually, no "true" source term is known). At the present, data for our "source term" (i.e. nuclide composition of the spent fuel) are for some major nuclides best obtained from pin-cell calculations using reactor physics codes. However, such codes only treat a limited number of fission products (and some reactor codes use hypothetical fission products as stand-in for the real ones in order to simplify the computations). To obtain more detailed information on all nuclides in the fuel one is normally forced to use special isotope generation codes and accept their relatively lower accuracy. However, lack of detailed data on reaction cross sections as function of neutron energy for many of the shorter lived fission products and some minor-actinide isotopes makes it at present futile to try to make more accurate calculations. Table 1 gives some typical data for the abundance of the most important (with regard to potential risks) nuclides in fuel from some different reactor types (data mainly from 74MCG, 75HAD, 800LS/HA.G/SVE and 90LIL).
s.
RADIOACTIVITY AS A RISK FACTORIt is the radioactive source which is (considered to be) the origin of the risk to the environment. The simplest way to express the size of this risk is to give its radioactivity, i.e. the sum of the activity in becquerel (earlier, in curies, Ci) of all radionucIides (Aa
=
I:Ai Bq). We shall call this the radioactivity hazard; in our waste toxicity list, Table 2, we number it A.The radioactivity per se gives inadequate information and must be related to an amount or volume of matter7 as listed in Table 2, yielding different kinds of specific radioactivities:
B 1 per gram or mole of the pure element;
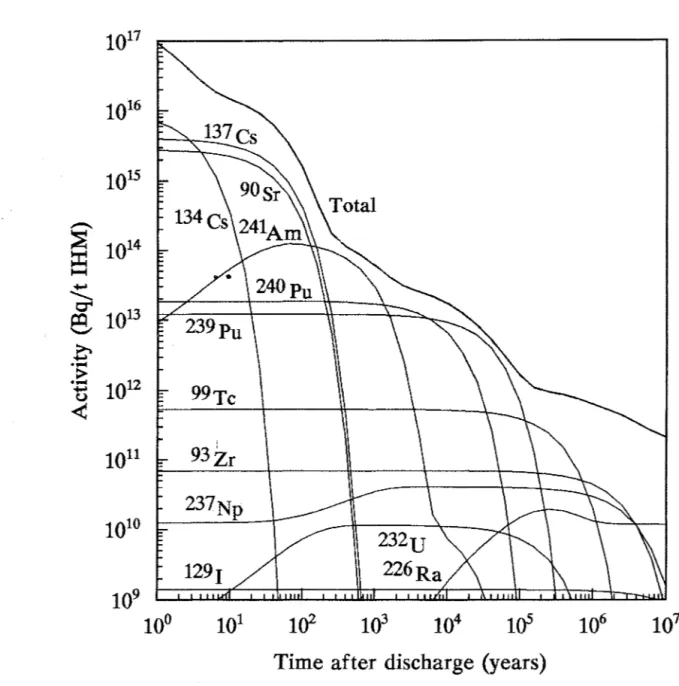
B2 per gram or ton of heavy elements (or, sometimes, oxides) e.g. in spent fuel; Fig 2 (77KJE);
B3 per kWh electric energy produced (to compare with different energy producers); B4 per weight or volume of liquid (reprocessing waste concentrate) or solidified
waste (e.g. glass); etc.
Numerous diagrams of specific activity versus time have been presented as parts of different waste management analyses. In the following, Q
o
will be considered to be specific activity (commonly per ton heavy element (U+
Pu+
Np+
etc) charged to the reactor; if needed D02 is recalculated to pure D),The specific activity, in whatever dimension given, is not an easily understandable risk criterion. For example, what information does 1012 Bq/ton spent fuel element (say, at time 100
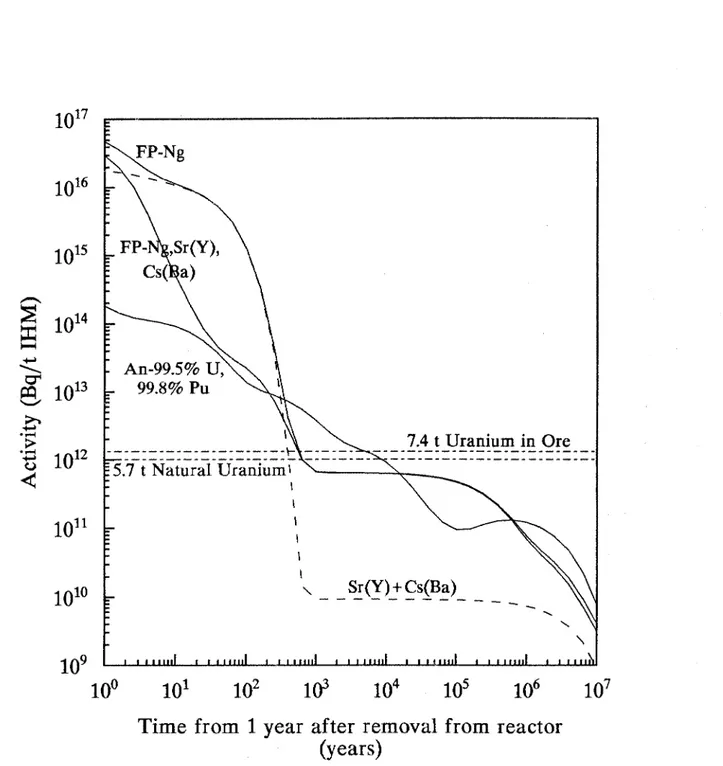
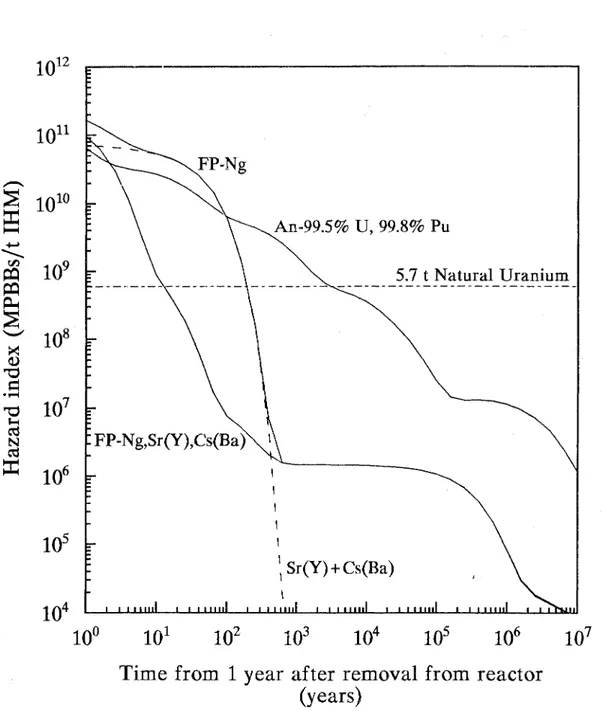
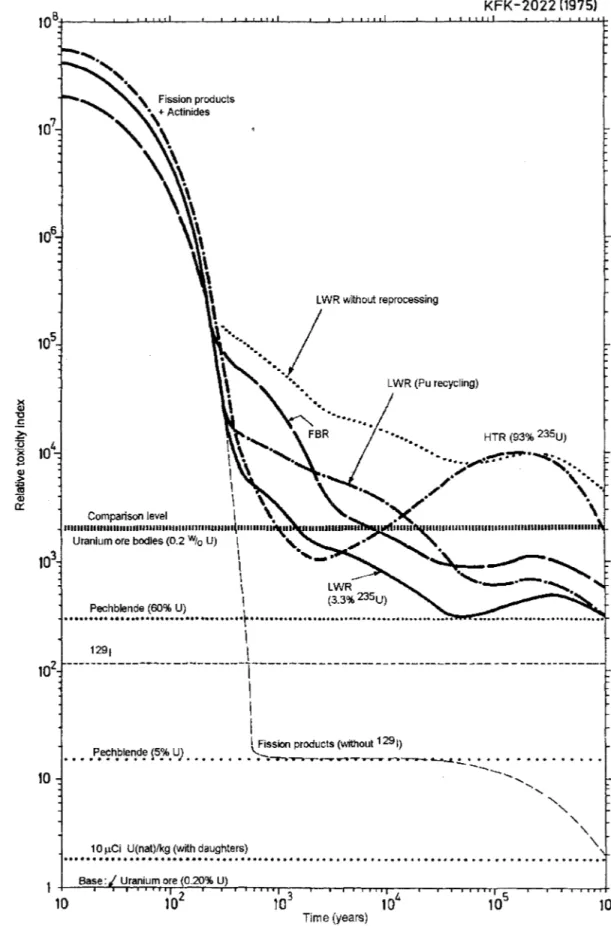
y) provide? Therefore, the radioactivity of the waste must be compared with something in nature, and for this purpose uranium ore is commonly chosen; see Table 2, Cl. This is done (i) e.g. in a Figure, either by giving reference lines for the activity from some chosen uranium ore, Qref (Fig. 3), or (ii) by dividing Qo by Qref which yields a dimensionless "risk" number.
Qo / Qref may be given for radioactive waste glass, in which case Qref is the radioactivity of an
7 Strangely enough, common people often seem to believe that "radioactivity" (or "radioactive radiation") can exist in some immaterial way and do not know that it is a property of matter. Here it is a need for public education!
equal volume of uranium ore. The reference may be 0.2% Uranium ore, but reference lines (in a Figure) are sometimes also given for higher or lower grade ores.
Still, this ratio (or comparison) is an insufficient criterium as regards human health risks.
If the source is outside the organism, it is mainly the gamma-rays which produce the hazard (usually whole body irradiation). If the radionuclides are ingested into an organism, the radioelements accumulate in different organs, causing different damage to them. We therefore treat external and internal risks separately below:
(i) When the source is outside the body, as for most cases of natural background radiation and for exposure to radiation in handling nuclear waste, an appropriate hazard index would be to weight the activities (in Bq) by their gamma-energies (see e.g. 77COH). The exposure is given in units of gray (Gy) and can easily be measured by conventional instruments. Knowing source strength, composition, geometrical conditions, time of exposure, etc, it is straight forward to calculate an average expected whole body equivalent dose (in sieverts, Sv) to the exposed individual.
(ii) For (risk of) internal exposure one must take into account the transport of the radionuclide to man, way of ingestion/inhalation, the chemical properties of the radioelementl-compound, organ affinities, biological (as well as radiological) half-life, and the conversion factor to relate radioactivity (Bq) to dose rate (Sv/s). Several of these aspects are contained in the so-called transfer coefficients available for all radionuclides. Values of transfer coefficients are given by ICRP, UNSCEAR; etc.; see also 90BER.
For both, the risk analysis requires a third link, i.e. the relation between the human dose (Sv) and effect (cancer incidence or other harm). This final point is crucial for any risk conclusion, of course, because if there was not such a dose effect relation, there would be no risk. This last point needs some further comments.
6. DOSE BASED RADIOLOGICAL RISKS
The ultimate radiological consequence of radiation is death in cancer, except for very high doses (~10 Sv). However, there are less severe consequences of radiation exposure: induction of curable cancer (as most thyroid cancers), genetic damage, observed cell damage (frequency of aberrant blood cells, chromosome abberations, etc.) without observable somatic or genetic effects, etc. These consequences are all collected under the name of detriment. We may then rewrite expression (1) as
Radiological risk = Probability of occurrence (P) X Health detriment (Det) (2)
90ICRPH60 calls this risk "the mathematical expectation of consequence". The detriment must always be specified, as different detriments (as for example bone sarcoma and leukemia) have different probabilities and causes, and are therefore not directly comparable (62UNSCEAR). If the detriment is not specified, the radiological risk usually refers to cancer death.
There is an essential difference between expression (1) and (2), For 0) it is more or less implicitly understood that it relates to a short time scale: "If I do this now, the consequence will follow very soon". For radiological risks, the health detriment of irradiation (brief or long) may lead to consequences 10 or 20 years later, as some cancers have very long induction time. A dose commitment concept has therefore been introduced: 90ICRP#60 states that !la radiation dose, when delivered, will involve a risk commitment, i.e. a commitment of increased cancer death probability rate in the future". It was originally introdused as a practical concept to estimate the risks of radioactive fall-out from nuclear weapons tests. The total dose delivered to the population now and in the future from a bomb test was called the dose commitment of
the population due to these explosions. The dose commitment is a useful regulatory concept for radionuclides taken up into the body (through inhalation, food, etc) if they are slowly excreted and have long half-lives (typical for 90Sr), as they will deliver radiation doses for a long time. The dose commitment is rarely used for individuals but for large groups of people (the Marshal islanders, people exposed to Chernobyl fall-out, etc), then in the form of a collective dose: the collective dose commitment (D2 in Table 2). This is very useful concept for surveys of radiation risks over large areas, but is associated with some question marks, see §6.3.
In general, the dose risk from radionuclides may be expressed in the following ways: o as dose risk (Sv),
o cancer induction risk (probability to contract cancer after a given dose), o as a collective dose risk (man-rem, man-sievert),
o as number of "allowed doses" o as number of cancer doses
o dose-based relative risks (dimensionless)
These risk concepts are directly related to the dose value and independent of the radionuclide pathway to man; we describe them separately in §§6.1-6.5. However, when the radionuclides appear in air, water or food it is more convenient to make the risk analyses via their relative concentrations (Bq per m3 or kg) in the matrix material; we describe that in §8.
6.1 Risk expressed as dose value
For a known pathway of a radionuclide to man, one can calculate the external exposure and the uptake into the body of the radionuclide, and the dose received by the exposed man in a given time period. This method has been extensively used in the Swedish Nuclear Safety (SKB/KBS) project, where the dose rate (in Sv/y) to man exposed to radioactive groundwater leaking from a waste repository was calculated. (Note, that doses from individual nuclides always must be summed into a total dose.) A common criticism is the extension of the calculations to millions of years (maybe cancer is curable within 50 years, will geology and ground water conditions remain unchanged, what life style will men have, will he even exist, etc ?). There are some advantages by the use of a dose value as a measure of risk in that it may be compared with natural doses, which - to some extent - avoids the question of the effect of the dose. The drawback, of course, is that the dose value per se is incomprehensible to the common man; he will have no way to interpret the "KBS-curves".
6.2 Relative dose risk
In 62UNSCEAR it is stated that only relative risks o/irradiation can be given. In 1962, sufficient reliable information was only available for leukemia and bone cancers. The effects of natural radiation was then taken as standard, to which effects man-made doses were compared: the radiological risk was expressed as the ratio between the dose from the man-made sources and the natural radiation dose. Thus a dose 200 times the natural background dose was assumed to carry a 200 times larger risk for contracting leukemia than the natural frequency (which is 4.5 cases per 100 000 people per year in the Nordic countries). We may call this the
dose-based relative risk (Table 2, D3). Thus, in expression (2), P and Det are not separately evaluated. It may be of interest to note that in 62UNSCEAR no absolute cancer death figures were given. Mathematically, the dose based relative risk (DBRR) can be stated as
where DE t is the exposure of an individual compared to some reference value, which is Dref,t
(Sv) , as for example the natural background radiation (Dnat,t Sv); t indicates that the doses should be delivered during equal times.
The dose based relative risk has not been directly used, except in principle in 31 WIN and UNSCEAR. It could without great complication be introduced e.g. in the SKB analyses. Instead of this approach, relative hazard indices have been developed, §9.
The application of expression (3) may lead to a confusing consequence as regards the "normal background radiation": for the same exposure, living in a higher background radiation area would constitute a lower risk! This may be a controversial conclusion, if it is not assumed that people become more radiation tolerant in higher background areas. About this, we presently know nothing!
6.3 Committed and collective dose risks
Fall-out, accidental reactor releases, releases from the waste handling, etc, involve small radiation doses to a large population. If the individual doses are summed one arrives at a total dose in man-sievert. This dose is referred to as the collective dose. According to the dose-effect relation (§§6.4 and 7) the effect of a collective dose of 100 man-Sv will be the same either 10 persons receive 10 Sv each, or 1000 persons receive 0.1 Sv each. It is common to express and compare the radiological risk simply in man-Sv. This is used by the United Nations in their UNSCEAR surveys of Sources and Effects of Ionizing Radiation, which is the most extensive and up-to-date publication on radiation doses from man-made and natural sources; see Table 2, D2. The man-Sv concept is probably more difficult to comprehend by the layman than the Sv. In order to relate the emissions of radioactivity from nuclear power installations, or the accumulation of radioactivity in the body from fall-out, to resulting life doses, the ICRP has introduced the committed dose concept, which is the total dose contribution to a person or the population over all future years of a specific release or exposure; for practical reasons, the time is commonly limited to 70 years for a person, and 500 years for a release. The unit is either a life-time dose (Sv) to a person, or the infinite (500 y) time integral of the man-Sv/y dose rate to a population (man-Sv). Radiological health protection organizations often require the nuclear power producers to provide committed dose calculations; even though they seem not yet to have been used in waste management, it is likely that they will be applied in the future to compare different fuel cycles and waste management schemes.
6.4 Cancer induction risk
If cancer death is used as the consequence of receiving a certain radiation dose, it is necessary to have some probability factor relating the dose received with the cancer death frequency. Presently, ICRP and UNSCEAR set the cancer induction risk at 5 % per sievert received for low-levels of low-LET radiation. Thus we can write
Cancer induction rate (LDc)
=
0.05 H (cancer fatalities per Sv) (4)where H is the dose received in sievert. Formally, a dose of 20 Sv received by one individual carries a 100% probability for that person to die in cancer some time in the future, perhaps a long time after the end of the exposure, neglecting dose rate effects. As a whole body dose of 20 Sv given in a short time is lethal (=LD50!30' i.e. lethal dose in 50% of cases within 30 days), expression (4) is only applicable to low dose rates. It was originally derived as a guideline for safety arrangements, not to predict cancer fatalities. Nevertheless, as the cancer induction risk increases with dose, it may be appropriate to use the dose as a cancer risk index. This is e.g. done by Cohen (77COH, 78COH) who calculates the dose received by the body and multiplies it by expression (4) to yield the risk in number of cancer doses (or cancer
deaths), D4 in Table 2. Because expression (4) is fundamental to the risk analysis, we will discuss it further below (§7).
6.5 Number of allowed doses, recommended dose limits, lethal doses, etc.
In 1953 the US National Committee on Radiation Protection (53NCRP), and in 1955 ICRP (55ICRP), set out rules for maximum allowable radiation exposure, limiting it to 5 rem/y
for individuals of age> 18 y. This value has been revised, and in 90ICRP#60 the recommended dose limit is 1 mSv/y for the public (DO.OOI ) and 20 mSv/y (Do.02) for occupational workers.
By dividing the actual dose received by these (or alternative) dose limits, one obtains a figure indicating the number of allowed doses or dose limits (dimensionless), which indicate how hazardous or relatively safe the work is. E.g. if D1Do.OOl > 1, the work exceeds recommended dose limits and is considered unsafe, and action should be taken to reduce the radiation exposure. Alternatively, if one nuclear fuel management concept leads to a D1Do.OOl ratio of 10 000 (e.g. for the U/Pu reprocessing cycle», and another to a ratio 5 000 (e.g. for the once through cycle), these ratios can obviously be used for risk analyses of the different concepts.
A more complicated comparative risk index is the loss of man days in the nuclear industry as compared to in some other method of producing electric energy, as used by 79INH and others. This concept requires evaluation of disabilities other than deaths; e.g. for coal as an energy source it covers all steps beginning at the coal mine (accidents, air and water pollution, coal dust lung illnesses, etc) to the kWh fed into the electric grid. Such risk analyses, and comparisons, may include numerous societal choices, as described e.g. in 750TW or 91SESEE.
It is obvious that the principle of using dose ratios can be applied to any kind of radiation dose ("allowable", "recommended dose limit", "cancer dose", etc) as long as we define the bases for calculating the dose ratio. 77COH compares the number of cancer doses, calculated as above, with number of lethal doses of toxic substances produced by the chemical industry; e.g. if the lethal dose of chlorine is 3 mf:/m3 and the annual production is 10 million
tons (the Common Market in 1986), obviously 10 313 =3 x 10¹² lethal m3 of the gas is annually
produced; this can, for example, be compared to the number of committed cancer doses produced annually by the nuclear industry to provide a relative risk scale. In contrast to radiation, toxic chemicals have threshold values, below which they are regarded as non-lethal or harmless. Risk from ingestion of toxic substances is usually given in grams per kg body weight.
7. DOSE-EFFECT RELATIONS
Risks from radiation have been discussed since the discovery of radiation damage from X-rays and from radioactive substances in the beginning of this century. For example, the paper 31WIN of 1931 contains almost an aspects which has been discussed in subsequent years: dose-effect relations, threshold value, repair mechanisms, harmless dose, etc. As these issues have been covered in numerous publications, the comments below are intended only as a brief sum up of various aspects, including present uncertainties of importance for the judgement of risks from nuclear waste.
The dose-risk relationship is a line in a graph showing the number of expected cancer fatalities versus radiation dose (in Sv). The "standard line" is given by eqn. (4), i.e. a straight line of slope 0.05 (fatalities/Sv). The line goes from origo, i.e. any dose, however small, increases the cancer risk; thus there is no threshold dose, below which the risk is zero. The main foundation for the assumption of a linear no-threshold relation is the radiation effects observed for the Japanese atomic bomb victims (doses in the range 0.2 to > 10Sv). All efforts
to find a convincing linear relation from 200 mSv down to zero has failed; the figure 200 mSv shall be compared with a common natural radiation background value of 2-6 mSv. "Expected" should of course be understood so that the cancer frequency is expected, provided nature can be described by this linear expression. In recent years it has become accepted that the slope decreases by a factor 2-3 (but not to zero!) at the lowest dose values (the "linear-quadratic relation ").
62UNSCEAR (its Appendix H), discusses doses and estimates of risk. The deficiencies in the knowledge on the real dose-effect relationships is emphasized. Nevertheless it is assumed that the effects are proportional to the dose (as "observed for genetic effects of high doses on insects"), as "there is no other alternative". After many reservations, the report states that any
other dose-effect relationship than the linear one would be too complicated to use. 62UNSCEAR
clearly says that the linear no-threshold rule shall be used onlyfor computational purpose (i.e. in making protective regulations), and that it is not a scientific (biological) truth.
Already in 62UNSCEAR it is stated that carcinogenity at high levels of radiation is much too complex to allow the use of a linear dose-effect relationship. Nor can such generalization be made for late somatic effects. The relationship was questioned already at its introduction (58BRU). Many biochemists (e.g. 85Y AL, 95S0N), radiologists (73FRI), toxicologists (e.g. 91MOL), oncologists (e.g. 95WAL), epidemiologists (e.g. 80COH) etc. state that the rule lacks biological credibility: such a complicated process as induction of cancer requires many factors working together, some still unknown. If also the biological repair mechanisms is taken into account, the no-threshold straight line becomes highly unlikely (58BRU, 82LUC, 91CRU). For example, 82 LUC presents over 200 references in support of a beneficial effect of low-dose radiation. The complexity of cancer induction is illustrated in a simple experiment in which Walinder showed how it was possible to cause irradiated mice to develop cancer only by changing their diet (73W AL).
Doubts on the linear relation have recently been expressed by The Health Physics Society in the USA, by the French radiation protection organization (IPSN) and were most recently emphasized at the IRP A '9 (International Congress on Radiation Protection, Vienna,
April 1996). At IRPA'9 it was described that 0) cancer induction beginning by a DNA-damage
requires 3-4 additional biochemical disturbances before cancer growths occur, (ii) only some genes are pro-cancerogenic to radiation; the frequency of these genes are not statistically distributed, (iii) single-strand breaks repair to
>
99% in 2 hours, thus for natural radiation background, which allow months of repair time, probably all damage will be repaired. These results obtained from X-ray studies show that the no-threshold linear ("stochastic", see below) relation is contradictory to biological findings. In this connection serious doubts were also expressed about the collective dose concept.Arguments for the no-threshold linear-line are to be found in most ICRP and UNSCEAR publications, but also some doubts, partkulary in UNSCEAR. Modifying views are expressed e.g. by 77ERL, 80CRA, 94GON, 95MUC and many others. At IRPA'9 it was suggested that a meeting soon is arranged between the proponents and critics of the linear dose effect relation to sort out the discrepancies. The conclusions from such a meeting, endorsed by IRPA, ICRP, UNSCEAR, IAEA, etc. could have an important effect on the risk evaluation of nuclear waste repositories.
Unfortunately, the situation is a little bit more complicated for the nuclear waste, as it exhibits "two radiation risks", mainly from external (low LET) radiation from the gamma-emitting fission products and from internal radiation from inhaled or ingested (high-LET) alpha-emitting actinides. The debate about the linear relationship, above, concerns mainly gamma (and X-) radiation. Most researchers still accept the linear slope of 0.05 for high-LET radiation (at least at high doses). Is there a threshold for alpha radiation? This is related to the concept of deterministic and stochastic processes: it is a priori assumed that a
stochastic process (as the random contraction of cancer) cannot have a threshold, while a deterministic process, as the use of radiation for therapeutic purpose, has a threshold. Walinder and others question this philosophy. The biochemical and genetic studies presented at IRPA '9 show that radiation cancerogenesis is not a stochastic process, but so far only for X-rays. It may also be debated if the slow release of radionuclides from a waste repository to a well used by a family in itself is a stochastic or deterministic process?
In summing up, the basis for the risk analysis - that radiation at the low dose rates (and low total doses) expected from a nuclear waste repository is harmful - is in doubt. The outcome of this controversy will be important for the risk analysis and for the nuclear industry as a whole. The salient point now is that in expressing the risk of radiation in number of cancer fatalities, an additional term of uncertainty is introduced. It may not be a good choice to use a "cancer frequency" or "cancer risk" to describe the hazards of the radioactive waste, but presenting the risk in sieverts, without applying a dose-effect relationship, would be uncontroversial, though probably not very informative to the public.
In the rest of this paper we shall only present risk values in non-biological terms and make risk comparisons by natural comparisons (Table 2).
8. RADIONUCLIDES IN WATER AND FOOD
The risk expression in §6 is convenient for external X- or ')I-radiation, which can be simply measured or calculated for whole-body doses. However, the main risk from nuclear waste comes from radioactive nuclides released into ground water and transferred to potable water sources, or end up in food. The radionuclides ingested move to specific organs in the body where they deliver their dose for a time depending on biological and radioactive half-lives. To estimate the dose from this internal radiation, one must know (a) the concentration of radionuclides in food and potable water (and, eventually, in air in case of gases or aerosols), (b) consumption pattern, (c) relative uptake into body organs, which depend on the chemistry, and (d) biological half-life, which in turn depends on metabolism and decay properties of the radionuclides, (e) the conversion factor from radioactivity (Bq) to dose rate (Sv/s), etc. Dose conversion factors are available in many ICRP and UNSCEAR publications; se also 90BER. The exact calculation of doses is an extensive compartmental summation over time.
The calculation of the dose from radionuclides deposited in the body is quite complicated (59ICRP#2, 90ICRP#61). In 1953 the US National committee on Radiation Protection (53NCRP), and in 1955 ICRP (55ICRP) therefore introduced a new concept, the maximum pennissible concentration (MPC) of a nuclide in edible/potable or breathable food/water or air, and the maximum pennissible body burden (MPBB) of that nuclide (in the US this was referred to as the Radiation Concentration Guide, or RCG); the MPCw-values refer to oral intake by food and water, while the MPCa-values refer to inhalation by air. A daily consumption of food/water for 50 years would lead to the MPBB value. The MPC and MPBB values were set so that the weekly doses would not exceed 0.1 rem/week (or 5 rem/year) either for a 40 hr week (exposure only at work) or for a 168 hr week (continuous exposure), ICRP published an extensive report on MPC and MPBB values in 1959 (59ICRP), with details on daily ingestion values, critical organs, fraction taken up and reaching specific organs.
More recently, limits for the annual intake, ALl-values, have replaced MPC. The ALl-values are calculated using metabolical and organ weight data as given in "Reference Man"
(ICRPH20) with the restraint that a continuous yearly intake of one ALl of a specific radionuclide should not give a larger dose equivalent than a chosen limit; at present 0.05 Sv/year. Appendix I lists MPCw' present ALl-values and DWC. The ALl-values were mostly taken from the list in 90ICRP#61. To simplify the comparison with earlier publications, we will
use the abbreviations MPC and MPBB in the next paragraphs both for the older data from ICRP and for DAC-values etc. calculated from ALl-values and yearly intake of food, water, etc. The most recent ALl-values will be used in our calculations later in this report.
It is pointed out in e.g. 78ADA that i) the ALl value presumes that only the specified nuclide is responsible for the radiation dose, ii) that the data in "Reference Man 11 are mainly relevant for adult white males; eventual deviations caused by differences between sexes and differences between human races are not well known.
From the ALl-values recommended by ICRP in 90ICRP#61 it is possible to calculate the water and air concentrations that would give rise to one ALl during a one year continuous exposure. These concentrations are called derived air concentrations, DAC, or derived water concentrations, DWC. In principle DAC- and DWC-values can be used in place of the old MPCa- and MPCw-values. However, the ALl-value is more general and also useful in cases of
short exposures, for setting limits on the amount of active material handled with certain precautions, etc.
9. WASTE TOXICITY AND HAZARD Indices
The MPBB and MPC values allow the introduction of new risk concepts for sources of radioactive nuclides which may enter into the human body. As we relate the risk to a condition of the source, the term hazard will be more appropriate than "risk". We will use the term
hazard index, which was introduced in the early 1970-ties to describe the risks from nuclear waste (71BEL, 71GER, 72CLA). In Table 2, items E, we have summarized the hazard indices based on MPC and ALl, and which are commonly used in radionuclide waste risk analyses. An important observation is that the hazard index calculation in the ORIGEN code is based on MPCw -data from 10CFR20B and not on MPCw from ICRP. In general this leads to a factor of
10 higher hazard index values in ORIGEN output as compared to calculations based on ICRP MPC data, but several exceptions exist; see Table 4 and appendix A.
9.1 Radionuclide concentration based hazard indices
McGrath (74MCG) discusses risks associated with the radioactive wastes from different nuclear fuel cycles and different deposition concepts, covering risk aspects of the various steps of the cycle until the radionuclides reach the nutrition cycle. In comparable parts, this study is less comprehensive then those by the Swedish Nuclear Fuel Safety Management (SKB) which, however, only analyze specific waste management concepts. McGrath points out that the different chemical atld nuclear properties of the radionuclides makes it necessary to treat each nuclide independently. An index containing all properties of an isotope is not realistic today; he suggests, because of lack of sufficient data and as a first approximation, the use of a hazard
index (HIi ) defined by the relation (Table 2, E2)
(5a) (5b) where Qi is (the source term of) the radioactivi7 of isotope i in the waste mixture (Ci or Bq), and MPCw i is its corresponding MPCw (Ci/m water or Bq/m3 water) value (McGrath uses
hazard index values from ORIGEN output, c.f. Table 4), For more than one radioisotope the ratio has to be summed over all i isotopes (5b). The index HIj gives the amount of water needed to dilute the isotope to its MPCw value. For the gaseous fission products McGrath recommends the use of MPCa (Ci/m3 air or Bq/rn3 air) values.
Noting that volumes of water and of air cannot meaningfully be added together, he suggests a maximum permissible intake index, MPI, which is obtained by multiplying the MPC-values by the annual intake volumes (0.8 m3 water/y, and 7300 m3 air/y), thus
MPIw i
=
0.8 MPCw i MPIa ; ,=
7300 MPC: , i(6a) (6b) The MPl for any single nuclide is in principle the same as its ALl value, although it is calculated "the other way around".
Gera and Jacobs (71GER) suggest an alternative potential hazard index, PHI, which is defined as
PHI· I
=
p. I (Q. / I MPI.) I (r. I I 0 693) • (7)where Pi is a factor "depending on the biological availability" and Ti is the half-life of the radionuclide. 0.693IT; equals the decay constant Ai' Thus eqn. (7) can be written as follows
where t is time (t
=
0 at Qi = QiO)' This eqn. can be used to evaluate the potential hazard index at any time. The usefulness of Pi is dubious as a number of factors enter in the "the biological availability". McGrath calculates PHI; values for a number of fission products and actinides in 1 metric ton of fuel for times from 1 to 1 million years, and compares the results for different fuel cycles (see §1O). It is interesting to note that eqn. (7) yields an infinite potential hazard index for all stable elements that has poisonous effects at any concentration.9.2 Radionudide body burden based bazard indices
Liljenzin, Rydberg and Svantesson in a series of papers (75SVA/LILlRYD, 75RYD/LIL, 75RYD) find that the hazard index described by eqn. (5) is useful but may not be understood by laymen (What message wil11011 m3 water give?). They therefore introduce the concepts of
MPBB hazard index and relative hazard index. The MPBB hazard index, HItot(MPBB), is
defined by (Table 2, El)
(8) analogous to the MPC hazard indices (eqn. 5).
9.3 Relative hazard indices
The relative hazard indices, RHl, either based on MPC or MPBB values, are obtained by dividing the hazard index of the waste nuclides with a suitable reference value (Table 2, El, E3), Hlref for example the hazard index of uranium. Thus
(9a) The value of Hlref can e.g. be calculated for several possibilities, e.g. (1) 6.1 ton natural uranium (this is the amount needed to produce 1 ton of 3.3% enriched uranium fuel at an
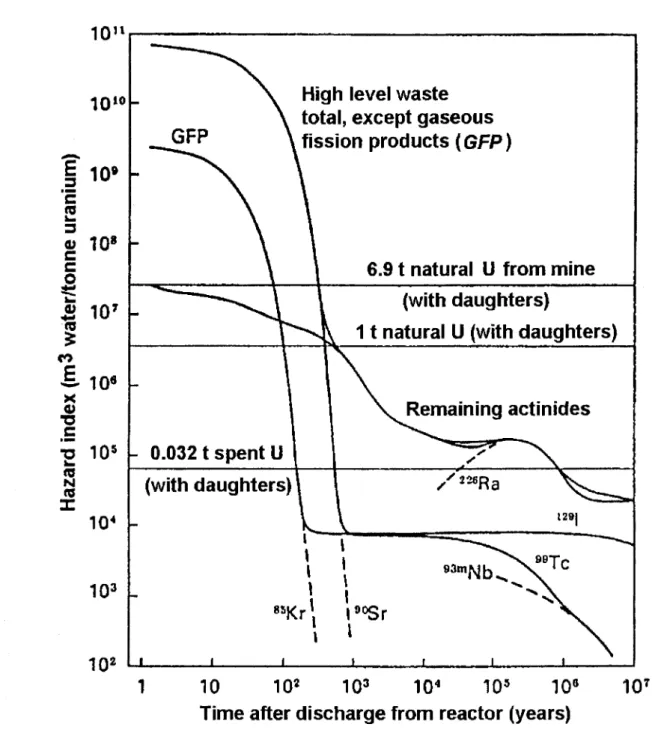
assumed concentration of 0.2 % 235U in the tails fraction) 8 , (2) 1 ton of natural uranium, (3) 0.032 ton U (this is the amount of uranium consumed in the reactor at a burnup of about 30 MWd/kg). In this case it is necessary to sum over all nuclides, including all uranium daughters, both for the nuclear fuel and for the natural uranium). In next paragraph we will discuss the choice of various reference values.
The relative hazard index based on body-burden (relative body-burden risk, RBBR) of the waste nuclides may then be
(9b) Hamstra (75HAM) also uses the MPC-values to derive a radiotoxic hazard measure (RHM) index, which is the same as those defined by eqn. (5); he compares these values with those for 3530 tons of ore plus mill tailings, as this is the material assumed to be required to produce 1 ton of the uranium fuel. He also compares the RHM values for various fuel cycles, including the breeder cycle.
In a survey on the problems of nuclear waste in France, Guillaume (76GUI) introduces a waste hazard index "l'indice de risque radiotoxique" on the basis ofMPC values (CMAP, for Concentration Maximale Admissible dans l' air ou l' eau de boisson pour le Public). Radiotoxicity indices are given for various reprocessing schemes (using different extractants) of spent light-water and fast reactor fuels with and without recycling the plutonium. As all waste is planned to be vitrified, the vitrified waste is used as reference. 89SRI also uses the m3 water
hazard index in discussing different types of fuel cycles where some of the waste nuclides are returned for further use in the reactor.
From around 1985 most publications on nuclear waste, including text books (e.g. 77EHR, 80CHO, 95CHO) seem to use some hazard indices similar to the above to make understandable comparisons. The first publication to put the hazard index of uranium ore to 1 seems to be 78KBS, which shows that at times 104 - 105 years the waste products become less
hazardous than the uranium ore from which they were produced.
In connection with the introduction of the ALARA principle (As Low [doses] As Reasonably Achievable) in 1991 the MPC-values were replaced by ALl-values (Annual Limits
of Intake) (90ICRP#46). Thus, in calculations the MPC-values referred to above are replaced
by ALL -values (or perhaps by the ALL -value divided by the yearly consumption of water or air). This will give hazard indices based on equations 5a and b with the dimension of "number of humans x time" or man-years instead of water volume; alternatively one may use "number of ALls" (Table 2, E4). The switch to the ALL system, which is based on more modern biological and physical data than the old MPC/MPBB system, leads to remarkable changes between the hazard indices for several important radionuclides. As an example the potential hazard index of90Sr is 2.7x 10⁻⁵ m3 of water per Bq when using MPC
w for a 168 hr week and 1.3 x 10⁻⁶
m3 of water per Bq when using the corresponding ALl-based derived water concentration,
DWC. The potential hazard index of 90Sr has decreased by a factor of 20 when going from MPCw to DWC. The change span no less than four orders of magnitude from 237Np (increase
ca. 300x) to 7lGe (decrease ca 0.03x). The most extreme changes are collected in Table 3. In Appendix
A
we give a complete list for a full comparison between MPBB, MPC, ALl and derived values.8 Due to variations in the operational cost, tailings from enrichment plants will contain from -0.2% to _0.3%235U. Hence 6.1 - 7.3 tons ofnarural uranium is needed to produce 1 ton of 3.3% enriched uranium.
9.4 Other hazard indices
We shall only mention one more paper which discusses the use of either a waste toxicity index ("TI") or a repository peifomwnce assessment value ("PAil-value) to evaluate the long-term disposal risks; see 95KAN/HIL.
10. CHOICES OF HAZARD INDEX REFERENCE SYSTEMS
As mentioned above it is necessary to define a reference hazard in order to calculate relative hazard indices according to equation 9a (or 9b)9. It is also desirable that the reference system is quantitatively linked to the nuclear fuel cycle. Otherwise one would have to introduce some kind of normalizing function, e.g. if the potential hazard index of coal ash was our reference we could use the heat (or electricity) produced from a given weight of coal and from a given mass of nuclear fuel to normalize the two potential hazard indices before use in equation 9a; cf. 79INH. Some of the possible reference systems have been mentioned briefly, but here we will try to develop a reference system, the components of which can be added together, if desired, to generate a more complex reference system. In order to be general, we will normally refer to heavy metal (HM) as a common name for the two elements found in nature, thorium and uranium, and for other actinides that can be used to fuel nuclear reactors; in all cases we also refer to 1 ton (elementary) heavy metal as fresh nuclear fuel, initial heavy metal (IHM).
10.1 The ore hazard index, NOreHirs
The most common reference system used was the potential hazard of the amount of unbroken (i.e. native) ore which contains the same amount of heavy metal as a unit mass of unused nuclear fuel. We will call this the native ore hazard index reference system or NOreHirs in this report. NOreHirs is practically constant in time for millions of years to come. The basic value should then be 6.1 tons of U in ore (rather than 1 ton), as this amount is needed to produce 1 ton of 3.3 % enriched (elemental) U in the fuel (" standard fuel ") at a tailings content of 0.2 % 235U . Fig. 4 shows the relation between the mass of natural uranium needed to make one unit mass of enriched uranium as function of enrichment and the concentration in tails.
Only when the waste is solidly deposited in rock, may it be compared with the risk from an unbroken uranium ore. Therefore, the hazard from a waste deposit has been compared with the hazard ofa uranium ore of same volume (or mass) (75HAU, 77COH). The comparison should therefore be made with a volume equal to that of the repository, including the rock inside the repository boundary. In order to bring this in line with the requirement of preceding section, the grade of the uranium ore to compare with must be properly chosen. Usually most studies compare with an 0.2 % U ore. Other choices have been the natural average concentration of U in the ground (about 4 ppm) up to ores around 1% U and to pitchblende (60-70% U); cf. Fig. 10. Figure 13 shows how this index depends on time and data.
OreHirs cannot be used in a straight forward manner when spent fuel is reprocessed and the recovered material reused as fuel.
10.2 Total heavy metal hazard, THMHi:rs
A second alternative is to base the relative potential hazard on the heavy metal actually used to produce fresh fueL We will call this the total heavy metal hazard index reference system
or THMHirs. In case of uranium fuels, it is the potential hazard index of the mass of natural uranium used to produce the fueL For a reactor operated on natural uranium this system is not
much disputed. The same holds for reactors operated on the Th/U fuel cycle. However, for enriched uranium fuel this reference system can be criticized because the potential hazard of the depleted uranium (which remains somewhere) is included in the reference system but does not contribute to the potential hazard of the waste until after very long times (> 100 000 y). THMHirs increases slowly with time as radioactive daughters grow in, see Figure 13.
10.3 Unused fuel hazard, UFHirs
A third choice is the potential hazard index of the amount of heavy metal in unused nuclear fuel. We call this the unused fuel hazard index reference system or UFHirs. The reasoning behind this reference system is that the heavy metal has already been produced for some reason, but we have a choice either to use it in some non-nuclear way or to use it as fuel for a nuclear reactor. The ratio between the potential hazard index of the spent fuel and that of a corresponding amount of heavy metal indicates the increased or decreased potential risk caused by our choice. UFHirs increases slowly with time until radioactive equilibrium is reached in the decay series, see Figure 13.
10.4 Mine refuse hazard9 MRHirs
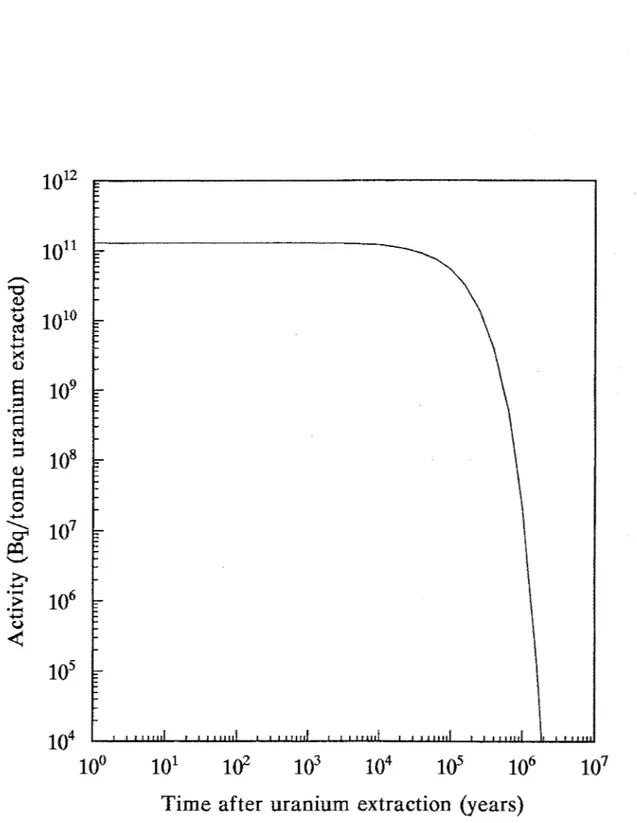
A fourth reference system is the potential hazard index of the mine refuse remaining from extraction of the heavy metal needed to make a unit mass of nuclear fuel. We might call this the mine refuse hazard index reference system or MRHirs. This value depends on the mining technology: surface mining means removal of lower grade rocks, in situ leaching leaves some 20% U in the ore body, etc., efficiency in recovering the uranium from the ore (usually 95-99%), and losses in the manufacturing steps (1-2%) to produce the pure U02 . Therefore, in practice, to make I ton U-fuel a somewhat larger ore body has to be mined than "formally" needed from the average grade value. The leakage of U, Ra, etc. from this mine and manufacturing refuse constitutes a hazard, which cannot be neglected. Thus, MRHirs cannot be assigned a unique value as the radioactivity decreases continually with time, see Figures 5 and 13.
10.5 The consumed fuel hazard, eFHirs
A fifth system is the potential hazard index of the amount of initial heavy metal in the fuel, normally uranium, which has been consumed during reactor operation, either by fission or by conversion to other actinides. We might can this the consumed fuel hazard index reference system or CFHirs. CFHirs corresponds to a potential hazard that has really disappeared and been replaced by the potential hazard of the spent fuel or high level radioactive waste. CFHirs is constant in time, c.f. Fig. 13.
10.6 Others
Many authors have suggested other reference systems, in principle based on reasonable combinations of the five basic hazard index reference systems defined above. As an example, THMHirs plus the corresponding MRHirs has been used by Phlippen (see 96IAEA).
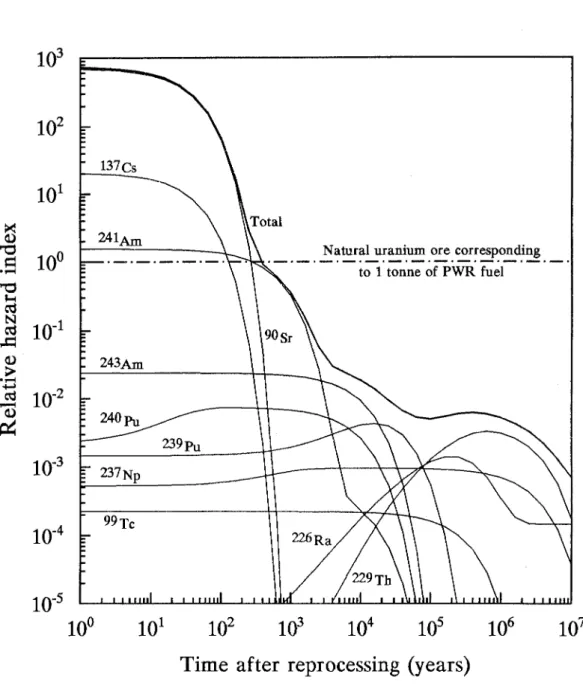
Figure 13 illustrates the value of the five basic hazard index reference systems (normalized to 1 ton, 3.1 % enriched PWR fuel) as function of time. It is obvious from this Figure that the time variation and magnitude of any relative potential hazard index depends on the reference system used. We have tried to illustrate this in Figures 14, 15, 16, 17 and 18. These Figures show the total ALl-based relative potential hazard of 1 ton of spent PWR fuel (3.1 %, 0.2 % in tails) using five basic relative hazard indices.