62
ISBN: 978-91-88898-64-7
Prediction of tensile strength in sawn timber by means of surface laser scanning
and dynamic excitation
Andreas Briggert†*, Anders Olsson† and Jan Oscarsson†
†Department of Building Technology, Växjö, andreas.briggert@lnu.se, anders.olsson@lnu.se, jan.oscarsson@lnu.se
Machine strength grading of sawn timber is based on the relationship between so-called indicating properties (IPs) and
grade determining properties (GDPs). The former are calculated using board properties measured non-destructively
whereas the latter are determined by destructive tests. For T-classes, which are used for glulam lamellae, the GDPs are tensile strength (ft,0), modulus of elasticity (MOE) in tension and density.
The aims of this study were to develop an IP, similar to the one given in [1], for prediction of tensile strength and to calculate yield in different T-classes using this IP. Non-destructive and destructive measurements were made on a total number of 967 boards of Norway spruce with varying dimensions originating from Finland, Norway and Sweden. The non-destructive measurements included in this study were surface laser scanning, X-ray scanning and dynamic excitation, and were carried out both before and after planing of the boards. Results from X-ray scanning were used to calculated board density whereas surface laser scanning and dynamic excitation were used to determine in-plane fibre directions at longitudinal surfaces and axial resonance frequency, respectively. The destructive tests were made after planing.
The IP used for prediction of ft,0, herein denoted IPE,b, was based on a local MOE calculated by means of observed fibre
directions and dynamic MOE (Edyn). Coefficients of determination between ft,0 and IPE,b of 0.65 and 0.66 (linear regression)
were obtained using measurement results before and after planing, respectively, see Figures 1a and 1b. Applying Edyn,
which is used by several grading machine as IP for prediction of ft,0, resulted in a coefficient of determination (r2) of 0.46
for ft,0, both before and after planing.
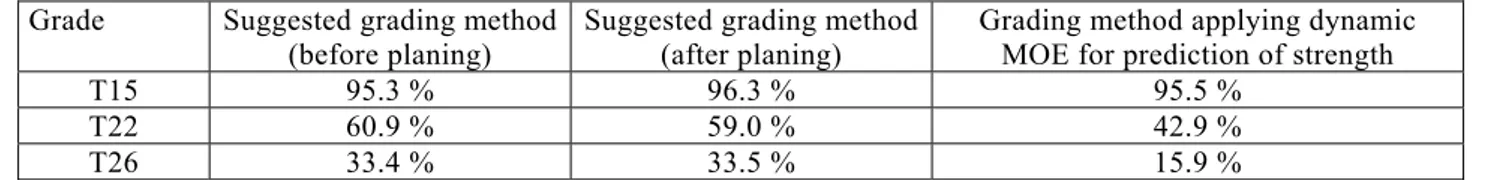
Table 1 gives calculated yield in three different strength classes using the suggested grading method applying IPE,b for
prediction of ft,0. This table also includes the calculated yield for a grading machine applying Edyn for prediction of ft,0. The
yield obtained using IPE,b rather than Edyn for prediction of ft,0 is much higher, particularly for high strength classes.
Figure 1: Scatters between ft,0 and IPE,b. Included in each scatter are r2 and standard error of estimate (SEE).
Table 1 : Yield in strength classes (single grade).
Grade Suggested grading method
(before planing) Suggested grading method (after planing) Grading method applying dynamic MOE for prediction of strength
T15 95.3 % 96.3 % 95.5 %
T22 60.9 % 59.0 % 42.9 %
T26 33.4 % 33.5 % 15.9 %
References
[1] A. Olsson, J. Oscarsson, E. Serrano, B. Källsner, M. Johansson & B. Enquist: Prediction of timber bending strength and in-member cross-sectional stiffness variation on the basis of local wood fibre orientation. European Journal of
Wood and Wood Products, 71 (2013), 319-333.
a) b) IP
E,b after planing IPE,b before planing
ft,0 (MPa ) ft,0 (MPa )
IPE,b (GPa) IPE,b (GPa)
Linear regression: r2 = 0.661 SEE = 6.79 MPa Non-linear regression (second order polynomial): r2 = 0.697 SEE = 6.42 MPa Linear regression:
r2 = 0.647 SEE = 6.93 MPa Non-linear regression (second order polynomial): r2 = 0.677 SEE = 6.63 MPa