Camilla Ekström
Astrid Linder
Fatally injured cyclists
in Sweden 2005–2015
Analysis of accident circumstances, injuries
and suggestions for safety improvements
VTI notat 5A-2017
|
F
atally injur
ed cyclists in Sweden 2005–2015
www.vti.se/en/publications
VTI notat 5A-2017
Published 2017
VTI notat 5A-2017
Fatally injured cyclists
in Sweden 2005–2015
Analysis of accident circumstances, injuries and
suggestions for safety improvements
Camilla Ekström
Diarienummer: 2014/0233-22 Omslagsbilder: Mostphotos Tryck: VTI, Linköping 2017
Preface
This study was financed by the Swedish Innovation Agency (VINNOVA) in the VINNMER Marie Curie Fellowship project “Traffic Safety for Him and Her: Enhanced injury protection for vulnerable road users”. An analysis of fatally injured cyclists in Sweden documented in the Swedish Road Administration’s in-depth study database was performed in autumn 2015 and spring 2016. Special thanks to Carina Teneberg, Magnus Lindholm, Joakim Elfving, Kenneth Svensson, Ruggero Ceci and Jörgen Persson at the Swedish Road Administration for access to and support with the in-depth study database as well as content review. Thanks also to Elisabet Agar for thorough language and content review.
Gothenburg, March 2017
Astrid Linder Project Leader
Quality review
Internal peer review was performed on the 5 October 2016 by Jenny Eriksson. Camilla Ekström has made alterations to the final manuscript of the report. The Research Director Jonas Jansson examined and approved the report for publication on 6 February 2017. The conclusions and recommendations expressed are the authors’ own and do not necessarily reflect the opinion of VTI as a government authority.
Kvalitetsgranskning
Intern peer review har genomförts 5 oktober 2016 av Jenny Eriksson. Camilla Ekström har genomfört justeringar av slutligt rapportmanus. Forskningschef Jonas Jansson har därefter granskat och godkänt publikationen för publicering 6 februari 2017. De slutsatser och rekommendationer som uttrycks är författarnas egna och speglar inte nödvändigtvis myndigheten VTI:s uppfattning.
Table of contents
Summary ...7 Sammanfattning ...9 1. Introduction ...11 2. Aim ...12 3. Method ...13 3.1. Data ...133.2. Categorisation of accident type and sub-categories ...13
3.3. Age ...14
3.4. Area type and accident location ...14
3.5. Categorisation of injuries to body regions ...15
3.6. Helmet usage ...16
3.7. Influence of alcohol ...16
3.8. Categorisation of type of bicycle, cyclist and cycling occasion...17
3.8.1. Type of bicycle ...17
3.8.2. Type of cyclist and cycling occasion ...18
3.9. Possible accident contributing or common factors ...19
4. Results ...20
4.1. Accidents and fatalities ...20
4.2. Accident types and distribution ...21
4.3. Annual and daily distribution of fatalities ...22
4.4. Age and gender distribution ...23
4.5. Accident location ...25
4.6. Injured body regions ...27
4.7. Helmet usage ...28
4.8. Influence of alcohol ...31
4.9. Type of cyclist and cycling occasion ...33
4.10. Possible accident contributing and common factors ...34
5. Discussion ...35
5.1. Distinct groups and categorisation ...35
5.2. Injuries and helmet usage ...35
5.3. Possible contributing factors to the accidents ...36
5.4. Limitations and outlook ...36
References ...39
Appendix 1 ...41
Summary
Fatally injured cyclists in Sweden 2005–2015. Analysis of accident circumstances, injuries
and suggestions for safety improvements
by Camilla Ekström (VTI) and Astrid Linder (VTI)
Cycling is part of the sustainable transport system and plans are in place to increase this part of the transport system in Sweden, Europe as well as globally. Improving the safety for this group of road-users is of great importance. The aim of this study was to identify patterns among fatally injured cyclists in Sweden, in order to suggest general safety improvements or improvements addressing different groups of cyclists as well as specific traffic conditions.
The information was sourced from the in-depth study database of fatalities as well as the joint register for police and hospital injury and accident data, STRADA, in Sweden. Data was analysed and
interpreted for an 11 year period from 2005–2015. The in-depth study of the fatalities provided details about the accidents and individuals involved in the accident and the information was retrieved by parameter values, in free text description and documents in the database. STRADA was used to sort official data within the in-depth study, assigning codes for accident type, complementing parameters and additional parameters.
A total of 271 fatalities were identified and analysed where the majority of the accidents occurred during spring–autumn. Male fatalities accounted for two-thirds of the studied cases and in ages above 40, male fatalities are twice as many as female fatalities. Fatalities in Motor vehicle accidents are distributed in all age groups, while in the Single bike and Other bike category, there were no children and only a few young adults reported. The highest amount of fatalities was found to be of accident type Motor vehicle and location type Crossing in urban areas, followed by accident location type
Stretch of road in rural areas. The majority of adult and senior fatalities involve males in conflict with
cars and males in single bicycle accidents. Other distinct groups include senior males in intersections with conflicting cars and adult females in intersections with conflicting heavy vehicles.
Among the fatalities, 82 per cent had received at least one fatal or severe head injury regardless of accident type. Head and neck injuries were more common among fatalities in Motor vehicle accidents in the Car category compared to Heavy vehicle and Single category, while torso injuries were more common in accidents in the Heavy vehicle category followed by accidents in the Car category than
Single accidents category.
Helmet usage among the fatalities was low, 17 per cent compared with 38 per cent for the whole population. Helmet wearing fatalities were found in the accident type Car and Single in rural areas and in the Heavy vehicle category in urban areas.
Being under the influence of alcohol was found to be twice as common among male fatalities as female fatalities. Half of the male fatalities that had occurred during the evening/night were found to be under the influence compared to 10 per cent during daytime.
Two general partial accident causes regardless of accident type were alcohol and darkness. Confusion about priority rules in intersections was present in half of the motor vehicle accidents. For accident type Single, high speed and the bicycle coming to a halt unexpectedly were common. The influence of road surface was reported in a few cases.
Areas for safety improvements identified based on the results of this study include: visibility both night and day, co-operation among road-users, infrastructure, vehicle improvements and bicycle helmet wearing.
Sammanfattning
Omkomna cyklister i Sverige 2005–2015. Analys av omständigheter och skador vid olyckor samt förslag på förbättringar av säkerheten.
av Camilla Ekström (VTI) och Astrid Linder (VTI)
Cykling är en del av det hållbara transportsystemet och det finns planer för att utöka denna grupp i transportsystemet i Sverige, Europa samt globalt. Förbättringar av säkerheten för denna trafikantgrupp är därför av stor betydelse. Syftet med denna studie var att identifiera mönster bland dödligt skadade cyklister i Sverige, för att kunna föreslå allmänna säkerhetsförbättringar eller förbättringar som riktar
sig till särskilda grupper av cyklister eller särskilda trafikförhållanden.
Studien grundar sig på information ur Trafikverkets djupstudiedatabas samt det gemensamma registret för polis och sjukhus gällande skador och olycksdata i Sverige, STRADA. Data över en 11 år lång period 2005–2015 analyserades och tolkades. Djupstudiedatabasen ger detaljerad information om olyckan och inblandade individer och både parametervärden, fritext beskrivningar och dokument ur databasen har använts. STRADA har använts för att sortera ut de officiella olyckorna ur
djupstudiedatabasen, tilldela koder för olyckstyper samt för komplettering av saknade parametrar. Sammanlagt 271 dödsfall identifierades och analyserades, där majoriteten av olyckorna inträffade under perioden vår-höst. Två tredjedelar av de undersökta dödsfallen var män och i åldrarna över 40 var män dubbelt så många som kvinnor bland dödsfallen. Dödsfall i olyckskategorin Motorfordon förekommer i alla åldersgrupper, medan det i kategorin Singel och övriga cykelolyckor inte fanns några barn och endast ett fåtal unga vuxna rapporterade.
Den största gruppen av dödsfall konstaterades vara av olyckstypen Motorfordon med platstypen
Korsning i tätbebyggt område, följt av platstypen Länk i ej tätbebyggt område. Majoriteten av vuxna
och äldre dödsfall involverar män i konflikt med Bil och män i singelolyckor med cykel. Andra distinkta grupper är äldre män i korsning i konflikt med bil och kvinnor i korsningar i konflikt med tungt fordon.
Bland dödsfallen hade 82 procent fått minst en dödlig eller allvarlig skallskada oavsett olyckstyp. Huvud- och nackskador var vanligare förekommande i kategorin motorfordonsolyckor med bil, jämfört med olyckor med tungt fordon eller singelolyckor. Å andra sidan var skador i torsoregionen något vanligare i motorfordonsolyckor med tungt fordon än i kategorierna motorfordonsolyckor med bil och singelolyckor.
Hjälmanvändning bland dödsfallen var låg, 17 procent jämfört med 38 procent för hela befolkningen. Dödsolyckor med hjälmbärande cyklister påträffades för olyckstyperna Bil och Singel i områdestyp ej tätbebyggt område och för olyckstypen Tungt fordon i områdestyp tätbebyggt område.
Förekomst av alkohol visade sig vara dubbelt så stor bland manliga dödsfall än kvinnliga. Hälften av de manliga dödsfallen som inträffat under kvälls-/nattetid var påverkade av alkohol jämfört med 10 procent under dagtid.
Bland bidragande olycksfaktorer, oavsett olyckstyp, så var alkohol och mörker de vanligaste. I hälften av motorfordonsolyckor vid korsningar var tveksamhet gällande väjningsplikt den mest
före-kommande bidragande olycksfaktorn. För singelolyckor var hög hastighet och oväntat stopp vanliga faktorer, inverkan av underlaget inrapporterades i enstaka fall.
Förbättringar för ökad säkerhet baserat på resultaten i denna studie ligger inom områden som; synlighet både natt och dag, samspel mellan trafikanter, infrastruktur, fordonsförbättringar samt användning av cykelhjälm.
1.
Introduction
Cycling is an environmentally friendly type of transport that is beneficial to health and an important part of a modern and future sustainable transport system. In Sweden, Europe as well as globally there are numerous plans to increase cycling in the transport system. One important aspect of cycling is to improve safety for the cyclists. Increasing the safety for cyclists, and achieving national traffic safety goals, regardless of increased cycling activity is a big challenge for traffic safety in Sweden
(Trafikverket 2014). Currently (2016) around 270 road users are killed each year in road traffic in Sweden. Based on statistics over the years 2005-2015 cyclists constitute for around 25 fatalities each year, corresponding to approximately 10 per cent.
The population of Sweden is, in the year 2017, 10 million with the south being most densely populated, particularly around the three largest cities Stockholm, Gothenburg and Malmö.
During the years 2005–2015, 3,735 accidents of fatal or severe personal injury to a cyclist in Sweden was reported by the police (SIKA Statistik 2006–2009, Trafikanalys 2010–2016), see Appendix 1 for more details. In these accidents, 290 road users were fatally injured out of which 281 were cyclists. Statistics based on police reported accidents are published annually by the governmental agency Transport Analysis, TRAFA. Figure 1 shows the official statistics of fatally injured cyclists from 2005–2015 (Trafikanalys 2016).
Figure 1. Official statistics of fatally injured cyclists in Sweden from 2005–2015.
All fatal road accidents in Sweden are investigated in-depth by the Swedish Road Administration, based on the field investigation, vehicle information, police report, medical journal, certificate of death and the autopsy protocol, in order to establish what happened before, during and after the accident. The information in this in-depth study database is used by the Swedish Road Administration as well as other authorities and organisations to increase the understanding of the sequence of events in order to improve traffic safety. The database is accessible for research purposes with on-site access and specific permission.
2.
Aim
The aim of this study was to identify patterns among fatally injured cyclists in the road transport system in order to identify potential safety improvements. The safety improvements could be of general character or addressing different groups of riders as well as for specific conditions. Swedish accident data from 2005–2015 formed the basis for this study.
Cyclist fatally injured in accidents with trains or trams were excluded as well as fatally injured electrical wheelchair users, which are labelled as cyclists in the database.
3.
Method
3.1.
Data
This study was based on data from the in-depth study database (ISDB) holding information about all fatal accidents in Sweden. The ISDB was created and is owned by the Swedish Road Administration. After receiving permission following a formal application, the Swedish Road Administration provided an extraction of all accidents during the years 2005–2015 involving at least one cyclist, as well as on-site access to the ISDB to study parameters described below and related documentation and photos. Furthermore, data from police reported accidents for official statistics during the same time span, 2005–2015, for fatally injured cyclists in Sweden were extracted from the web-based Swedish Traffic Accident Data Acquisition (STRADA), owned by The Swedish Transport Agency. This accident information was mainly used for cataloguing and comparing accidents and parameters from the extraction in the ISDB, as well as to complement extracted parameters in the ISDB, if needed. Figure 2 gives a general schematic of data used.
Figure 2. Schematic picture of data, size of arrows proportional amount of contributed parameters.
Accidents involving at least one fatally injured cyclist were extracted from the ISDB. To identify and exclude fatalities caused by natural death, a comparison was made between the fatalities in the ISDB and the polis reported fatalities presented in STRADA. Only police reports that are considered material for the yearly published Swedish statistics of road traffic injuries by TRAFA are used. Extracted parameters include accident type, time and date of accident, age and gender of cyclist, helmet usage, conflicting vehicle, road type, alcohol influence, measured alcohol levels and type of journey.
The date and time of accident was mainly taken from the ISDB. If the time parameter was empty or not known, the matched STRADA police report was used. If unknown in both the ISDB and in the STRADA police report the time parameter remain unknown. To simplify the time analysis in this study the timing of accidents was rounded to the nearest whole hour.
3.2.
Categorisation of accident type and sub-categories
The accidents were categorised into the three major accident types Motor vehicle, Single bike or Other
bike accidents. Accidents involving more than one road user were further sub-categorised according to
the type of conflicting road user involved.
The accident type Motor vehicle comprised accidents from the ISDB labelled “cycle/moped in
collision with motor vehicle” and accidents labelled “various” with another motor vehicle described in the investigation. Based on the vehicle description, the accident type Motor vehicles were
sub-categorised into Car, MC and Heavy vehicle. The accident type Single bike comprised accidents from the ISDB labelled “bicycle/moped/pedestrian accident” and “various” when no other road-user had
Matching
accidents
In-depth
study
database
STRADA
(police
reports used
for yearly
statistics)
been involved in the accident. The final accident type Other bike comprised
“bicycle/moped/pedestrian accident” and “various” when another non-motor vehicle road-user was involved.
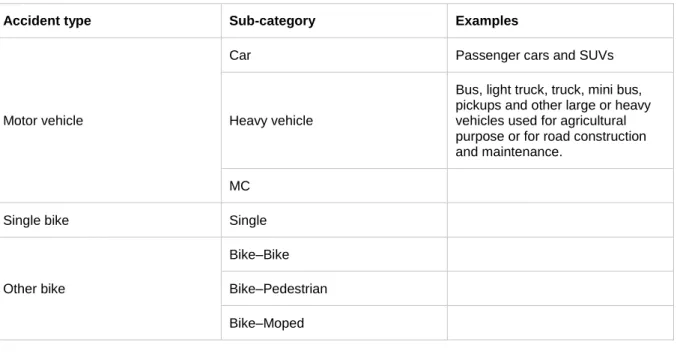
The accident types and sub-categories are summarised in Table 1 below.
Table 1. Accident types and sub categories.
Accident type Sub-category Examples
Motor vehicle
Car Passenger cars and SUVs
Heavy vehicle
Bus, light truck, truck, mini bus, pickups and other large or heavy vehicles used for agricultural purpose or for road construction and maintenance.
MC
Single bike Single
Other bike
Bike–Bike Bike–Pedestrian Bike–Moped
3.3.
Age
All fatalities were categorised into the age categories Child, Adult and Senior, see criterion in Table 2. For certain parts of the analysis the age was also rounded downwards to the closest tenth to create age distribution.
Table 2. Age categories and criterions.
Age category Age of fatally injured cyclist
Child 0–17
Adult 18–64
Senior 65+
3.4.
Area type and accident location
The area type for the accident location is labelled as rural or urban areas in the ISDB. If this parameter was missing in the database, e.g. left empty, not chosen, or if unknown or other was selected, then information from the STRADA police reports of matching accidents was used.
To categorise each accident location all available information in the ISDB and in STRADA was considered, i.e., accident descriptions, evaluation of photos or sketches of the scenes of the accident, evaluation of the type of road and related comments about road type in the ISDB as well as
consideration of the accident locations in the STRADA police report for matching accidents. The categories for the accident location are listed in Table 3 together with selection criteria and examples.
Table 3. Categories for accident location and related criteria and examples.
Accident location Criteria and examples
Stretch of road Accident occurring on a road link in an urban or rural environment.
Crossing Accident occurring in any 3 or 4-way crossings between roads. Crossings between roads and pedestrian and/or bike lanes. Accidents in roundabouts.
Pedestrian and/or bike lane
Accidents occurring on pedestrian and/or bike lanes or pavements
Other Not known or difficult to interpret accident location, i.e., square or park area
3.5.
Categorisation of injuries to body regions
The information in the ISDB regarding injuries may come from several sources, such as autopsy protocol, certificate of death and STRADA police report. For some accidents, these sources are only referenced to, for others they are appended to the individual database records. The categorisation of injuries is mostly based on the summarised information in the database. In those cases, where the database record lacks detailed information on injuries but there are appended references, these references have been summarised to provide categorisation of injured body regions. A post-mortem autopsy was performed on more than 75 per cent of the 271 fatally injured cyclists. Figure 3 gives a schematic description for the process of determining body regions with fatal or severe injury. Severe injuries in this study were related to the risk of death given an injury to the part of the body, thus fractures to extremities or bleeding and laceration of skin are examples of injuries not considered as severe. Examples of fatal and severe injuries include: skull fractures, bleeding, swelling and tearing of the brain, vertebra fractures, spinal cord damage or rupture, organ rupture, bleeding from larger vessels, major skeletal damage and suffocation.
The considered injuries were sorted into three different body regions: Head, Neck and Torso. A fatally injured cyclist can have sustained fatal and/or severe injuries in all three body regions. The number of injuries in each region was not considered. The criteria for injured body regions were therefore at least one fatal or severe injury situated in of the above mentioned body regions.
Figure 3. Process of determining body regions with fatal or severe injury.
3.6.
Helmet usage
Helmet usage among the fatalities was divided into the groups as per the criteria in Table 4 below.
Table 4. Criteria for categorising helmet usage among fatalities.
Helmet usage Criteria
Yes Fatally injured cyclist wore helmet at the time of accident.
No Fatally injured cyclist did not wear helmet at the time of accident.
Came off Fatally injured cyclist wore loose/unbuttoned helmet or the helmet came off partly or completely at the time of the accident.
Unknown No information about helmet usage.
3.7.
Influence of alcohol
The influence of alcohol among the 271 fatally injured cyclists was based on measured alcohol concentrations retrieved from the ISDB, regardless of sample type (blood, urine or eye fluid). The threshold 0.2 ppm, was considered a positive test result together with the in-depth investigators positive notation about alcohol in the database. The measured alcohol concentration levels were most often taken from autopsy protocol or analysed tests taken by the police on-site. See Table 5 for
distribution of fatalities tested for alcohol. The fatalities were also categorised according to the time of
accident, morning/day/afternoon (03:00–20:59) and in to evening/night (21:00–02:59), as well as by
gender and accident type. Autopsy protocol
Including summarised description of injuries by medical examiner performing
the autopsy Certificate of death or Medical journal From hospital STRADA Police report or Hospital report
Fatal injuries or summary of injuries in the in-depth
study database
Summary of fatal and severe injuries
Body regions with fatal or severe injury
Table 5. Number of fatalities tested for alcohol.
Tested for alcohol with a measured concentration or with a reference to autopsy protocol or forensic toxicology statement.
191
Not tested, not relevant, data missing or no reference to autopsy protocol or forensic toxicology statement.
80
Total: 271
Suspected influence of alcohol was also investigated as a category by extending the criteria to include all road users in an accident. Not only the measured alcohol concentration above the threshold were used, but also remarks about suspected alcohol intake found in the accident documentation was considered, including statements from the in-depth investigator, witnesses, police or other rescue personnel, for example. See the criteria for the different categories in Figure 4 below.
Figure 4. Criteria for different categories of involvement of alcohol.
3.8.
Categorisation of type of bicycle, cyclist and cycling occasion
Categories of bicycle, cyclist and cycling occasion for each fatally injured cyclist was made based on the material in the ISDB.
3.8.1. Type of bicycle
Existing photos of the bicycle involved in an accident or the description of brand and model was used to catalogue the bicycles as Road bike, Mountain bike, Standard bike, Child bike and Unknown. The group Standard bike includes hybrid and city bicycle models. Listed below are some guidelines for categorisation.
Road bike - of new and older types, drop handlebars, narrow and smooth tyres without parcel carrier or mudguard.
Mountain bike - off road tyres, shock absorber, without mudguards and flat handlebar with or without bar ends.
In-depth investigator notes Influence of alcohol = Yes Autopsy protocol or police reports Concentration ≥ 0,2ppm
Witnesses, police report or description of the accident event in the in-depth documentation
indicating any influence of alcohol
OR
In-depth investigation or assumption of influence of alcohol = Yes, and alcohol concentration regardless of test type ≥ 0,2 ppm
Fatally injured cyclist under influence at the time
of accident
Influence of alcohol suspected in fatal accident
Standard bikes - male and female type, normal tyres, with mudguards and parcel carrier and/or basket, handle bars are flat or curved. For hybrids and city bicycles the appearance of the bicycle is usually sportier and the tyres can be of more specialised character, thinner on race hybrids and thicker for city bicycles. The handle bar for hybrids and city bikes is usually of flat type.
Child bike - this group includes any type of bicycle model for children, from small tricycles to sportier mountain bikes and BMXs for teenagers.
3.8.2. Type of cyclist and cycling occasion
The type of bicycle rider involved in the accident was categorised by age according to criteria
described in Section 3.3. The group Adult was further sorted as Commuter, Exerciser or Unknown, see Table 6 below. When cataloguing the adult bicycle riders, the time and place of the accident was considered as well as the overall impression from the material documented for each investigation. Descriptions from witnesses, or relatives and friends, may have contributed with information to the police investigation. Strict time frames were not adhered to and fixed questions were not asked. Only guidelines for when commuters were more likely to ride bicycles as well as general times for
exercising were looked at.
Examples of assumptions applied include that commuting generally takes place in the morning and afternoon from Monday to Friday and that exercising is more likely to take place on weekends or after working hours from Monday to Friday. Outdoor exercising on Road bikes is seasonal and more common during spring to autumn. The number of commuters has also been assumed to be higher during this season, but unlike Exercisers they have been assumed to use the roads throughout the year.
Table 6. Type of cyclist categories.
Age Type of cyclist
0–17 Child 18–64 Adult Exerciser Adult Commuter Adult Unknown 65+ Senior
The Unknown group include cases where the victims have been assumed to be leisure riders, errand riders as well as cases lacking information of the purpose for the individual being on the road. The categorisation was selected based on the ISDB parameter type of journey together with conclusions as to why the individual was riding the bicycle based on the ISDB documentation. Examples of
assumptions made in the cataloguing process include bicycle riders under the influence of alcohol and that rides taking place during weekday and weekend night-time are not for commuting or exercising purposes and was therefore usually catalogued as Unknown.
3.9.
Possible accident contributing or common factors
In the ISDB records, there are remarks and comments of a general type regarding possible factors that may have caused the accident. Some of these factors have been considered as having an actual
influence, and have been given a resolution plan and are subsequently followed-up. Others are more of a hypothetic nature, but still considered important enough to be included in the reports.
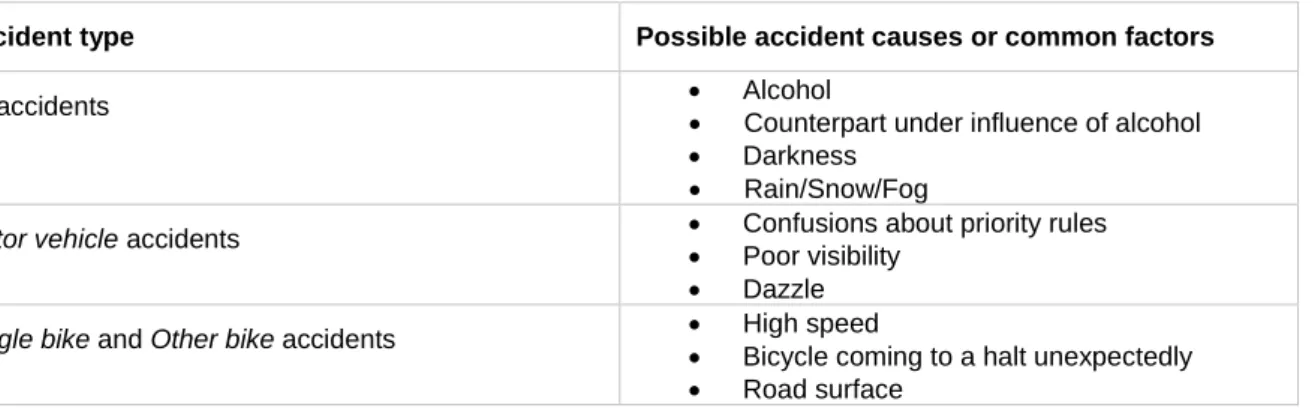
Together with other database parameters these types of comments and remarks have been categorised to identify possible contributing factors to the accident. One single accident can involve many factors as well as none of the factors listed in Table 7.
Table 7. Possible partial accident causes and common factors for different accident types.
Accident type Possible accident causes or common factors
All accidents Alcohol
Counterpart under influence of alcohol Darkness
Rain/Snow/Fog
Motor vehicle accidents Confusions about priority rules
Poor visibility Dazzle
Single bike and Other bike accidents High speed
Bicycle coming to a halt unexpectedly Road surface
4.
Results
4.1.
Accidents and fatalities
In total 317 traffic accidents involving cyclists, with a total of 320 fatalities, were available in the ISDB during the years 2005–2015, out of which 11 accidents resulting in 12 fatalities were excluded since the involved fatally injured road user was a pedestrian, a motorcyclist or user of an electrical wheelchair and one cyclist due to natural death. Furthermore, 3 train/tram accidents fatally injuring 3 cyclists were excluded as well. Out of the remaining 303 accidents causing 305 fatalities, a further 34 accidents causing 34 fatalities were excluded due to natural death, leaving a total number of 269 accidents and 271 fatalities suitable for further analysis. The distribution of all fatalities can be seen in Table 8 and the annual distribution of the analysed 271 fatalities is shown in Table 9.
Table 8. Distribution of reported fatalities in accidents including one cyclist during the years 2005– 2015.
Fatalities Number
Analysed cyclists included in this study 271
Excluded cyclists in collision with train or tram 3
Excluded cyclists due to natural death 35
Excluded pedestrians 6
Excluded motorcyclist 1
Excluded electrical wheelchair users 4
Total 320
Table 9. Annual distribution of the studied fatalities from the in-depth study database. N=271.
2005 2006 2007 2008 2009 2010 2011 2012 2013 2014 2015
4.2.
Accident types and distribution
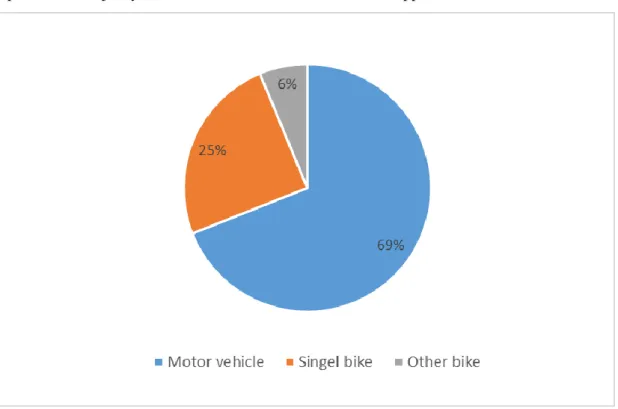
The distribution of the 271 fatally injured cyclists is shown below in Figure 5 according to accident type and in Figure 6 divided into sub-categories. The sub-categories Car, Heavy vehicle and Single represent the majority of the fatalities. For more details, see Appendix 2.
Figure 5. Distribution of fatalities according to accident types Motor vehicle, Single bike and Other bike. Total number of fatalities N=271.
4.3.
Annual and daily distribution of fatalities
The monthly and hourly distribution of the 271 fatalities is presented below in Figure 7 and Figure 8 where the accident types Single bike and Other bike have been merged into one group. For one accident in the ISDB a correction of the accident date had to be made due to a suspected typing error, using the accident date from STRADA instead. Seventeen accidents have been complemented with accident time from STRADA and the timing of 3 accidents remains unknown.
The total monthly distribution in Figure 7 shows that the peaks for fatal accidents occur during spring to autumn, during which time of the year cycling is most common (Niska et al. 2013). Comparing motor vehicle accidents with the group Single and Other bike accidents shows that the peak for these groups is in June and August instead of April to October.
Figure 7. Annual distribution of fatalities according to accident type. N=271.
The hourly graph in Figure 8 shows that the fatal accidents mainly took place during daytime and that there are peaks around the commuting hours in the morning and afternoon.
Figure 8. Hourly distribution of fatalities according to accident type. In Total N=271, Motor Vehicle accidents N=187 and in Single and other bike accidents N=84.
4.4.
Age and gender distribution
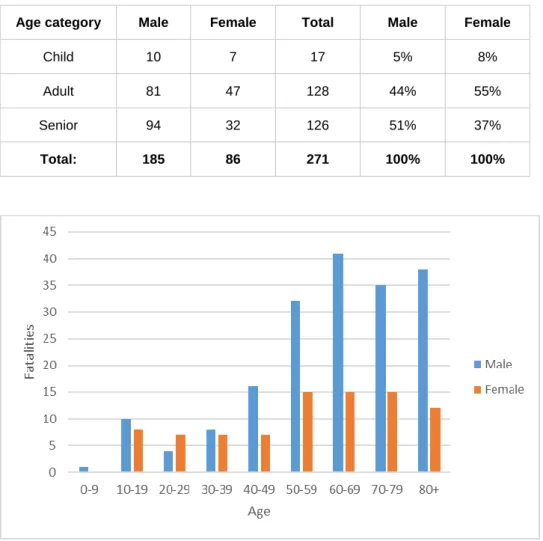
The distribution of age categories and gender can be seen in Table 10 and in steps of tens in Figure 9.
Table 10. All studied fatalities catalogued according to age categories and gender.
Age category Male Female Total Male Female
Child 10 7 17 5% 8%
Adult 81 47 128 44% 55%
Senior 94 32 126 51% 37%
Total: 185 86 271 100% 100%
Figure 9. Age and gender distribution of the 271 fatalities.
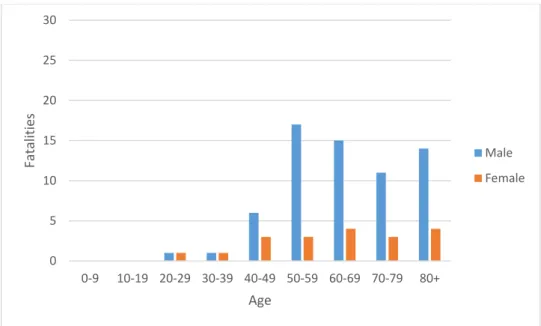
The age and gender distribution according to accident type are presented in the figures below. Figure 10 shows the distribution for Motor vehicle accidents and Figure 11 distribution for the combined category Single bike and Other bike accidents.
Figure 10. Age and gender distribution of fatalities in Motor vehicle accidents. N=187.
Figure 11. Age and gender distribution of Single bike and Other bike accidents. N=84. 0 5 10 15 20 25 30 0-9 10-19 20-29 30-39 40-49 50-59 60-69 70-79 80+ Fat alit ie s Age Male Female
4.5.
Accident location
In Figure 12 and Figure 13 below, the accident location, gender of the fatalities and location in an urban or rural environment is shown for the 271 fatalities in Motor vehicle accidents as well as for
Single bike and Other bike accidents together. For detailed information see Appendix 2.
Figure 12. Distribution of fatalities according to accident location, gender and type of area in Motor vehicle accidents. N=187.
Figure 13. Distribution of fatalities according to accident location, gender and type of area in single and other bike accidents. N=84.
The distribution among the fatalities divided into the largest age groups (Adult and Senior) as well as the largest accident type subcategories (Car, Heavy vehicle, Single and Other bike accidents) can be seen in Table 11 and Table 12. Accidents with age group Child and accident type subcategory
Table 11. Distribution of fatalities for accident location, area type, gender and age group for Motor vehicle accidents (Car/Heavy vehicle).
Motor vehicle accidents
Urban Rural
Accident location
Age group Male Female Male Female
Stretch of road Adult 8 (6/2) 3 (2/1) 12 (9/3) 10 (9/1)
Senior 10 (5/5) 5 (5/-) 15 (10/5) 3 (2/1)
Crossing Adult 21 (10/11) 19 (5/14) 10 (8/2) 4 (3/1)
Senior 17 (14/3) 12 (9/3) 14 (12/2) 1 (1/-)
Pedestrian and/or bike lane
Adult 1 (1/-)
Senior
Other Adult
Senior 1 (-/1)
Total: 57 40 51 18
Table 12. Distribution of fatalities for accident location, area type, gender and age group for single and other bicycle accidents. (Single/Other bike accidents.
Single accident and other bicycle accidents
Urban Rural Other
Accident location
Age group
Male Female Male Female Male Female
Stretch of road Adult 7 (5/2) 1 (1/-) 5 (5/-) 5 (5/-) 1 (1/-)
Senior 11 (10/1) 4 (4/-) 1 (1/-) 2 (2/-) 1 (1/-) Crossing Adult 2 (2/-) Senior 2 (-/2) Pedestrian and/or bike lane Adult 16 (11/5) 3 (1/2) 2 (1/1) 1 (1/-) Senior 8 (6/2) 1 (1/-) 1 (-/1) 1 (1/-) Other Adult 2 (2/-) 1 (1/-) 1 (1/-) Senior 2 (1/1) 1 (1/-) 1(1/-) 1 (1/-)
4.6.
Injured body regions
In general, post-mortem autopsies were made on a higher ratio of fatalities in motor vehicle accidents than on single and other bicycle accident fatalities. Figure 14 shows the occurrence of injured body regions Head, Neck and Torso (as described in Section 3.5) for fatalities in each accident type as well as the total distribution of fatalities according to accident type.
Figure 14. Occurrence of injured regions and total distribution of fatalities according to accident type. See Appendix 2 for more details.
The occurrence of injured body regions of all fatalities in each age group as well as the total number of fatalities in the accident type Motor vehicle are shown in Figure 15. Figure 16 shows the
corresponding results for the accident type Single and Other bike accidents. Results for age groups with few fatalities are excluded from the figures.
Figure 15. Injured body region occurrence in motor vehicle accidents according to the age of the fatalities. N=187. See Appendix 2 for more details.
Figure 16. Injured body region occurrence in Single and Other bike accidents according to the age of the fatalities. N=84. See Appendix 2 for more details.
4.7.
Helmet usage
Figure 17 shows the helmet usage among all 271 fatalities. In Figure 18 and Figure 19 the helmet usage is shown according to accident type and type of area. Figure 20 and Figure 21 shows the distribution of helmet usage according to the age of the fatalities together with distribution of head injuries for the Motor vehicle, Single and Other bike accidents.
Figure 18. Helmet usage among fatalities in motor vehicle accidents. N=187.
Fatalities in the accident type Heavy vehicle in urban areas wearing a helmet were exposed to great forces due to the energy of the larger vehicle, causing major injury to all body regions. Among the fatally injured helmet wearers in accident type Car, 15 of 18 fatalities showed injury to more than one body region. Of 84 non-helmeted fatalities in accident type Car, 78 did receive an injury to the head, out of which 27 only had head injuries.
Figure 19. Helmet usage among fatalities in single and other bicycle accidents. N=84.
Helmet wearers in Single accidents were represented by Senior and Exercising adults. For 8 of 10 fatalities wearing a helmet in the Single accident category, high speed or riding for exercise was indicated in the accident documentation. Of 56 non-helmeted fatalities in Single and Other bike
accidents, 50 received a head injury and 34 of these only a head injury. None of the fatalities who were under the influence of alcohol in the Single and Other bicycle accidents wore a helmet.
Figure 20. Helmet usage according to age for fatalities in Motor vehicle accidents. N=187.
4.8.
Influence of alcohol
Out of the 271 fatalities 17 fatally injured children were excluded as they were not under the influence of alcohol, nor were they killed in accidents involving other road users under the influence of alcohol. Through investigation of the Adult and Senior group alcohol was noted in 43 out of 254 fatalities. See table in Appendix 2 for distribution according to accident type and gender. Thirty-five of the 43 fatalities were males. Analysing males and females separately revealed that alcohol was noted in 20 per cent of male fatalities compared to 10 per cent for female fatalities.
Table 13 shows the distribution among fatally injured cyclists with alcohol concentrations ≥0.2 ppm according to gender, accident type and time of accident. Time of accident is divided into the groups morning/day/afternoon and evening/night.
Table 13. Distribution of fatalities under the influence of alcohol according to gender and time of accident.
All fatalities: Adult + senior
Fatalities: Adult + senior & ≥0.2ppm
Distribution of fatalities under the influence of
alcohol [%] Total Accident time 21:00–02:59 Total Accident time 21:00–02:59 Accident time 03:00–20:59 Accident time 21:00–02:59 Accident
Type Male Female Male Female Male Female Male Female Male Female Male Female
Motor vehicle 110 60 12 3 16 3 6 0 10% 5% 45% 0% Single and Other 65 19 17 4 13 3 8 2 10% 7% 47% 50% Total: 175 79 29 7 29 6 14 2 11% 6% 46% 29%
The total number of Adult and Senior fatalities under the influence of alcohol can be seen in Figure 22 for males and Figure 23 for females, showing the distribution for Yes and Confirmed 0.2 ppm level or
above divided into the groups morning/day/afternoon and evening/night. Fatalities where alcohol has
Figure 22. Number of male cyclists with confirmed alcohol level.
Figure 23. Number of female cyclists with confirmed alcohol level.
The occurrence of alcohol in the accident is presented in Table 14 below. Among Adults and Senior cyclists, alcohol may have been involved in 43 of the 254 fatalities. Of these 43 fatalities, 24 involved motor vehicles, out of which 5 fatalities were killed by drivers of motor vehicles under suspected or confirmed influence of alcohol. For single and other bicycle accidents there were 19 fatalities in total where alcohol may have been involved, 2 of 19 fatalities involved a driver of an other bike or moped under the influence of alcohol.
Table 14. Distribution of fatalities involving alcohol divided into accident type and gender.
Motor vehicle accident Single and Other bike accident Total Possible alcohol involvement in the accident
Male Female Male Female Male Female
Yes 20 4 15 4 35 8
No 90 56 50 15 140 71
Total 110 60 65 19 175 79
4.9.
Type of cyclist and cycling occasion
There is a significant variation in the photo documentation of bicycles in the in-depth study database for different types of accident. Table 15 below shows the number of bicycles photographed for each type of accident.
Table 15. Photographed bicycle in accident for different types of accident.
Type of accident Number of fatalities with documented bicycle photo
Motor vehicle 134 of 187
Single bike 12 of 67
Other bike 7 of 17
Total 153 of 271
In Table 16 and Table 17 the distribution of types of bicycle for different types of cyclist is shown. Among the 18 fatalities classed as Child, 7 fitted in to time-criteria for commuting. Even though the type Senior is not divided into sub-categories, it can be noted that 6 fatalities were identified as accidents during exercise.
Table 16. Types of bicycle in Motor vehicles accidents.
Types of bicycle
Type of cyclist Child bike Racer MTB Standard Unknown Total
Child 2 2 10 3 17 Adult exercise 6 1 1 8 Adult commuting 1 1 20 1 23 Adult unknown 1 1 46 11 59 Senior 4 49 27 80 Total: 3 12 4 126 42 187
Table 17. Type of cycle in Single and Other bike accidents.
Types of bicycle
Types of cyclist Child bike Racer MTB Standard Unknown Total
Child 0 Adult exercise 4 4 Adult commuting 1 1 2 1 5 Adult unknown 1 14 23 38 Senior 2 1 5 29 37 Total: 0 3 3 21 57 84
4.10. Possible accident contributing and common factors
Possible accident contributing and common factors among the same type of accident based on gathered documentation is presented in Table 18 below.
Table 18. Number of possible accident contributing and common factor. One fatally injured cyclist may correspond to zero or more contributing or common factors.
Accident type Possible accident contributing or common factors Number of fatalities Number of total fatalities in accident type group All accidents Alcohol 43 271 Counterpart under the influence of alcohol 7 Darkness 58 Rain/Snow/Fog 21
Motor vehicle accident
Confusion about
priority rules 94
187 Poor visibility 20
Dazzle 11
Single and other bicycle accident
Possible high speed 25
84 Bicycle coming to an
unexpected halt 9
5.
Discussion
An average of approximately 25 killed cyclists was reported annually in Sweden during the studied eleven-year period, with a slight decreasing trend in the annual distribution. The numbers are low and
therefore the variation from year to year varies greatly, during the studied period between 14–38
fatalities per annum. In order to reach the long-term goal of zero fatalities in the road transport system further efforts are needed to increase the safety for cyclists.
The majority of the fatalities occurred in accidents with motor vehicles (69%), including cars, heavy vehicles and motorcyclists. The remaining part comprises single bicycle accidents (25%) and other types of bicycle accidents (6%). Among the different types of accidents, three major groups are distinguished. These are accident types: Car, Heavy vehicle and Single, where the type Car represents nearly twice as many fatalities compared to each of the two other major types. The monthly
distribution reveals that the majority of the fatalities occur during spring – autumn, irrespective of the type of accident. The Single type has a more pronounced peak during the summer months than the fatalities in motor vehicle accidents. The distribution over the day shows that most fatalities occur during daytime, from 06:00 to 19:00.
Fatalities of males account for two-thirds of the cases. Above 40 years of age, fatalities among males are twice compared to females. Grouped by accident type, the largest proportion of males was found in the Single bike and Other bike accidents, where there were three times more males than females above the age of 50. The fatalities among females in these groups do not display the same increase from age group 40 to 50, compared to the fatalities among males. An important difference between accident types was that Motor vehicle fatalities were distributed in all age groups, while in Single bike and
Other bike there were no children and only a few young adults.
5.1.
Distinct groups and categorisation
Among the fatalities in motor vehicle accidents the majority occurred in the urban location Crossing and had an even gender distribution, followed by accident location Stretch of road in rural area in which twice as many males as females were killed. For single and other bicycle accidents the largest group of fatalities were males in urban areas in accident type Single with accident location Pedestrian
and/or bicycle lane or Stretch of road. Further analysis taking into account accident type, area type,
accident location, gender and age showed that the fatalities tended to fall into distinctive groups. In urban areas and motor vehicle accidents the largest groups of male fatalities were found to be senior males in crossings with conflicting car, whereas for adult females the largest group was in crossings with conflicting heavy vehicles. Adult males killed at accident location Crossing in urban areas was a distinct group with even distribution between Car or Heavy vehicle. In rural areas and motor vehicle accidents, conflicting cars were dominating. The largest group of females killed in rural areas was found in Stretch of road with conflicting car.
There was more photo documentation of bicycles involved in fatal Motor vehicle accidents compared to other accident types. This reflects that Single bike accidents are often not known to police or investigators until a later time after the accident occasion. The photos found showed that most fatalities rode a standard bicycle. A difference between Motor vehicle accidents and Single and Other
bike accidents was the larger number of fatalities of type Child and Adult commuting. There remains
however a large group in type Unknown, which consist of both leisure and errand rides as well as not known cycle occasions.
5.2.
Injuries and helmet usage
At least one fatal or severe head injury was sustained in a majority (82%) of all fatalities, regardless of accident type. The highest occurrence of head injuries was found in the category Car followed by
Car and twice as common as in Single, indicative of a greater energy in these crashes. Neck injuries
were twice as many in type Car compared to the other two accident types Heavy vehicle and Single. The distribution of injured regions for different age groups showed that head injuries were highly represented in all age groups and accident types, except for a small drop in accident type Motor
vehicle and age group 50–59. In accident type Motor vehicle neck and torso injuries decrease for ages above 40 respectively 60. For Single bike and Other bike accidents torso injuries were close to constant over the age groups above 40 while neck injury seams to fluctuate with a decreasing trend over ages 40 – 80+.
Helmet usage among the fatalities was low, less than 17 per cent, when the same helmet wearing distribution is assumed among the category unknown, compared to 38 per cent in general (Larsson 2016). In rural areas helmet wearers were mainly found in accident type Car and Single, and in urban areas in accident type Heavy vehicle. In general accidents of type Car and Heavy vehicle involves a great force towards the cyclist due to the energy of the conflicting vehicle, for which the protection of a helmet may be insufficient to prevent the fatality. In Single accidents, most cases of helmet wearing were coincident with notice of high-speed or exercising, also indicating higher energy at the time of the accident. Regardless of accident type there were few or no helmet wearers among the fatalities in
age groups 20–39 and above 80. Most fatalities wearing a helmet were in the age group 50–69. In a
few cases, remarks that the helmet possibly came off during the accident was noted.
5.3.
Possible contributing factors to the accidents
The amount of Adult and Senior fatalities under the influence of alcohol was 17 per cent. Gender analysis shows that it was twice as common among males compared to females. Half of the fatalities occurring during evening/night among Adult and Senior males were under the influence of alcohol. This is also found for female Adult and Senior fatalities during evening/night in accident type Single and Other bike. In accident type Motor vehicle, no female fatalities under the influence of alcohol during evening/night were found. During the remaining hours of the day, morning/day/afternoon,
about 5–10 per cent of the killed cyclists were under the influence of alcohol. In 43 of the 271
fatalities, alcohol may have been a possible contributing factor to the accident, regardless of which road user was under the influence of alcohol.
Alcohol and darkness were the two major possible contributing factors to the accidents. For half of the fatalities with accident type Motor vehicle confusion about priority rules in crossings seems to be a possible contributing cause. For fatalities in Single and Other bicycle accidents more than 25 per cent might be influenced by high speed and one-tenth due to the bicycle coming to a halt unpredictably. In very few cases the road surface appears to be a possible contributing cause.
5.4.
Limitations and outlook
The results presented in this report are of an exploratory type, they show how bicycle fatalities are distributed over different types of parameters. It does not include information on cyclists’ distribution or numbers in general, meaning that analysis of risk or conclusions regarding fraction of exposed cyclists could not be drawn from this material alone. The results do however indicate patterns among fatalities and identify groups of cyclists with common characteristics who are prevalent in the reported fatalities.
Prevention for cyclist fatalities should address several of the common characteristics or mitigate these groups. Characteristics that can be identified from the results in this study include visibility, co-operation among road-users, infrastructure, vehicle improvements and helmet usage. Since most fatalities occurred during daytime, it is important to consider daytime visibility which does not only
an important role, such as making priority rules easier to interpret in the traffic scene and keeping road surfaces in good condition (Niska and Eriksson 2013).
Vehicle improvements apply to both bicycles and conflicting motor vehicles. Motor vehicles are being equipped with detection and warning systems to avoid accidents, and in case of unavoidable accidents, mitigate injuries. For bicycles the improvements may include enhancing stability and brake function. The results of this study highlights that in order to ensure safe cycling factors such as improved infrastructure (avoiding confusion) helmet usage, visibility of cyclists (day and night) and preventing cycling under the influence of alcohol are of importance to address.
References
Niska, A. Gustafsson, S. Nyberg, J and Eriksson, J. (2013) Cyklisters singelolyckor. Analys av olycks- och skadedata samt djupintervjuer. VTI rapport 779. Statens väg- och
transportforskningsinstitut. Linköping.
Niska, A and Eriksson, J. (2013) Statistik över cyklisters olyckor, Faktaunderlag till gemensam strategi för säker cykling. VTI rapport 801. Statens väg- och transportforskningsinstitut. Linköping. Larsson, J. (2016). Cykelhjälmsanvändning i Sverige 1988–2015, Resultat från VTI:s senaste observationsstudie. VTI notat 4-2016. Statens väg- och transportforskningsinstitut. Linköping. Trafikanalys (2016). Road traffic injuries 2015. Statistik 2016:12
Trafikanalys (2015). Road traffic injuries 2014. Statistik 2015:8 Trafikanalys (2014). Road traffic injuries 2013. Statistik 2014:8 Trafikanalys (2013). Road traffic injuries 2012. Statistik 2013:9 Trafikanalys (2012). Road traffic injuries 2011. Statistik 2012:14 Trafikanalys (2011). Road traffic injuries 2010. Statistik 2011:15 Trafikanalys (2010). Road traffic injuries 2009. Statistik 2010:17
Trafikverket (2014). Säkrare cykling. Gemensam strategi för år 2014–2020, version 1.0.
Trafikverket Publ. 2014:030
SIKA Statistik (2009). Road traffic injuries 2008. 2009:23 SIKA Statistik (2008). Road traffic injuries 2007. 2008:27 SIKA Statistik (2007). Road traffic injuries 2006. 2007:30 SIKA Statistik (2006). Road traffic injuries 2005. 2006:31
Appendix 1
Table 19. Official Swedish statistics from 2005–2015 of the annual number of accidents with fatal or severe personal injury reported by the police in accidents involving cyclists and corresponding total number of fatalities. Other road-users than cyclists are included among the fatalities.
Accident type (Cycle ...) vs Ca r v s T ruc k v s Bus v s M C v s M o pe d Sin gl e v s Cy c le v s Pe de s tria n v s Ani m a l v s T rac tor v s Othe r To ta l: 2005 Accidents 221 32 11 3 17 75 21 18 1 0 2 401 Fatalities 16 5 1 1 0 13 1 1 0 0 0 38 2006 Accidents 201 32 9 8 12 62 18 20 0 0 2 364 Fatalities 12 6 1 1 0 2 3 0 0 0 1 26 2007 Accidents 198 25 6 6 23 54 28 29 1 2 8 380 Fatalities 14 8 2 0 1 4 0 4 0 0 2 35 2008 Accidents 225 20 9 4 12 51 33 16 1 3 2 376 Fatalities 13 3 1 2 1 9 3 0 0 0 0 32 2009 Accidents 185 16 9 3 17 63 23 14 0 4 0 334 Fatalities 8 3 1 0 0 6 1 2 0 1 0 22 2010 Accidents 134 16 4 4 7 73 16 14 0 0 2 270 Fatalities 11 3 1 0 0 4 0 2 0 0 0 21 2011 Accidents 198 24 13 3 16 61 24 27 0 1 2 369 Fatalities 9 4 0 0 0 7 0 1 0 1 0 22 2012 Accidents 206 15 11 2 10 57 26 28 1 1 4 361 Fatalities 14 2 1 0 2 6 0 2 0 0 3 30 2013 Accidents 191 16 8 7 10 55 26 22 0 1 4 340 Fatalities 6 3 0 0 0 4 1 0 0 0 0 14 2014 Accidents 167 20 5 4 11 37 12 15 1 2 5 279 Fatalities 13 4 2 2 0 10 0 1 0 1 0 33 2015 Accidents 155 21 2 3 7 23 29 16 1 1 3 261 Fatalities 8 5 0 0 0 4 0 0 0 0 0 17 Total Accidents 2081 237 87 47 142 611 256 219 6 15 34 3735 Fatalities 124 46 10 6 4 69 9 13 0 3 6 290
Table 20. Combined accident types based on statistics in Table 19. Combined accident type Moto r v e hi c le Sin gl e O the r To ta l: 2005 Accidents 267 75 59 401 Fatalities 23 13 2 38 2006 Accidents 250 62 52 364 Fatalities 20 2 4 26 2007 Accidents 235 54 91 380 Fatalities 24 4 7 35 2008 Accidents 258 51 67 376 Fatalities 19 9 4 32 2009 Accidents 213 63 58 334 Fatalities 12 6 4 22 2010 Accidents 158 73 39 270 Fatalities 15 4 2 21 2011 Accidents 238 61 70 369 Fatalities 13 7 2 22 2012 Accidents 234 57 70 361 Fatalities 17 6 7 30 2013 Accidents 222 55 63 340 Fatalities 9 4 1 14 2014 Accidents 196 37 46 279 Fatalities 21 10 2 33 2015 Accidents 181 23 57 261 Fatalities 13 4 0 17 Total Accidents 2452 611 672 3735 Fatalities 186 69 35 290
Appendix 2
Table 21. Distribution of accident types and gender of fatalities.
Number of cyclist fatalities Type of
accident
Number of
accidents Total Male Female
Motor vehicle 185 187 120 67
Bike single 67 67 51 16
Bike other 17 17 14 3
Total: 269 271 185 86
Table 22. Distribution of fatalities in the sub-categorised accident type and gender.
Number of cyclist fatalities
Type of accident Sub-categories Total Male Female
Motor vehicle Car 117 78 39 Heavy vehicle 65 39 26 MC 5 3 2
Single Bike Single 67 51 16
Other Bike Bike–Bike 7 6 1 Bike–Pedestrian 6 5 1 Bike–Moped 4 3 1
Table 23. Accident location and gender in motor vehicle accidents.
Urban Rural
Accident location Male Female Male Female
Stretch of road 19 8 32 13 Crossing 42 38 26 7 Pedestrian and/or bike lane 1 Other 1 Total: 62 47 58 20
Table 24. Accident location and gender in Single and other bicycle accidents.
Urban Rural Unknown
Accident
location Male Female Male Female Male Female
Stretch of road 18 5 6 7 2 Crossing 4 Pedestrian and/or bike lane 24 3 3 2 1 Other 4 1 1 1 2 Total: 50 9 10 10 5 0
Table 25. Distribution of fatalities with injuries to different body regions. One fatally injured cyclist might have injuries in more than one region.
Accident type Head injury Neck injury Torso injury No of fatalities
Fatality distribution due to accident type [%] Car 104 35 75 117 43 Heavy Vehicle 51 11 46 65 24 MC 2 1 4 5 2 Single 49 11 19 67 25 Bike–Bike 8 1 1 8 3 Bike–Pedestrian 5 1 2 5 2 Bike–Moped 4 1 2 4 1 Total: 223 61 149 271 100
Table 26. Fatally injured cyclists under the influence of alcohol, as noted by ISDB investigator.
Motor vehicle accidents Single and
other bike accidents Total Under the influence of
alcohol Male Female Male Female Male Female
Yes 20 5 15 3 35 8
No 67 47 30 11 97 58
Unknown 23 8 20 5 43 13
www.vti.se
VTI, Statens väg- och transportforskningsinstitut, är ett oberoende och internationellt framstående forskningsinstitut inom transportsektorn. Huvuduppgiften är att bedriva forskning och utveckling kring
infrastruktur, trafik och transporter. Kvalitetssystemet och
miljöledningssystemet är ISO-certifierat enligt ISO 9001 respektive 14001. Vissa provningsmetoder är dessutom ackrediterade av Swedac. VTI har omkring 200 medarbetare och finns i Linköping (huvudkontor), Stockholm, Göteborg, Borlänge och Lund.
The Swedish National Road and Transport Research Institute (VTI), is an independent and internationally prominent research institute in the transport sector. Its principal task is to conduct research and development related to infrastructure, traffic and transport. The institute holds the quality management systems certificate ISO 9001 and the environmental management systems certificate ISO 14001. Some of its test methods are also certified by Swedac. VTI has about 200 employees and is located in Linköping (head office), Stockholm, Gothenburg, Borlänge and Lund.
HEAD OFFICE LINKÖPING SE-581 95 LINKÖPING PHONE +46 (0)13-20 40 00 STOCKHOLM Box 55685 SE-102 15 STOCKHOLM PHONE +46 (0)8-555 770 20 GOTHENBURG Box 8072 SE-402 78 GOTHENBURG PHONE +46 (0)31-750 26 00 BORLÄNGE Box 920 SE-781 29 BORLÄNGE PHONE +46 (0)243-44 68 60 LUND Medicon Village AB SE-223 81 LUND PHONE +46 (0)46-540 75 00