Schoo
ol of Sus
Consu
stainable
M
M
mer Re
In T
Chalinee
Pimman
e Develo
Mälardal
Master Th
esponse
Thai Tel
Com
Gro
e Ketratta
nee Pongp
Tobias
28 M
opment o
len Univ
hesis (EF
es to Pr
levision
mposed by
oup 2300
anakul
patranon
Tutor
s Eltebra
May 2009
of Societ
versity
FO705)
roduct P
n Sitcom
y
0
8506
8204
andt
9
ty and T
Placem
ms
620
416
Technolo
ments
ogy
Abstract
Date: May 28, 2009
Program: MIMA – International Marketing Course name: Master Thesis (EFO705)
Title: Consumer responses to product placements in Thai television sitcoms
Authors: Chalinee Ketrattanakul ckl08001@student.mdh.se
Pimmanee Pongpatranon ppn08004@student.mdh.se
Tutor: Tobias Eltebrandt
Problem: How Thai consumers identify the advertising strategy of product placements in Thai sitcoms?
Purpose: To examine the responses of Thai customers toward product placements in Thai sitcoms and measure how product placements in Thai sitcoms have influential effects on Thai consumers’ attitudes.
Method: The study is mainly based on quantitative research using experiment and survey methods. Relevant secondary data are also collected. The major framework used in the study is the Multicomponent Model of Attitude.
Conclusion: Product placements in Thai sitcoms have influential effects on the attitudes of Thai consumers depending on the category used in practice and execution style. Implicit product placement seems to be the most suitable and acceptable technique to use in Thai sitcoms since it creates positive effects on Thai consumers’ attitude toward brands and their purchase intention.
Table of Contents
1. Introduction ... 1
1.1 Background ... 1
1.2 Motivation ... 1
1.3 Problem statement and purpose ... 2
1.4 Target audience ... 3
2. Theoretical frameworks ... 4
2.1 Previous literatures ... 4
2.2 Types of product placements ... 5
2.3 Definition and components of attitude ... 6
2.4 Multicomponent Model of Attitude ... 6
2.4.1 Stimuli ... 7
2.4.2 Attitude ... 8
2.4.3 Cognition ... 8
2.4.4 Affect ... 8
2.4.5 Behavior ... 9
2.5 Relationship between components of attitude ... 10
3. Methodology ... 11
3.1 The choice of topic ... 11
3.2 The chosen theories ... 11
3.3 The research process ... 12
3.3.1 Data collection ... 13 3.3.1.1 Experimental design ... 13 3.3.1.2 Measurement ... 15 3.3.1.3 Sample ... 16 3.3.1.4 Contact methods ... 18 3.3.1.5 Performing experiments ... 19 3.3.2 Information analysis ... 20 4. Findings ... 21
4.1 General information about “Pen Tor” ... 21
4.3 Experiment research results ... 24
4.3.1 General information of respondents ... 24
4.3.2 Changes in familiarity, attitude and purchase intention ... 26
5. Analysis ... 46
5.1 Types of product placements ... 46
5.2 Multicomponent Model of Attitude ... 47
5.2.1 Cognition ... 47
5.2.2 Affect ... 48
5.2.3 Behavior ... 50
5.3 Relationship between components of attitude ... 52
6. Summary and conclusion ... 54
7. Implications and recommendations ... 56
7.1 Implications for practitioners ... 56
7.2 Recommendations for future research ... 57
References ... 59
Appendices ... 63
Appendix 1: Pre-watching questionnaire in Thai ... 63
Appendix 2: Post-watching questionnaire in Thai ... 68
Appendix 3: Pre-watching questionnaire in English ... 71
Appendix 4: Post-watching questionnaire in English ... 75
Appendix 5: Estimating margin of error on sample survey results ... 78
Appendix 6: The number of respondents making different changes in familiarity level for each brand after watching Clip 1 ... 78
Appendix 7: The number of respondents making different changes in attitude level for each brand after watching Clip 1 ... 79
Appendix 8: The number of respondents making different changes in purchase intention level for each brand after watching Clip 1 ... 79
Appendix 9: The number of respondents making different changes in familiarity level for each brand after watching Clip 2 ... 80
Appendix 10: The number of respondents making different changes in attitude level for each brand after watching Clip 2 ... 80
Appendix 11: The number of respondents making different changes in purchase intention level for each brand after watching Clip 2 ... 81
Appendix 12: The number of respondents making different changes in familiarity level for each brand
after watching Clip 3 ... 81
Appendix 13: The number of respondents making different changes in attitude level for each brand after watching Clip 3 ... 82
Appendix 14: The number of respondents making different changes in purchase intention level for each brand after watching Clip 3 ... 82
List of Figures
Figure 1: Multicomponent Model of Attitude ... 7Figure 2: The marketing research process ... 12
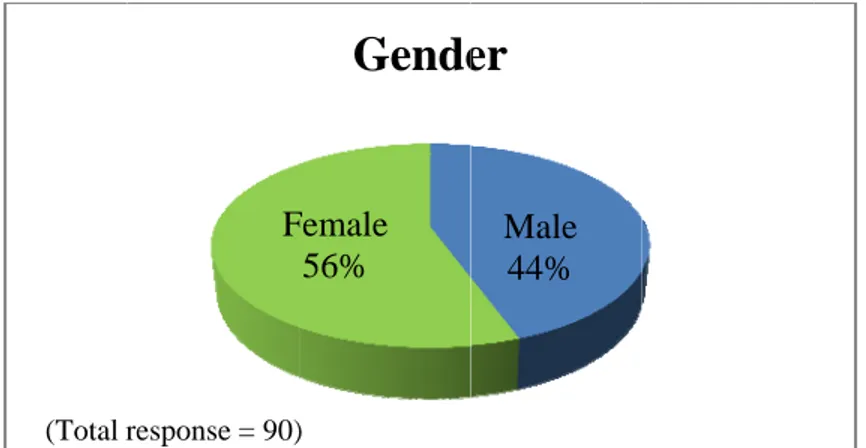
Figure 3: Respondents’ profile by gender ... 25
Figure 4: Proportion of focus population in Bangkok by gender ... 25
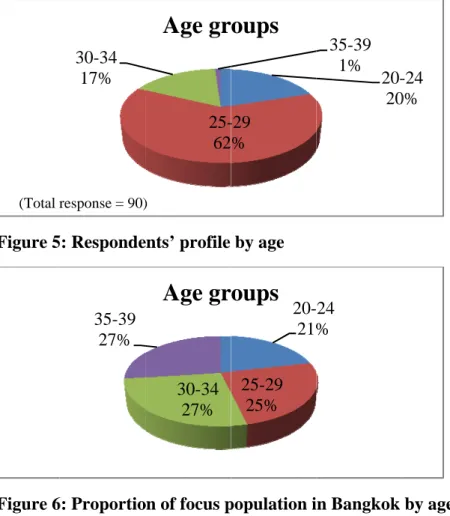
Figure 5: Respondents’ profile by age ... 26
Figure 6: Proportion of focus population in Bangkok by age ... 26
Figure 7: Changes in familiarity after watching Clip 1 ... 28
Figure 8: Changes in attitude after watching Clip 1 ... 30
Figure 9: Changes in purchase intention after watching Clip 1 ... 32
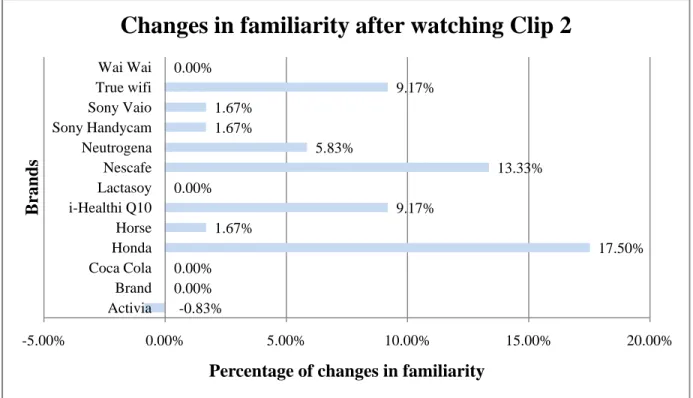
Figure 10: Changes in familiarity after watching Clip 2 ... 34
Figure 11: Changes in attitude after watching Clip 2 ... 36
Figure 12: Changes in purchase intention after watching Clip 2 ... 38
Figure 13: Changes in familiarity after watching Clip 3 ... 40
Figure 14: Changes in attitude after watching Clip 3 ... 42
List of Tables
Table 1: Categories of affect types ... 9 Table 2: Strengths and weaknesses of contact methods ... 18 Table 3: The number of respondents rating their familiarity levels for each brand before and after watching Clip 1 ... 27 Table 4: The number of respondents rating their attitude levels for each brand before and after watching Clip 1 ... 29 Table 5: The number of respondents rating their purchase intention levels for each brand before and after watching Clip 1 ... 31 Table 6: The number of respondents rating their familiarity levels for each brand before and after watching Clip 2 ... 33 Table 7: The number of respondents rating their attitude levels for each brand before and after watching Clip 2 ... 35 Table 8: The number of respondents rating their purchase intention levels for each brand before and after watching Clip 2 ... 37 Table 9: The number of respondents rating their familiarity levels for each brand before and after watching Clip 3 ... 39 Table 10: The number of respondents rating their attitude levels for each brand before and after watching Clip 3 ... 41 Table 11: The number of respondents rating their purchase intention levels for each brand before and after watching Clip 3 ... 43 Table 12: Brands appeared in the questionnaires by types of product placements for each video clip... 47
1. Introduction
This introductory chapter contains background information on the subject of product placement and motivation of the study. The statement of problem and the purpose of the research as well as the target audience are also stated.
1.1 Background
One type of promotional tactics that has commonly become a practical advertising strategy is called product placement. It is a form of advertising in which brand name products, packages, signs and corporate names are intentionally positioned in motion pictures and television programs (Kinney & Sapolsky, n.d.). This communication strategy is used to increase recognition of the product which marketers hope to have a positive impact on the target consumer’s perception and create inducement for purchase action. Product placement can be found in several media mostly in movies and television programs.
Nowadays, product placement has become a popular marketing strategy as it gives several benefits to brand owners by significantly creating brand awareness, diminishing cost due to its longevity, and linking product with the characters on the program. Because consumers normally do not watch every TV advertisement, product placement also has the advantage of avoiding the actions of skipping or fast-forwarding through advertisements. This is because there is no commercial skipping since the product is integrated into the program and also the attributes and benefits of the product are exposed in natural context. Target consumers, therefore, perceive a higher value than similar products advertised during the same show (Hollywood Product Placement, n.d.).
1.2 Motivation
The motivation of this study comes from a substantial increase in product placement as we can generally notice 10-15 brands infiltrating in some Hollywood movies. Nowadays product placement becomes popular especially in sitcoms because of the trend of living. People focus more on entertainment as they want to relax and relieve stress they get from work throughout the week including sociological, political and economic problems. The easiest way to do that is just
watching a movie or series on TV in the house. Sitcom stands for ‘situation comedy’ and its meaning is a humorous drama or television program based on situations that could arise in everyday life (AudioEnglish.net, n.d.) A sitcom “usually consists of recurring characters in a format (usually a 30 minute show once a week) in which there are one or more story lines centered around a common environment such as a family home or workplace” (Sitcom, 2003). Many countries around the globe have produced a lot of sitcoms. TV sitcoms in Thailand are also recently becoming increasingly popular. This can be seen from the significant increase in TV sitcoms in Thailand during last 10 years from 2 in 1999 to 13 in 2009 (Sitcom, 2009).
As product placements correlate with the sales of the products especially when they appear in TV programs, many advertising and consumer researchers have already investigated the impact on memory (Pokrywczynski, 2005; Lock & Romaniuk, 2007; Tsai et al., 2007) and attitudes (d'Astous & Séguin, 1999; Tsai et al., 2007) of the consumers. According to Lai-man and Wai-yee (2008), there have been a lot of researches studying on the effectiveness of product placements; most of which have focused on the ethical acceptability, gender influences, cultural influences, and viewers’ involvement with the programs. However, only a few researches have investigated the impacts of product placement on consumers’ attitudes and perceptions (Lai-man & Wai-yee, 2008). Also, no particular research related to product placement strategy with a focus on Thai sitcoms has been fully studied. Together with a rapid increase in volume and sophistication of product placements, this motivation drives this research to concentrate on Thai consumers’ responses toward product placement strategy in the context of Thai sitcoms.
1.3 Problem statement and purpose
The problem statement for this study concerns how Thai consumers identify the advertising strategy of product placements in Thai sitcoms.
The objective of this research is to examine the responses of Thai customers toward product placements in Thai sitcoms and measure how product placements in Thai sitcoms have influential effects on Thai consumers’ attitudes.
1.4 Target audience
This study is aimed to provide the details about the responses of Thai consumers to different categories of product placements for marketers, especially those who work in Thailand and whose tasks are related to the use of product placement strategy. The results from this research would give the marketers better understanding of how Thai consumers react and perceive the effectiveness of the strategy in order that they can consider how to manage the use of product placements in Thai market more effectively. In addition, the research would be useful for undergraduates and master students who study marketing courses as well as other readers who are interested in the marketing field.
2. Theoretical frameworks
This section presents some related details found in previous studies and basic information about the product placement and its categories. Additional details about the definition of concepts along with the specific contents of the theoretical frameworks of this study are explained.
2.1 Previous literatures
There are previous researches that have studied the effects of attitudes and perceptions toward product placements in TV programs. The factors of brand recall, attitudes of consumers and intention to purchase are the main variables used to analyze the effectiveness of product placements in many literatures (Lai-man & Wai-yee, 2008). Results from the past literatures indicated positive views of respondents toward product placements in general due to positive attitudes in terms of more acceptability, higher evaluations and affective outcomes, compared with advertising (Lai-man & Wai-yee, 2008). Previous research of a balance model of sitcom product placement effects focused on the balance of the relationships in three stages; stage one is the inside-program character-product relation, stage two is the outside-program consumer-character relation, and stage three is the interaction between inside and outside influences in the consumer-product attitude (Russell & Stern, 2006). Findings supported that there is a direct relationship between consumers and sitcom characters. More recent studies indicated that the degree of brand awareness has a direct impact on the level of recall rate, attitudes and intention of buying the advertised product (Tsai et al., 2007). The assessments of those factors concerning consumer attitudes are useful to measure the influential effects of the use of product placement strategy. In measuring those outcomes, the application of the theories/models regarding the attitudes of people was implemented. For example, Lai-man and Wai-yee (2008) evaluated the variables of attitudes toward product placements according to the hierarchy of effects model developed by Balasubramanian, Karrh and Patwardhan (2006). The model divided the variables into three broad categories: cognitive, affective, and conative outcomes (Lai-man & Wai-yee, 2008). This hierarchy of effects model is also mentioned with reference to the selected framework for our study in the following part.
2.2 Types of product placements
According to d'Astous and Séguin (1999), product placements can be divided into three main levels, which are implicit, integrated explicit and non-integrated explicit product placements. First, implicit product placement is the appearance of the logo, the brand name or the name of the firm without a clear demonstration of product benefits in the program. In other words, it refers to the placement of a branded product within a TV program without formally expressed but often seen at the background. In contrast, all types of product placement where the attributes and benefits of the product clearly demonstrated on the show are categorized as integrated explicit product placement, which is formally expressed and plays an active role, for example, by the actors or the actresses consuming the products. For the third type, a non-integrated explicit product placement is one where the brand or the firm is formally expressed but it is not integrated within the contents of the program. The occurrence of such product placement is when the sponsor’s name may be presented at the beginning, during or at the end of the program by having a message and saying “This program is brought to you by Ford Motor Company”. (d'Astous & Séguin, 1999; Lai-man & Wai-yee, 2008)
Previous studies found that different types of product placements result in different levels of its effectiveness. For instance, it is said that the implicit product placement gets the most negative consumer evaluation as it might be concerned less ethical due to the association of subliminal effects (Lai-man & Wai-yee, 2008). Some studies stated that consumers prefer the more explicit product placement, which is significantly related to the cognitive response. The research results conducted by Blondé and Roozen (2007) indicated that prominent product placements in TV drama series result in higher brand awareness scores than subtle product placements. Similarly, Van der Waldt, Nunes, and Stroebel (2008) concluded in the study of product placements in films that consumers will better recall a prominently placed product than a subtly placed product. However, there were also some contradictions on those outcomes. For example, one of the research findings of d’Astous and Séguin (1999) stated that because of the lower level of interference, implicit product placement creates a more positive reaction among consumers than integrated explicit product placement, which on the other hand creates a more positive consumer reaction than non-integrated explicit product placement. This conclusion is drawn in the case of TV sponsorship.
2.3 Definition and components of attitude
Before presenting the theory, it would be valuable to mention the definition of an attitude and its components in order to give the overview explanation as the basis of the framework. Attitudes are defined by several educationists and social psychologists in many aspects. Among the most important definitions of attitude, those which are suitable to describe in this context are as follows:
“Attitudes are enduring systems of positive or negative evaluations, emotional feelings, and pro or con action tendencies with respect to social objects” (Krech, Crutchfield & Ballachy, 1962).
“Attitudes are predispositions to respond to some class of stimuli with certain classes of responses and designate the three major types of response as cognitive, affective, and behavioral” (Rosenberg & Hovland, 1960).
According to the former definition, attitudes are evaluative statement of how one feels about something, either favorable or unfavorable. For the latter definition, it classifies attitude into three components. The first cognitive element of attitude concerns perceptions, concepts, and beliefs regarding the attitude object (Coady, 2001). The second affective component includes feelings toward the object of the attitude, and the third component is the action or behavior, which represents the aspect of attitude concerning a predisposition or intention to behave in a certain way (Coady, 2001). With regard to these elements, Rosenberg and Hovland (1960) developed the Multicomponent Model of Attitude as shown below. Each component of attitude is explained in more details.
2.4 Multicomponent Model of Attitude
The Multicomponent Model of Attitude corresponds to the hierarchy of effects model in which three main dimensions of attitude are determined virtually equivalently. The Multicomponent Model states that attitudes are the results of all responses to stimuli mediated by a person’s attitude toward that response (Rosenberg & Hovland, 1960). The responses produce three interrelated domains of belief (cognitive), feeling (affective), and intention (behavioral). In the model, stimuli, responses and component outcomes are theoretically constructed in sequential
direction. They are categorized into measurable independent, intervening, and measurable dependent variables as demonstrated in Figure 1 below:
Figure 1: Multicomponent Model of Attitude Source: Rosenberg and Hovland, 1960
The details of each variable include the following: 2.4.1 Stimuli
According to Barker et al. (n.d.), “stimuli are events in the environment that influence behavior”. The authors mentioned that there are many different functions a single stimulus can serve. Below is a list of examples of functions:
• Eliciting stimulus: “an eliciting stimulus is a change in the environment that is highly correlated with the occurrence of a later response” (Barker et al., n.d.).
• Emotional stimulus: “an emotional stimulus produces an emotional reaction which may influence the occurrence of behavior” (Barker et al., n.d.).
• Reinforcing stimulus: “a reinforcing stimulus is one that increases the occurrence of behaviors that it follows” (Barker et al., n.d.).
Measurable Dependent Variable Intervening Variable Measurable Independent Variable Stimuli (individuals, situations, social issues, social groups, and other "attitude objects") Attitudes
Cognition Perceptual response
Verbal statement beliefs
Affect
Sympathetic nervous response
Verbal statement of affect
Behavior
Overt actions Verbal statement concerning behavior
Several functions of stimuli can be given by a variety of objects, including different individuals, situations, social issues, social groups, and other attitude objects, which influence a person’s attitude.
2.4.2 Attitude
As mentioned previously, attitudes are evaluative responses to stimuli into which three categories of responses can be classified as cognition, affect, and behavior. More explanations regarding the details of each component of attitudes are stated in the following sections.
2.4.3 Cognition
The cognitive domain consists of “learning, thinking, remembering and the like” (Hayes, 1999). In the hierarchy of effects model applied in previous studies, cognitive outcome includes the memory-related factors such as brand recognition and brand recall (Balasubramanian et al., 2006). These factors represent the measures of brand awareness in common market research. Brand recognition means the consumers’ ability to confirm that they have previously been exposed to a particular brand whereas brand recall refers to the consumers’ ability to name the brand when given the product category, category need, or some similar cues (Dolak, 2003). According to the Multicomponent Model of Attitude, cognition involves perceptual responses and verbal statements of beliefs. Belief can be defined as “mental acceptance of and conviction in the truth, actuality, or validity of something” (Belief, 2009). According to Kotler and Armstrong (2008), belief is “a descriptive thought that a person has about something”. Parrillo (n.d.) also stated that beliefs are building blocks of attitude and one characteristic of a belief is that it is a link between cognitive and affective domain.
2.4.4 Affect
The affective domain consists of “feelings, which represent sensations, emotions, and impressions” (Hayes, 1999). This element of attitude has been concentrated in many researches of product placement. For instance, Lai-man and Wai-yee (2008) stated that affective outcome means consumer’s attitudes, reactions, responses or feelings generated from advertising or product placements, which have direct impact on brand perceptions. Moreover, several researchers believed that the evaluation of affective component has been central to the
understanding of attitude (Coady, 2001). In psychology, affect is an emotion or subjectively experienced feeling which can be divided into three main types: positive, neutral, and negative affects (Affect theory, 2009). Totally, there are nine categories of those three affect types. Each category can be described together with its biological expression.
Affect types Categories
Positive affects Enjoyment/joy: smiling, lips wide and out
Interesting/excitement: eyebrows down, eyes tracking, eyes looking, closer listening
Neutral affects Surprise/startle: eyebrows up, eyes blinking Negative affects Anger/rage: frowning, a clenched jaw, a red face
Disgust: the lower lip raised and protruded, head forward and down Dissmell (reaction to bad smell): upper lip raised, head pulled back
Distress/anguish: crying, rhythmic sobbing, arched eyebrows, mouth lowered Fear/terror: a frozen stare, a pale face, coldness, sweat, erect hair
Shame/humiliation: eyes lowered, the head down and averted, blushing Table 1: Categories of affect types
Source: Affect theory (2009)
The biological expressions accompanied each type of affect are the sympathetic nervous responses, which are part of affect component according to the Multicomponent Model of Attitude. The model also suggests that affective responses can be expressed verbally.
2.4.5 Behavior
The terms conative and behavioral outcomes are used interchangeably. According to Hayes (1999), the conative domain consists of “planning, will-power, and intentionality”, which the behavioralists replaced it with the behavioral domain, concerned with actions, activities, and habits. Purchase intention and behavior are considered the influential components for the effectiveness of product placements. Similar to cognitive and affective domains, behavioral responses are expressed in both actions and statements as shown in the Multicomponent Model of Attitude.
2.5 Relationship between components of attitude
The Multicomponent Model of Attitude proposes that all three elements of attitude work along the same route. However, some researchers only agree at the point that those components interact with one another but they are not always arranged in the consistent way as the model suggests. For example, Coady (2001) stated that cognition and affect were not necessarily in harmony with each other. She pointed out that a person may express a positive attitude toward something but may covertly have negative feelings toward it (Coady, 2001). Evans, Jamal, and Foxall (2006) argued that behavior and attitudes are related and each may influence the other, but attitudes and behavior are not always entirely consistent. This view contrasts with two researches that clarify attitude-behavior relationships. First, Fishbein and Ajzen proved that “attitude and behavior are correlated when the observed behavior is judged to be relevant to the attitude; when the attitude and behavior are observed at comparable levels of specificity; and when mediation of the attitude-behavior relationship by behavioral intentions is taken into account” (The Sustainability Attitude, 2008). Second, Fazio reported that “attitude and behavior are correlated when the attitude is based on direct experience with the attitude object, and to the extent that the attitude is cognitively accessible” (The Sustainability Attitude, 2008). In addition, there are also different views as to the sequence of the tri-component approach; for instance, “the conative component is sometimes not seen as a determinant of consumer attitudes, rather attitudes are viewed as determining the conative component” (Evans et al., 2006). Hence, this study of attitudes toward product placements will be based on the notion that attitudes are composed of three interrelated dimensions, which vary together in some consistent way.
3. Methodology
This chapter begins with the choice of topic and the chosen theories for the study. Then, the research process is mentioned including the data gathering method, followed by the research plan of experimental design and the structure of the questionnaire. Next, the details of sample size and sampling frame are presented. Lastly, information about contact methods, performing the experiments plus analysis plan is explained at the end of the chapter.
3.1 The choice of topic
The reason why the product placement is selected to be the topic of this study partly comes from the fact that it has played an important role in marketing communication strategies for several decades. A lot of studies about product placement in movies and TV programs have been conducted by many researchers by using several methods such as in-depth interviews, focus groups and questionnaire surveys. Consequently, in our perspective it is interesting to study this issue by focusing on a single country in particular. Thailand is chosen as it is a developing country where television product placement is a well-established practice (Tiwsakul, 2008). Also, because both of the authors are Thai, this point adds on our interest to learn about Thai consumer attitudes toward product placement, which is generally known as “implicit advertising” or “kod-sa-na-faeng” (Tiwsakul, 2008). Therefore, the research would provide us with an opportunity to better understand how Thai people think about the product placement strategy. Sitcom is our concentration of the study as it is gaining popularity and obtaining a lot of attention from many Thai people today.
3.2 The chosen theories
The attitude framework chosen in this study is the Multicomponent Model of Attitude developed by Rosenberg and Hovland (1960). The theory categorizes the attitude into the division of three levels of responses, namely cognition, affect and behavior. This tri-component approach also corresponds to the hierarchy of effects model developed by Balasubramanian et al. (2006), which is used in some previous researches on this topic. The Multicomponent Model of Attitude provides a useful framework to analyze the attitudes of people according to the logical sequence
of independent and dependent variables. It gives the picture of the causal relationship between factors, which include starting point, outcome, and effects. The Multicomponent Model of Attitude is based on the concept that a person’s attitude influences the way things are perceived and experienced, and attitudes do predict a person’s behavior in some certain extent. As a result, this model is selected for the analysis of consumer attitudes and resided as a basis for attitude measurement.
In addition to the Multicomponent Model of Attitude, the types of product placements are also covered in the theoretical framework chapter. This topic mentions the categories of product placements that are generally used in practice. It is also a relevant topic that is used for complete the analysis of this study.
3.3 The research process
The authors basically aimed to follow the four-step marketing research process presented by Kotler and Armstrong (2008, p. 95). The stages include defining the problem and research objectives, developing the research plan for collecting information, implementing the research plan, and interpreting and reporting the findings, as shown in Figure 2:
Figure 2: The marketing research process Source: Kotler and Armstrong (2008, p. 95)
According to Kotler and Armstong (2008, p. 95), “the statement of problem and research objective guides the entire research process”. The authors then planned to conduct this research project by means of experiment approach. The definition of experiment research is “gathering primary data by selecting matched groups of subjects, giving them different treatments, controlling related factors, and checking for differences in group responses” (Kotler & Armstrong, 2008, p. 99). The details of the research plan and the following processes are described as follows: Defining the problem and research objectives Developing the research plan for
collecting information
Implementing the research plan –
collecting and analyzingthe data
Interpreting and reporting the
3.3.1 Data collection
This study mainly uses quantitative data gathering method. Pre-structured survey research with the use of experiment is the main approach for collecting primary data. The approach of pre-structured questionnaire is selected in this case in order to quantify and measure the research material. Quantitative research approach has a major advantage in terms of the construction of data since it has standardized research mechanism. Therefore, it is chosen as the main research approach instead of the qualitative method, which is associated with research in a smaller scale and which provides researchers with more detailed descriptions (Edstrom & Jervfors, 2006, p. 22). Closed questions included in the questionnaires are designed because they would enable us the ability to measure the attitudes of people in a uniform way. Closed questions are also easier for the respondents to fill in and they would conveniently make the respondents agree to answer (Fisher, 2004). Also, closed-end questions can provide answers that are easier to interpret than open-end questions (Kotler & Armstrong, 2008).
Due to the time limit, the authors would not be able to conduct the qualitative research using other methods of collecting data such as direct observations, focus groups and in-depth interviews. As a result, we have selected to use documentary written materials as supplementary methods in order to enhance the reliability and validity of the research. Secondary data concerning the opinions and attitudes of Thai consumers toward product placements can be found in web boards of Thai websites like www.pantip.com. Documentary data are also gathered in order to study related information and previous researches in the area of product placement. The sources of secondary data involve textbooks, the Internet web pages, previous dissertations and theses, electronic journals and articles, and full-text databases such as ABI/Inform and Emerald.
3.3.1.1 Experimental design
To overcome the research problem, the authors designed an experiment by focusing on product placements that were occurring on the Thai sitcom. This experiment did have the strength of illustrating the consumer’s attitudes toward brands placed in the sitcom. In the experiment, the authors divided respondents into three groups and treated them differently in order to examine the effect of each treatment. The authors watched several video clips of Thai sitcoms on the
Internet to select three different video clips that consist of a number of brands differently focused in each clip. In the experiment of each group involved the questionnaires testing before and after watching a 10-minute video clip of the Thai sitcom. It was one set of questionnaire that can be answered by all groups of respondents.
In the experiment, each group of respondents was asked to complete a questionnaire which was distributed and picked up immediately after being completed before the participants watch the video clip. The respondents were asked about the familiarity, attitude and purchase intention of 13 brands; some of which did not appear in the chosen clips. Questions regarding the sitcom characters, scenes, and people’s opinion about the sitcom, were also designed in order to deviate the respondents’ concentration from the brands to the combination of other things happening in the sitcom. To avoid that the respondents’ familiarity with the brands would result from the questionnaire instead of the product placements in the sitcom, additional instruction was put at the end of the questionnaire to guide the respondents certain things to observe in the clip. This means that the focus of viewing the clip was likely to be on the characters not the products. After watching the clip, the respondents were again asked to complete the questionnaire which contains all the same questions as previously done before watching the clip. The exception was that the questions which are not about the brands are excluded because the results from the brands’ part are only the focus of the research and they are what the authors aimed to figure out. Note that for the whole experiment the participants were not informed of the objective of this research but they were only considerate that the research was being conducted.
In this experiment, the selected video clips were from a TV sitcom in Thailand named “Pen Tor” which lasted about 10 minutes in order to save the respondents’ time. “Pen Tor”, a story about urban society of new generation office workers, is one of the most famous TV sitcoms in Thailand (Mama Mawsub, 2008). Each of the selected video clips is comprised of different brands and types of product placement during the episode in order to evaluate the effect of consumers’ attitudes after watching the clip. The authors selected the episodes that have some of products placed in the scene in order not to overstuff the information to the respondents. In addition, the selected episodes were recently broadcasted in order for the respondents to know the brands due to the reason that the products do exist in the market.
3.3.1.2 Measurement
The structured questionnaires were planned to consist of a number of closed questions in the format of Likert scales and multiple choices. Likert scales or method of summated rating are “a form of rating scales commonly used to ask people about their opinions and attitudes by asking the respondents to choose a position on a five-point scale between strongly agree and strongly disagree for a series of statements” (Fisher, 2004, p. 165). The common scheme is to give 5 scores to strongly agree and 1 score to strongly disagree (Ray, 1982). Likert scales are one of the most popular procedures used to ask people to report their opinions and feelings directly. Yurarach (2007) declared that Likert scales are commonly used in several researches because it is relatively easier to apply and construct than some other scale measurements, and it also generates fairly reliable and efficient results. However, the attitude measurement study requires careful consideration in case the respondents might not always reveal their true attitudes or they sometimes answer the questions according to how they think the researchers might like them to respond (Evans et al., 2006). Thus, the authors needed to ensure confidentiality and anonymity issues in the data collection stage.
The pre-watching questionnaire developed to measure the attitudes of the participants in the experiment was divided into two main sections as follows:
Section 1: The section was sub-divided into three main parts for different kinds of questions. Part 1 consisted of demographic questions on gender and age of the respondents. The authors divided age ranges based on Thailand Population Pyramid (2007), in which each level ranges five years. By covering all age groups of the targeted respondents that are Thai consumers aged between 20 and 39, the age ranges therefore included (1) 20 – 24 years old (2) 25 – 29 years old (3) 30 – 34 years old and (4) 35 – 39 years old. The information from this part would help to evaluate whether there is significant difference emerged from different demographic data resulting in non response bias.
Part 2 involved specific questions about particular brands in terms of brand familiarity, attitude toward brands and purchase intention for 13 brands. This means that three main questions were identified with the same brand name lists. The participants were asked to rate the extents to which they are familiar with each brand, which level of attitude they have toward each brand,
and which degree they intend or would have potential to purchase those brands. The questions were organized identically in the format of Likert scales for all brands put in the questionnaire so that any respondent could fill in, regardless of which experiment group the person belonged to. For these 13 brands, they were comprised of a range of frequently purchased consumer products, some durable goods, and service. Food products and beverages included the brands of Activia (yoghurt from Danone), Brand (health supplements such as essence of chicken and bird’s nest), Coca Cola (soft drink), i-Healthi Q10 (a healthy ready-to-drink beverage infused with Q10), Lactasoy (soymilk), Nescafe (instant coffee), and Wai Wai (instant noodles). Other consumer products were Horse (stationery) and Neutrogena (facial cleanser). For durable goods, one car brand was Honda; consumer electronic devices involved Sony Handycam (video camera) and Sony Vaio (laptop). One service brand included in the questionnaire was True wifi, the wireless broadband Internet service.
Part 3 included four questions about the most favorite sitcom character, the funniest character, the most preferred scene, and overall opinion about the sitcom. Multiple choices were given for each of these questions.
Section 2: In this section was the direction to inform the respondents about what they needed to observe during watching the clip. The authors selected the emotion of the characters as the point of concentration. The respondents were informed that they would obtain another questionnaire after the clip was ended.
The post-watching questionnaire was comprised of the same questions in part 2 of the section 1 mentioned above.
The pre- and post-watching questionnaires used in conducting this research were written in Thai language as put in Appendix 1 and 2 respectively. The authors also enclosed the English versions, which are placed in Appendix 3 and 4, for the purpose of universal understanding. 3.3.1.3 Sample
The targeted respondents are Thai consumers, both male and female aged from 20 to 39. This group of people represents university students and young adult workers, who mostly tend to watch the sitcom “Pen Tor”. This target group corresponds to what the Director of the sitcom
clearly stated in the web interview about the target audience as he stressed that the situations in the sitcom significantly reflect real life experiences (tv4kids, 2006). Therefore, this group was selected to be the participants in this research. Younger children such as high school students were not targeted in this case due to the fact that the sitcom is broadcasted quite late at night. In the selection process, the respondents were required to be regular viewers of at least one series of the sitcom “Pen Tor” and would be able to watch a particular episode that is selected for this study. In determining the population for this research, the authors narrowed the scope of total Thai population to Thai population in Bangkok, the capital city. Part of the reason why the range of population is limited was due to the fact that the chosen sitcom in this research represents the story about working society in Bangkok. Based on the concept that people having different characteristics tend to express their behavior in different ways, the authors therefore selected the sample of this study which, more or less, symbolizes the characteristics of the actors in that particular sitcom. According to the statistical report of the Department of Provincial Administration, Ministry of Interior (2008), 5,710,883 people had Thai nationality and resided in Bangkok. This figure represented the total number of Bangkok residents as of December, 2008. Of this number, 1,788,588 people were those in the range of ages between 20 and 39 (Department of Provincial Administration, 2008). They were the entire population in this study. According to Fisher (2004, p. 159), the size of sample the researchers need depends in part on the size of the margin of error they are prepared to accept and the size of the population from which they are going to take the sample. Appendix 5 shows the table of the margin of error estimation, which is a measure of uncertainty in the representativeness of the sample (Fisher, 2004, p. 159). Assuming the authors used a margin of error of +/- 5 per cent or in other words 95 per cent level of certainty, the number of completed questionnaires required for the survey equal to 384 as shown in the first column when the size of population exceeds one million. Hence, 384 Thai people in Bangkok would be the sample or representative of population in this research. However, in addition to the condition of the margin of error, the method of conducting research is also another determinant of sample size calculation. A true experimental design can use relatively smaller sample sizes than a survey research or a non-experimental design does (Sampling, n.d.). It is recommended that the samples should not be smaller than 30 for each group in the experiment (Sampling, n.d.). Within the time constraint, the authors therefore selected the minimum of 30 respondents based on many common statistics for the experimental
design. The total sample size for this study was 90 people, equally divided into three groups for three different sitcom episodes.
With reference to Fisher (2004, p. 159), the sampling frame, which is a list of the names and addresses of all people in the population, is entailed before sending the questionnaires to the respondents. The chosen sampling frame in this study was the purposive sampling, which is a type of non-probability sampling or the sampling that does not involve random selection (William, 2006). Purposive sampling allows the researchers to sample with a pre-defined purpose. It is a very useful method to reach a targeted sample quickly (William, 2006). The respondents were selected by the authors’ personal contacts to identify the persons who meet the criteria of this experiment study and the authors could contact them directly.
3.3.1.4 Contact methods
In this research, the authors conducted the experiment both in Sweden and Thailand. Therefore the information could be collected differently. As the authors were in Sweden, information was collected personally by distributing a questionnaire before and after watching the video clip. The information gathered by conducting experiment with the Thai respondents who live in Thailand could be directly collected online by the authors. The strengths and weaknesses of several contact methods can be found in Table 2 below:
Mail Telephone Personal Online
Flexibility Poor Good Excellent Good
Quantity of data that can be collected Good Fair Excellent Good Control of interviewer effects Excellent Fair Poor Fair
Control of sample Fair Excellent Good Excellent
Speed of data collection Poor Excellent Good Excellent
Response rate Fair Good Good Good
Cost Good Fair Poor Excellent
Table 2: Strengths and weaknesses of contact methods Source: Kotler and Armstrong (2008, p. 99)
For this experiment, the selected video clips were shown to the respondents after the first questionnaire had been completed. The procedures of the experiment were not too complicated to conduct online and due to the time constraint, the authors decided to conduct both personal
and online experiment because the speed of data collection of these methods are good with the favorable response rate (Kotler & Armstrong, 2008). Though the personal method is costly, it can be absorbed by using online experiment which is relatively low in cost. Personal and online procedures also have other advantages such as good quantity of data and control of sample. However, using the Internet to conduct the experiment does have some drawbacks, for example, the restricted Internet speed in Thailand can make it difficult for respondents to get the selected video clip and the control of replaying the video clip when completing the post-watching video clip questionnaire.
3.3.1.5 Performing experiments
After the questionnaires were developed, they were piloted by two respondents, who are the Thai students living in Sweden and studying at Mälardalen University. These persons all passed the criteria of being the respondents of this research, which means that they are within the age levels of 20 – 39 years old and they have at least once seen the sitcom “Pen Tor”. The purposes of piloting the questionnaires are to check whether the respondents clearly understand the written language, whether any mistake was found, and possibly to obtain some suggestions for questionnaire improvement. The pilot tests were conducted on April 20, 2009 at Norra Allegatan student apartment in Västerås. The results of the tests were that the respondents could understand the questions in the questionnaires well. All the brand names, although some are international brands, were understood when they were written in Thai.
Subsequently, the experiments were conducted on April 20 – 27, 2009 in Västerås and via Internet. The respondents included Thai students who are studying in the town and Thai people living in Thailand who the authors could contact by personal online chatting. The respondents were randomly selected to perform three experiments which mean that there was no criterion to choose whether which person would see which video clip. Altogether 90 experiments were performed; 55 of which were done in Västerås by personal contact method at Norra Allegatan student apartment and online method via Internet while 35 persons in Thailand were contacted by online chatting via MSN and Skype.
3.3.2 Information analysis
Following the research process, data gathered were processed and analyzed. After the research plan was put into action, the authors interpreted primary data by reporting the results of the experiments in the findings part. The authors calculated the pre-watching scores of each brand and each focused category of attitude component for each video clip by using weighted mean which is the most common type of average used for measuring tendency.
The weighted mean of a set of N values , , … , is computed according to the following formula;
∑∑ ; 0
which means;
where , , … , are non-negative coefficients, called “weights”, which are assigned to the corresponding values , , … , (Weighted Mean, 2009). In this research, weights were the number of respondents of each rating score in an experiment and corresponding values were the levels of familiarity, attitude or purchase intention that each respondent scored in the experiment from 1 to 5.
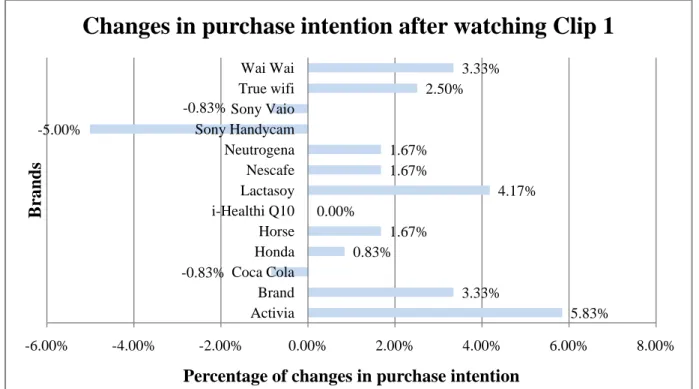
From the formula, the denominator equals to 30, which was the number of respondents of each experiment. The sum of scores is divided by this number in order to determine the average impact per respondent. The same calculation was done for the post-watching scores. Next, the differences between the averaged pre-watching and post-watching scores were computed. After that the averaged results were made in the form of percentages which were used in plotting bar charts in order for the readers to understand more easily. The results of the research were also put in the form of tables to show the way the authors interpreted the results, which means the calculation of the score and percentage changes. In addition, other secondary data were also presented. The collected information would then be analyzed in accordance with the theories that were introduced previously. Findings and analysis were used for drawing conclusions and further discussion and implication of the study.
4. Findings
This chapter consists of general information about the sitcom “Pen Tor” and the collected data from online magazine and recent research on the attitudes of Thai consumers toward product placements in Thai sitcoms. The details of the attitudes are summarized from the secondary sources. Then, the experiment research results are exemplified.
4.1 General information about “Pen Tor”
“Pen Tor” is a Thai sitcom with the main emphasis on the story about a young single group of people who live and work in Bangkok. The characteristics of “Pen Tor” include a variety of situations representing love story, working atmosphere as well as leisure and lifestyle. “Pen Tor” is not only the name of the sitcom but also the name of the main actor in the plot. The sitcom has been broadcasted on Channel 3 every Thursday at 10.30 – 11.30 pm since October 7, 2004. From August 7, 2008 until present, on-air timing has been changed to 11.00 pm – 12.00 am. The director of the sitcom is Mr. Jirasak Yojiw. The major artists involve Mr. Chakrit Yamnarm, Miss Pimmada Boriluksupakorn, and Miss Mayurin Pongpoodpun, to name a few. In the past few years “Pen Tor” has received three awards, which are comprised of Asian Television Awards 2007 for Best Comedy Program, Golden Television Awards 2005 for Best Comedy Script, and the Fifth Hamburger Awards for Best Sitcom Series. (Pen Tor, 2009)
“Pen Tor” is one Thai TV series produced by EXACT Company Limited. EXACT was found in November, 1991 by Mr. Takonkiet Viravan and Grammy Entertainment Co., Ltd. It is currently a subsidiary of GMM Media Public Company Limited, the leading entertainment and media business in Thailand. With superb quality and standard of production as well as unique presentation style, EXACT is widely recognized as the leader in TV industry in Thailand with a number of successful dramas and series continually launched to the audience nationwide. (Exact Co., Ltd., 2006)
4.2 Data from online magazine and research
With reference to Positioning Magazine (2008), the news was written concerning the tactic of product placements used in Thai sitcoms produced by EXACT Co., Ltd. and affiliated companies
like Scenario Co., Ltd. Mr. Surapon Peerapongpipat, Marketing Executive of EXACT Co., Ltd., stated that the principle of product tie-in tactic is based on marketing and entertainment, which need to be consistently combined with the content of sitcoms and which are managed under certain agreement with the sponsor companies. He mentioned that product tie-in strategy used in the series of EXACT can be categorized into three levels, which are Product Placement, Product Movement, and Product Experience. Product Placement means putting the particular product to be involved in the scene, for example, on the table. By adding the actor or actress touching or holding that product, the tactic will be called Product Movement. For Product Experience, it refers to explicit expression of the product benefit by the actor. (Positioning Magazine, 2008) Mr. Surapon also pointed out that “Pen Tor” is the most successful sitcom in terms of the use of product placement or “kod-sa-na-faeng” because of the strength in the sitcom content, which is relevant to young people’s lifestyles. The situations included in “Pen Tor” usually occur in the office, condominium, minimart, and night bar. This is why it is easy for the producers to find the products to be suitably placed in this sitcom. This point, thus, gives them an advantage of attracting the sponsor companies. Another success of EXACT, Mr. Surapon said, is the use of product placement shortly between the scenes or during post production. During changing the scenes they use computer graphic billboard showing a particular brand to capture the audience’s short notice. Such product placements are acceptable as they represent the real situations of Bangkok where there are a lot of print-ads and billboards demonstrated in public. (Positioning Magazine, 2008)
As the product placement strategy is increasingly used by Thai marketers as it gives several benefits to the TV program producers, some negative consequences also existed. While the marketers intend to use product tie-in as a technique to inform the consumers the product knowledge to enhance brand awareness, the audiences do not always understand that objective, and in some cases they feel bored to the brands and/or the sitcom since several times the focus is about to promote hard sales instead of the emphasis on the sitcom content. (Behind the Ad, 2008) The recent research on the attitudes of Thai consumers toward product placements in sitcoms of EXACT could be found in the well-known Thai web board called pantip.com. Various opinions were shared publicly. In fact, there were nine specific questions regarding product tie-in, which some participants answered to each question sequentially while some only replied general
opinions and comments. The first question asked about people’s opinion whether they think there are too much product tie-in in the EXACT’s sitcoms. Four out of 12 respondents answered that there are too much while five persons said there are a lot in use but it can be accepted. Two persons were indifferent and one person thought it is not too much. This question was connected to the second one, which asked whether people think EXACT sitcoms’ use of product tie-in strategy is in the acceptable level. The results were that four respondents answered they have negative attitude toward the use of tie-in as they feel the advertising strategy interrupts entertaining moments. However, the remaining answers stated it is in the acceptable level as long as the products are consistent and associated with the scenes. (Pantip.com, 2009)
The next three questions were pointed to each category of product tie-in mentioned by Mr. Surapon. Each question asked about degree of acceptability in people’s opinions for the use of Product Placement, Product Movement, and Product Experience, respectively. In the case of Product Placement, the question was raised with the example of the scenes at the night bar in “Pen Tor” where the bottles of soda water and soft drink are put on every table. Interestingly, more than half of the respondents said it is certainly acceptable tactic whereas a few persons were unconcerned. Some participants also added that they did not feel it is a promotion or an advertisement, but the materials included in the scenes. For Product Movement, six persons accepted the tactic while two persons were uninterested and four persons somewhat dissatisfied with the tactic. For the case of Product Experience, only two participants agreed with explicit expression of product benefit. Three persons were indifferent, but the remaining seven respondents said it is unacceptable and rather annoying. (Pantip.com)
Then, the respondents were asked whether, if possible, they would like the product tie-in strategy in sitcoms to be cancelled. The majority of participants answered no with diverse reasons including marketing, business, sponsorship, and in some cases ignorance. Most of them agreed that the cancellation might not be the best solution and there is no need to do so as long as the product tie-in is used within certain limit such as the case of Product Placement and some Product Movement. Only a few persons answered they would like the strategy to be eliminated. The next question asked people whether they normally watch the advertisements or change to see other channels during the breaks in sitcoms. The answers of this question were distributed evenly as some said they watch the ads or at least they do not change the channel and some said they
search for watching something else. Then the respondents were asked whether they feel the product tie-in does disrupt them during watching the sitcoms. Four persons answered no and two persons said it disturbs and bothers them considerably. Others said that it depends on the level of the tactic, for instance, it does disrupt them especially the use of Product Experience. The final question was associated with the attitudes of people toward EXACT’s sitcoms. The question was how do people currently feel about EXACT’s sitcoms. Most of the answers were about the positive aspects such as fun, enjoyment and creativity. Some said that they are the best sitcoms in Thailand and some also mentioned the name of particular series as their favorite ones. There was only one negative answer, which the respondent pointed out the reason of having too much product placements. (Pantip.com)
4.3 Experiment research results
To obtain information about the respondents’ familiarity, attitude and purchase intention toward product placements in TV sitcoms, the authors conducted an experiment research to 90 respondents by using questionnaire as a tool to collect all information. After the responded questionnaires were validated in terms of completion, all 90 completed responses remained. 4.3.1 General information of respondents
In this experiment research, respondents’ profile was divided by gender and age group. In order to establish the representativeness of the respondent’s profile in this research to the target audience of TV sitcom “Pen Tor”, it was compared to the focus population in Bangkok.
Respondents’ profile by gender
Figure 3 shows the respondents’ profile split by gender. In this research, there was a higher proportion of female respondents (56%) compared to the proportion of female in the total focus population in Bangkok (52%), as shown in figure 4, and a lower proportion of male (44%) compared to the proportion of male in the total focus population in Bangkok (48%) as shown in figure 4.
Figure 3 Figure 4 Source: D Respond Figure 5 of the re followed The smal the other reasonab who are of the foc to 24 yea (Total r 3: Responde 4: Proportio Department dents’ profil shows the re spondents in d by age grou llest group w r hand the f ly balanced in the age fr cus populati ars old, whic F response = 90) F ents’ profile on of focus p of Provincia le by age espondents’ n age group up from 20 t was the respo
focus popula representati rom 35 to 39 on in Bangk ch are 25% a Female 56%
Gende
) Female 52%Gende
by gender population i al Administra profile divid between 25 to 24 years o ondents who ation in Ban on of popula 9 years old a kok followed and 21% of th Male 44%er
Male 48%er
n Bangkok ation (2008) ded by age t 5 and 29 yea old (20%) an o are in the a ngkok show ation in all a and 30 to 34 d by the grou he focus pop by gender ) that there wa ars old, whi nd 30 to 34 y age between wn in Figure age groups. T 4 years old. E up of ages fr pulation in B as a significa ich was 62% years old (17 n 35 to 39 ye e 6 highlight The largest g Each of them om 25 to 29 Bangkok resp ant represent % of respond 7%) respecti ears old (1% ts that there groups are pe m represents years old an pectively. tation dents, ively. %). On e is a eople 27% nd 20Figure 5 Figure 6 Source: D The fact be over-r ensure th workers w 4.3.2 C The auth responde informati differenc The colle each vide (Total r 5: Responde 6: Proportio Department that the resp represented hat the resul who are the Changes in f hors used th ents in thre
ion was coll ces in the re ected inform eo clip is exp 30-34 17% response = 90) 35-39 27% ents’ profile on of focus p of Provincia pondents wh in this exp t of this res main target familiarity, hree video c ee main ca lected both b sponses of e mation of the plained belo 25-62
Age gr
) 30-34 27%Age gr
by age population i al Administra ho are in the eriment com earch reflec of this TV s attitude and lips in this ategories: f before and af each brand a changes in w: -29 %roups
20-21% 25-29 25%roups
n Bangkok ation (2008) age ranged b mpared to th ts the actual sitcom. d purchase experiment familiarity, fter watchin appeared in brand famili 20-20 35-39 1% 24 % by age ) between 25 he focus pop l responses intention study and attitude an ng the video the video c iarity, attitud -24 0% and 29 year pulation in of the new collected in nd purchase clips in orde lips by usin de and purch rs old appear Bangkok w generation o nformation o e intention. er to compar ng questionn hase intentio red to was to office of the The re the aires. on forClip 1 Familiarity
Table 3 shows the number of respondents rating their familiarity levels for each brand before and after watching Clip 1. The total scores are averaged, deducted and calculated in percentage changes. In Table 3, it can be seen that the brand that has the highest average scores for both pre- and post-watching was Coca Cola (4.700). As none of 30 respondents changed their familiarity levels for Coca Cola after watching the clip, the average and percentage changes became zero. Following Coca Cola, some brands having somewhat high average scores included, for example, Wai Wai, Honda, and Lactasoy. On the other hand, the lowest average familiarity scores belonged to i-Healthi Q10 (2.100 and 2.200), followed by Horse (2.800 and 2.767) and Activia (2.833 and 3.100). Table 3 also shows that the largest change in averaged familiarity score appeared to be the brand Sony Handycam (1.467) as the score increased from 2.967 to 4.433. This was because the majority of respondents were ‘not too familiar’ (rated by 2) and ‘neutral’ (rated by 3) with the brand before watching the clip, but they were ‘somewhat familiar’ (rated by 4) and ‘very familiar’ (rated by 5) after watching the clip.
Brands Pre-watching Post-watching Average change d-c Percentage of average impact on familiarity Number of
respondents by score Ave.
c
Number of
respondents by score Ave.
d 1 2 3 4 5 1 2 3 4 5 Activia 4 8 8 9 1 2.833 3 7 5 14 1 3.100 0.267 6.67% Brand — — 13 13 4 3.700 — — 13 11 6 3.767 0.067 1.67% Coca Cola — — — 9 21 4.700 — — — 9 21 4.700 — 0.00% Honda — — — 18 12 4.400 — — — 19 11 4.367 -0.033 -0.83% Horse 3 8 12 6 1 2.800 3 8 13 5 1 2.767 -0.033 -0.83% i-Healthi Q10 9 11 8 2 — 2.100 10 8 8 4 — 2.200 0.100 2.50% Lactasoy — — 6 14 10 4.133 — — 3 13 14 4.367 0.233 5.83% Nescafe — — 7 16 7 4.000 — — 2 9 19 4.567 0.567 14.17% Neutrogena — 4 11 12 3 3.467 — 5 11 11 3 3.400 -0.067 -1.67% Sony Handycam — 12 10 5 3 2.967 — — 1 15 14 4.433 1.467 36.67% Sony Vaio — 5 11 10 4 3.433 — — 4 15 11 4.233 0.800 20.00% True wifi — 5 9 11 5 3.533 — 4 9 11 6 3.633 0.100 2.50% Wai Wai — — 1 13 16 4.500 — — — 11 19 4.633 0.133 3.33%
Table 3: The number of respondents rating their familiarity levels for each brand before and after watching Clip 1
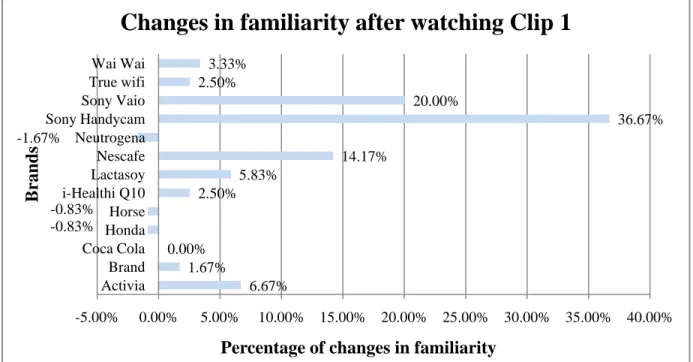
The percentages of average changes in familiarity for each brand are formed in Figure 7. The familiarity levels of the respondents significantly increased for the brand Sony Handycam by 36.67% as shown in Figure 7 followed by Sony Vaio and Nescafe at 20.00% and 14.17% respectively. There were lower changes in respondents’ familiarity levels for the brands of Activia (6.67%), Lactasoy (5.83%), Wai Wai (3.33%), and Brand (1.67%). In addition, there was an unchanged level of respondents’ familiarity for Coca Cola (0.00%). However, there were three brands having decreases in familiarity levels which were Honda (-0.83%), Horse (-0.83%), and Neutrogena (-1.67%).
Figure 7: Changes in familiarity after watching Clip 1 6.67% 1.67% 0.00% -0.83% -0.83% 2.50% 5.83% 14.17% -1.67% 36.67% 20.00% 2.50% 3.33% -5.00% 0.00% 5.00% 10.00% 15.00% 20.00% 25.00% 30.00% 35.00% 40.00% Activia Brand Coca Cola Honda Horse i-Healthi Q10 Lactasoy Nescafe Neutrogena Sony Handycam Sony Vaio True wifi Wai Wai
Percentage of changes in familiarity
Brands
Attitude
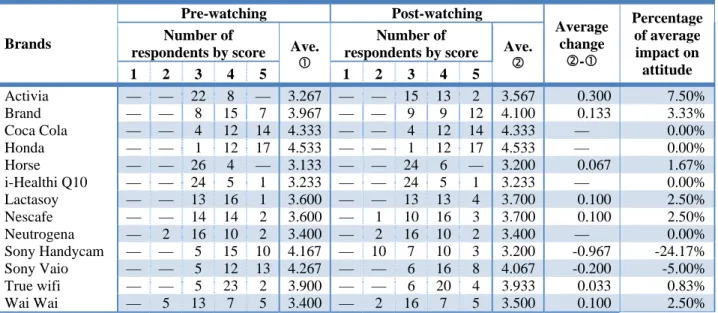
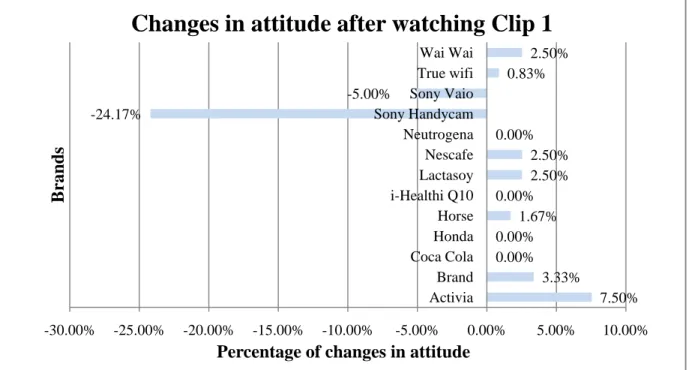
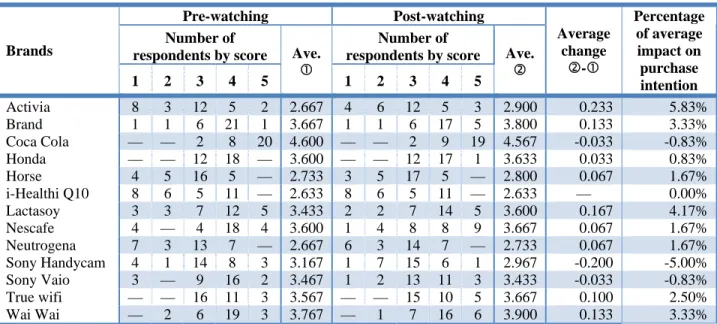
Table 4 shows the number of respondents rating their attitude levels for each brand before and after watching Clip 1. Again the percentages of average changes are computed in order to draw the graph. This table reveals that Honda was the brand with the highest average score of attitude toward brand (4.533) and that happened both before and after clip watching, making no difference in average change. Other brands with quite high scores for both pre- and post-watching involved Coca Cola, Sony Vaio, and Brand. The most obvious score change in this case also fell in the brand Sony Handycam, with a negative average change of 0.967 or -24.17%. It was due to the fact that the number of respondents rating ‘negative’ attitude toward brand (scored by 2) increased from 0 before watching the clip to 10 after watching the clip, whereas those who rated ‘positive’ attitude (scored by 4) decreased from 15 to 10 persons and who rated ‘strongly positive’ attitude (scored by 5) declined from 10 to 3 persons.
Brands Pre-watching Post-watching Average change d-c Percentage of average impact on attitude Number of
respondents by score Ave.
c
Number of
respondents by score Ave.
d 1 2 3 4 5 1 2 3 4 5 Activia — — 22 8 — 3.267 — — 15 13 2 3.567 0.300 7.50% Brand — — 8 15 7 3.967 — — 9 9 12 4.100 0.133 3.33% Coca Cola — — 4 12 14 4.333 — — 4 12 14 4.333 — 0.00% Honda — — 1 12 17 4.533 — — 1 12 17 4.533 — 0.00% Horse — — 26 4 — 3.133 — — 24 6 — 3.200 0.067 1.67% i-Healthi Q10 — — 24 5 1 3.233 — — 24 5 1 3.233 — 0.00% Lactasoy — — 13 16 1 3.600 — — 13 13 4 3.700 0.100 2.50% Nescafe — — 14 14 2 3.600 — 1 10 16 3 3.700 0.100 2.50% Neutrogena — 2 16 10 2 3.400 — 2 16 10 2 3.400 — 0.00% Sony Handycam — — 5 15 10 4.167 — 10 7 10 3 3.200 -0.967 -24.17% Sony Vaio — — 5 12 13 4.267 — — 6 16 8 4.067 -0.200 -5.00% True wifi — — 5 23 2 3.900 — — 6 20 4 3.933 0.033 0.83% Wai Wai — 5 13 7 5 3.400 — 2 16 7 5 3.500 0.100 2.50%
Table 4: The number of respondents rating their attitude levels for each brand before and after watching Clip 1
In Figure 8, the respondents’ attitude levels toward Sony Handycam dramatically decreased by 24.17%. Sony Vaio had a slight decline at 5.00%. For the brands which had positive changes in attitude after watching Clip 1, Activia was the brand which had the highest increase in attitude levels of the respondents at 7.50% followed by Brand (3.33%). Lactasoy, Nescafe, and Wai Wai had the same increase level at 2.50%. There were small increases in the respondents’ attitude levels for Horse and True wifi at 1.67% and 0.83% respectively. Nevertheless, Coca Cola, Honda, and Neutrogena had an unchanged respondents’ attitude level (0.00%).
Figure 8: Changes in attitude after watching Clip 1
7.50% 3.33% 0.00% 0.00% 1.67% 0.00% 2.50% 2.50% 0.00% -24.17% -5.00% 0.83% 2.50% -30.00% -25.00% -20.00% -15.00% -10.00% -5.00% 0.00% 5.00% 10.00% Activia Brand Coca Cola Honda Horse i-Healthi Q10 Lactasoy Nescafe Neutrogena Sony Handycam Sony Vaio True wifi Wai Wai
Percentage of changes in attitude
Brands