V¨
aster˚
as, Sweden
Thesis for the Degree of Master of Science in Computer Science with
Specialization in Embedded Systems 30.0 credits
INTELLIGENT SYSTEM FOR
MONITORING PHYSIOLOGICAL
PARAMETERS USING CAMERA
Kh Nafis Karim
kkm10001@student.mdh.se
Examiner: Shahina Begum
M¨
alardalen University, V¨
aster˚
as, Sweden
Supervisors: Mobyen Uddin Ahmed
Nima Khalilzad
Abstract
Measuring physiological parameters or vital sign using camera has become popular in recent years. Contact-less monitoring and extraction of vital signs can be important source of information in sit-uations like medical care system and safety control system. This paper presents the implementation of real-time, non-contact method for extraction of vital signs, heart rate in this case. A better face tracking method is used for efficient face detection. This study extends some of the previous works done and have a comparison study with several methods. The developed system used filtering with window over the green channel of the signal and then Converted to frequency domain to analyze the signal to detect heart rate. The developed system achieved high correlation and showed small error while referencing with actual heart signal from ECG. This method delivers better result in better light condition but gives fairly good result on lower light as well.
Keywords: Vital sign; Physiological parameter; Hear rate extraction; Face detection; Non-contact method; Real-time system
Acknowledgments
My greatest gratitude goes to both of my supervisors Mobyen Uddin Ahmed and Nima Khalilzad for their support, patience and encouragement. Their guidance gave me great help during this research, and their advice inspired me to improve the project and without them, this thesis would not have been possible. Thanks to my examiner Shahina Begum for her support during the development process of this thesis. I would also like to thank Shaibal Barua, Ph.D. student in Malardalen University for his expert advice and support. I would also like to thank my parents and my family for their patience and support despite the distance. Special thank goes to my wife Mitul for just being with me all the time. Thanks also to my friends who were always there when I needed them. Thanks to all my colleagues and friends in the school, I have learnt a lot from them throughout the whole study period. Last but not least, I hope that you would be kind enough to excuse my unintentional mistakes and would appreciate your creative criticism.
Table of Contents
1 Introduction 7
1.1 Structure of the report . . . 7
1.2 Goal of the thesis . . . 8
2 Background 9 2.1 Heart Rate . . . 9
2.2 Blood Volume Pulse . . . 9
2.3 Photoplethysmography . . . 9
2.4 OpenCV . . . 10
2.5 Independent Component analysis(ICA) . . . 10
3 Literature Review 11 4 Problem Formulation and Thesis Contribution 15 4.1 Thesis Contributions . . . 15
5 Research Method and Approach 16 5.1 Research Method . . . 16
5.2 Approach . . . 16
6 Data collection 18 6.1 Participants . . . 18
6.2 Primary data collection . . . 18
6.3 Ethical statement . . . 18
7 Proposed Solution and Implementation 20 7.1 Face detection and ROI Tracking . . . 20
7.2 Heart rate Extraction . . . 21
7.2.1 Method-1 . . . 21
7.2.2 Method-2 . . . 24
7.2.3 Method-3 . . . 25
8 Result and Evaluation 28 8.1 Test cases . . . 28
8.2 Face and ROI detection . . . 28
8.3 Heart rate extraction test . . . 29
8.3.1 Method-1 Evaluation . . . 30
8.3.2 Method-2 Evaluation . . . 31
8.3.3 Method-3 Evaluation . . . 31
8.3.4 Verdict . . . 32
8.3.5 Different light conditions . . . 33
8.4 CPU utilization and memory testing . . . 34
8.4.1 CPU use . . . 34
8.4.2 Memory Use . . . 34
9 Discussion, limitations and future work 37 9.1 Discussion . . . 37
9.2 Limitations and Future Work . . . 37
10 Conclusion 38 Appendix A Appendix 41 A.1 Sample Code- Filters . . . 41
A.2 Sample Code- Dump looged data . . . 43
List of Figures
1 A general Photoplethysmography Waveform[?] . . . 10
2 Steps in deductive approach . . . 16
3 Integral image . . . 20
4 Tracking of the face and Region of Interest(ROI) . . . 21
5 Light absorption by Hemoglobin . . . 22
6 Flowchart of Method 1 . . . 23
7 Flowchart of Method 2 . . . 24
8 Discreate Fourier Transformation of filtered data . . . 25
9 Flowchart of Method 3 . . . 26
10 Independent components and their Fourier transforms . . . 27
11 Face detection: Various skin tone under different light conditions . . . 28
12 HR signal of a random participant using method-1(left) and cStress(right) . . . . 30
13 HR signal of subject-3 from method-2(left) and cStress(right) . . . 31
14 HR signal of subject-3 from method-2(left) and cStress(right) . . . 32
15 Filtered signal: Good . . . 33
16 Filtered signal: Bad . . . 34
17 CPU utilization and HOT path . . . 35
18 CPU utilization by functions . . . 35
19 Memory consumption . . . 35
20 Integral image . . . 43
List of Tables
1 Related works list that uses Face area as Region of interest (ROI) . . . 142 Face detection incidents . . . 29
3 Success rate subjective to light and skin condition . . . 29
4 HR data using method-1 and ECG(cStress) . . . 30
5 HR data using method-2 and ECG(cStress) . . . 31
6 HR data using method-3 and ECG(cStress) . . . 32
7 Statistical analysis(Correlation Coefficient) and avg RSQ of different methods and participants . . . 32
FPS Frame Per Second BPM Beats Per Minute BVP Blood Volume Pulse ECG Electrocardiography HR Heart Rate
ICA Independent Component Analysis ROI Region Of Interest
NIR Near IR
OpenCV Open Source Computer Vision FFT Fast Fourier Transform
1
Introduction
Physiological parameters have a strong relationship with human physiological conditions that is health issues and diseases can be derived from these parameters. That is why they are also called Vital signs. It is worth mentioning that different parameters have different properties in terms of showing symptoms and in terms of how important they are to have an impact to ones health condition. Among the four primary vital signs, heart rate (HR) is one of the most important one and scope of this research. Other important parameters are body temperature, blood pressure, and respiratory rate. Heart rate can also be used to determine human behavior analysis along with other external behavior analysis like posture study.
Traditional vital sign measurement techniques involve or rely on touch-sensitive sensors which require some contacts with body parts and this can be somehow difficult or impossible in cir-cumstances like during vehicle driving or remote medical or healthcare situations. Also sensors like an electrocardiogram(ECG), pulse oximetry cause undesirable skin irritation and discomfort. Non-contact vital signs extraction has various use in medical and other remote situations. It is no surprise that one of the solutions preferred by a literature review paper1was in-vehicle technology
for determining sleepiness or fatigue and warn the driver. Another literature review and research report [1] by NZ Transport Agency mentioned about the significance of this kind of intelligent systems and it is quite obvious that these solutions need non-contact technology which has the ability to determine vital signs and physiological activity. There are quite a few studies all over the world that would agree with this study. Generally heart rate extraction is related to medical study fields and falls out of the scope of video analysis techniques because traditional methods suggest some kind of touch sensors. But increasing amount necessity of non-contact and remote measurements drove researchers to study in this field and, therefore, a decent amount of research work is going on this area in recent years. This research work was conducted to fulfill the need of a suitable method for being used in a real-time embedded industry.
1.1
Structure of the report
This section is to give an idea to the potential reader about the structure of this thesis report. Structure of the report is as
follows-• Chapter 2 discusses background and some basic conceps of related area of the thesis. This includes Heart-rate(HR), Blood volume pulse(BVP), Photoplethysmography, Face detection, Independent component analysis
• Chapter 3 mentions literature study and tries to formulate the main research questions. It also has discussed about limitation of touch-sensor based methods.
• Chapter 3 presents literature review about face detection, image processing filtering, im-portant physiological parameter and vital signs, heart rate extraction using camera and so on.
• Chapter 4 formulates the problem questions.
• chapter 5 discusses about the research method and approach to solve the problems of this thesis.
• Chapter 6 describes the data collection protocol used in this thesis work which includes participants, primary data collection system setup and ethical statement.
• Chapter 7 proposes and disscusses about solution and implementation. It discusses about face detection method and vairous heart rate extraction methods.
• Chapter 8 shows the results and evaluation with test cases and a comparative study. It also disccuses about memory and CPU utilization of the proposed solution.
• Chapter 9 draws a conclusion and a overview of the thesis.
• Chapter 10 consists of Discussing the limitations and mentions about some future work.
1.2
Goal of the thesis
Since all the physiological parameters have their own value and have different ways to discover them, the more user-friendly it is to extract a single parameter such as heart-rate, the more it draws attention in the research field. An electrocardiogram is normally used in medical settings to find out those parameters that would tell about physiological condition of that person, but we don’t forget that it needs its own setup to be able to work. So it has limitations and cannot perform in other use cases like remote measurement for telemedicine or in a place where a person needs to be monitored while driving. These are a few use cases of a non-contact monitoring and one of the purposes of the thesis is to study related work to find out more use cases and find a suitable low-cost solution.
The main goal of the thesis is to provide low cost, non-contact method for extracting heart-rate(HR) which can be used in real time embedded systems.
2
Background
Traditional sensor-based techniques for measuring physiological parameter require that sensor to be attached to a human body, such as ECG, pulse oximetry and so on. However, in a driving situation and in some remote medical situations, a normal sensor based method to check these parameters is not a suitable option because the person would not be in a situation where proper medical setup is possible. Besides, attaching various kind of sensor on different areas of a hu-man body while driving is uncomfortable. Some more use cases can be long-term elder care and workplace preventive care etc. Therefore, contact-less extraction of vital signs or physiological parameter is getting more and more importance.
Vital signs are physiological measurements which are correlated with most basic body functions. A number of physiological parameters like heart rate, eye blink frequency, respiration, blood volume pulse(BVP) etc also called as vital signs are connected to the physical conditions of a human,hence, they are very important features to diagnose.
2.1
Heart Rate
Heart rate is defined as the speed of the heartbeat that is the number of beats per minute(BPM) normally ranging from 60 to 100 for adults in resting condition and it can vary according to the physical needs of a body, including the need to absorb oxygen and excrete carbon dioxide. Activi-ties that can provoke dramatic change in heart rate include physical exercise, sleep, anxiety, stress, illness, ingesting, and drugs. The maximum rate can also vary depending on age of the person[2]. Heart rate is considered one of the primary vital signs which can be used to detect Arrhythmia [3] (irregular pulse) or Tachycardia(fast heartbeat) which are often life threatening.
2.2
Blood Volume Pulse
Blood volume pulse or BVP as it is called is changes in blood volume in the blood vessels happens in a cardiac cycle and this casues changes in amount of light reflection in a periodic manner on that area. This change can be measured through a BVP sensor or photoplethysmograph. according to Peper et al.[4], many of the home training devices rely on the BVP sensor because it is more user friendly than ECG used in medical settings. BVP measurment is described in the next section(2.3). Measurment of BPV opens up doors for other study related to blood volume such as BVP sensor can be relplaces by other type of sensors.
2.3
Photoplethysmography
Photoplethysmography represent measurement of changes in volume in different parts of the body [5] or it can be defined as an optically obtained plethysmograph that often produced by illumi-nating the skin in order to measures changes in light absorption. According to Shelley et al. [6] ”Photoplethysmographic (PPG) waveform, also known as the pulse oximeter waveform, is one of the most commonly displayed clinical waveforms. Technology behind the waveform is very simple - the waveform, as displayed on the modern pulse oximeter, is an amplified and highly filtered measurement of light absorption by the local tissue over time. It is optimized by medical device manufacturers to accentuate its pulsatile components. Physiologically, it is the result of a com-plex, and not well understood, interaction between the cardiovascular, respiratory, and autonomic systems. All modern pulse oximeters extract and display the heart rate and oxygen saturation derived from the PPG measurements at multiple wavelengths.”
There are two approaches to achieve the measurement. First, transmission mode PPG is a method by which pulse of light is passed through the body and a probe on the other side is used to detect variation in transmitted pulse. As some of the light is absorbed by the red blood cell in the body, changes will be evident in the absorption spectra. Second approach is reflectance-based PPG where source of light and probe is placed on the same side. The source of light is being ambient light and
the probe is inexpensive consumer camera. The measurement is taken by observing the changes in scattered back light from the region of interest. The reflected light will show weak reading in the range of 520 - 570 nm wavelength due to absorption. This part of the spectrum belongs to green channel in RGB color space. Hence, strong PPG signal is expected to show in green channel.
Figure 1: A general Photoplethysmography Waveform[?]
2.4
OpenCV
OpenCV or Open Source Computer Vision is a library of programming functions which is aimed at real-time computer vision and machine learning. OpenCV was originaly developed by Intel research center in Russia and the library now has more than 2500 optimized algorithms1. Thease
can be used to detect face, idenfify objects, track moving objects etc. OpenCV is vastly used in a related area of this thesis.
2.5
Independent Component analysis(ICA)
INdependent component analysis(ICA) is a statistical technique for decomposing a complex dataset into independent sub-parts. It is often explained with cocktail-party problem2 where focus on a particular conversation in a noisy room is described. If we consider 2 seperate signal that can be denoted by
x1(t) = a11s1 + a12s2andx1(t) = a21s1 + a22s2 Where,
a11, a12, a21, a22
are some parameters that depend on the distances of the listening device(ear, microphone) from speakers. The focus of the solution here is to estimate two original speech signals s1(t) and s2(t) using only mixtures x1(t) and x2(t). It is always a good idea to normalize the data before applying ICA. ICA has several applications such as finding hidden factor in financial data, reducing noise in natural images as so on.
1http://opencv.org/about.html
3
Literature Review
This section is to highlight the related works done by others to get an idea on how they have approached the research and method to solve related problems. This thesis demands an intimate literature study on different technologies and their purpose to achieve the same goal - contact-less monitoring of physiological parameters. It also needs a good amount of study on biological and medical facts to get a clear concept and reasoning. Primary literature review areas are- non-contact monitoring system, object recognition, contact-less vital sign extraction techniques, camera used in real time embedded systems and so on. These studies are useful for narrowing down the research area.
Contact-less vital sign monitoring has been an important research area in medical equipments for clinical diagnosis, sports training, telemedicine etc. This system can be used in an ideal environ-ment for clinical situations at hospitals or home. Maintaining this ideal situation and surroundings during data collection or examination does have an effect to the results or success of the system in these area of applications. That means any sensor system that does not need physical contact with the user or patient eventually need some proper instructions and somewhat strict handling protocol which is not a case in many situations like vehicle driving, remote medical services and so on. In future, this kind of intelligent systems will be embedded in the vehicles and remote situations; so it needs to be robust in critical situations and must be able to process information and generate a response in real time, otherwise it will not be useful and reliable.
Example of works done in the field of embedded systems for vehicle are for instance, driver monitor[7], cruise control system and face monitoring system[8]. However, driver monitoring sys-tem to get vital signs e.g., body Temperature, pulse Rate, respiration rate, eye-blink for determining sleepiness and stress level is yet to be established as a popular product that is embedded in cars. The aim is to design and implement a system that can diagnose useful physiological parameters using a camera in real time situations.
There are some literature which describe different approaches to achieve those goals such as this one [?] by Lewandowska, Rumiski and Kocejko(2011) which uses both webcam and thermographic camera for data collection. They used Independent component analysis(ICA) [9] for separating independent signals and Principal Component Analysis(PCA) [10] for signal processing. Another paper also uses FastICA and used Near-IR camera along with near-IR LED(Light Emitting Diod) instead of thermal or web camera. Wavelet analysis and Fast Fourier Transform(FFT) are also pop-ular data analysis and filtering techniques which are used in some projects. Gault and Farag(2013) introduced a fully automated method [11] where vascular mapping, blood perfusion modeling and wavelet analysis are used to calculate heart rate. Gault and Farag(2013) also found that 60% of vessel segments in the forehead region are capable of producing 85% accuracy of measurement or better. In 2010, Gault, Blumenthal, Farag and Starr proposed a method [12] to deal with nonin-vasive measurement of facial vasculature from thermal imaging, and estimates the waveforms and rates of the arterial pulse. Vascular mapping and multi-resolution analysis are used to calculate heart rate and this method offers a accuracy of 89% and above.
A Driver monitoring system for assessing stress or emotion measurement was proposed by Colin, Leslie, Ioannis, James and Justin(2005)[13] and have used thermal imaging in the proposal. They tried to monitor and study the blood flow in the frontal vessel of the forehead. Since, increase of blood flow would increase the temperature of that particular area, using a temperature sensor to measure those changes is very useful. Another considerable work on image based heart rate extraction is done by Wei, Tian, Wang, Ebrahimi and Huang(2013) in this chapter(pp. 281-292) [14] of the book Computer Vision ACCV 2012(Editors: Lee, Matsushita, Rehg & Hu, 2012). Wei et al. (2012) has used Laplacian Eigenmap and effective data filtering on Blood Volume Pulse has been operated in this particular project.
Most related works have been done on webcam or normal camera which works well in good light conditions but not effective in low or dark night conditions as well as with real life hazards. Here
is an example of a method developed by Zhao, Li, Qian & Tsien(2013)[?] which uses night vision camera as their image capturing tool and have good amount of success rate. They have used delay-coordinate transformation and independent component analysis-based deconstruction of the single channel images. For emitting false positives, ratio-variation probability distributions filter-ing is used here. Main focus of this project was to extract both heart rate and respiration rate for telemedicine.
Determining useful Region Of Interest(ROI) is also a vital topic and a conference paper in 2013 [15] determines forehead and cheek as two of most useful face regions for heart rate analysis. Datcu, Cidota, Lukosch, and Rothkrantz(2013) divided the face into multiple region of interests and then compare the extracted information between them. This discovery is to achieve optimized face scanning method and eventually a better result. Datcu et al.(2013) also showed in their earlier paper[16] that frame rate of 15fps is enough for heart rate analysis from video. Gault, Blumenthal, Farag and Starr from University of Lousisville has tried to extract vital signs using a thermal camera. Their pulse measurement process contains six steps after image acquisition, which are re-spectively: vascular map creation, vessel selection, tracking using error minimization, pulse signal creation, wavelet-based signal filtering, and pulse rate calculation.
An idea of imaging cardiovascular pulse was proposed by Sun, Garbey, Merla and Pavlidis(2005) where they extract a line-based region along the vessel. Then, Fast Fourier Transform (FFT) has been applied to individual points along this line of interest to capitalize on the pulse propagation effect. Finally, an adaptive estimation function is used on the average FFT outcome to quantify the pulse. In 2006 EMBS Annual International Conference, New York, a pulse measurement methodol-ogy was proposed by Sun and Pavlidis where they used facial tissue tracking algorithm, Fast Fourier Transform and estimation function for post processing. Garbey, Sun, Merla and Pavlidis(2007) had further improved their method in this paper[17] by using the following steps - temperature on the vessel from the thermal image is modulated by pulsative blood flow, computing the frequency of modulation (pulse) by extracting a line-based region along the vessel. Then, they apply Fast Fourier transform (FFT) to individual points along this line of interest to capitalize on the pulse’s thermal propagation effect. Finally, to quantify the pulse, an adaptive estimation function on the average FFT outcome is used. Another paper[13] by Marc Garbey, Sun, Merla, and Pavlidis(2005) tried to achieve the same goal using thermal camera and FFT. Rezaei and Klette(2011) from Uni-versity of Auckland focused their research on specific eye status detection for monitoring driver distraction. This [18] research developed optimum values of Haar-training parameters to create a nested cascade of classifiers for real-time eye status detection. Moreover, Most of the papers mentioned the problems of artifacts and artifact identification, which can be identified effectively through artifact detection algorithms and hence, yield a low false alarm rate [19].
There exist different approaches to detect physiological parameter than those are discussed above. Balakrishnan, Durand, and Guttag(2013) proposed a pulse detection method [20] with studying motion of the head. They used principal component analysis (PCA) to decompose their trajec-tories into a set of component motions. It then chooses the component that best corresponds to heartbeats based on its temporal frequency spectrum. Finally, it analyzes the motion projected to this component and identify peaks of the trajectories, which correspond to heartbeats.
Using camera in an embedded system is also a part of a field of this related work. According to Wolf, Ozer and Lv [21] ”Recent technological advances are enabling a new generation of smart cameras that represent a quantum leap in sophistication. While todays digital cameras capture images, smart cameras capture high-level descriptions of the scene and analyze what they see. These devices could support a wide variety of applications including human and animal detection, surveillance, motion analysis, and facial identification.”
The literature study that was performed before writing Chapter 3, consisted of searching for scientic papers in mainly two sources: Google Scholar3 and IEEE Xplore4. Sometimes full text
3www.scholar.google.com 4ieeexplore.ieee.org/
was not available through these websites. In that case, other websites like Researchgate3 is used.
Some important related works are listed in the table below for convenience of the reader.
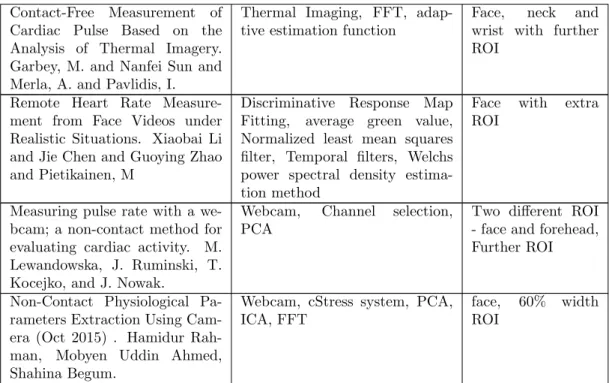
Title and Authors Tools and methods Area of observation Counting Heartbeats at a
Dis-tance, 2006. Nanfei Sun and Pavlidis, I
facial tissue tracking algorithm, Fourier analysis, FFT, Post pro-cessing with estimation function
Face, major facial vessels with extra ROI
A Fully Automatic Method to Extract the Heart Rate from Thermal Video, Aly A. Farag and Travis R. Gault
Thermal IR sensor, Vascular mapping, blood perfusion mod-eling, and wavelet analysis
Face with further ROI
Imaging the cardiovascular pulse, 2005. Nanfei Sun and Garbey, M. and Merla, A. and Pavlidis, I
FFT, adaptive estimation func-tion
Radial vessel com-plex, Carotid ves-sel complex, Super-ficial temporal ves-sel complex (inside face region). Monitoring of periorbital blood
flow rate through thermal im-age analysis and its application to polygraph testing, Pavlidis, I. and Levine, J
Thermal image acquisition, physiological correlation and pattern classification
Face
Remote Measurements of Heart and Respiration Rates for Telemedicine. Fang Zhao, Meng Li, Yi Qian, Joe Z. Tsien
delay-coordinate transformation and independent component analysis, probability distribu-tions filtering
Face
Noncontact Automatic Heart Rate Analysis in Visible Spec-trum by Specific Face Re-gions. Dragos Datcu, Marina Cidota, Stephan Lukosch, Leon Rothkrantz
Active Appearance Model for RGB seperation, de-trending, high-pass filter, ICA, FFT
Face, forehead and cheek using further ROI
Non-contact, automated cardiac pulse measurements using video imaging and blind source separa-tion. Ming-Zher Poh1, Daniel J. McDuff and Rosalind W. Picard
Matlab version of
OpenCV,finger blood volume pulse (BVP) sensor, blind source separation, ICA, Bland-Altman and correlation analysis
Face
Extraction of the superficial fa-cial vasculature, vital signs wave-forms and rates using thermal imaging, Gault, T.R. and Blu-menthal, N. and Farag, A.A. and Starr, T.
Thermal imaging, Vascular map-ping and multi-resolution analy-sis
Face
Multiresolution Approach for Non-Contact Measurements of Arterial Pulse using Thermal Imaging. Chekmenev, S.Y. and Farag, A.A. and Essock, E.A.
Thermal imaging, Multiscale De-composition (MSD), 3 different ROI, Continuous Wavelet Anal-ysis (CWA) framework and Pe-riodicity Detection (PD) algo-rithm are applied to these wave-forms to detect the ROM and fi-nal arterial pulse waveform
Face and neck with further ROI
3Researchgate is a social networking site for scientists and researchers to share papers, ask and answer questions,
Contact-Free Measurement of Cardiac Pulse Based on the Analysis of Thermal Imagery. Garbey, M. and Nanfei Sun and Merla, A. and Pavlidis, I.
Thermal Imaging, FFT, adap-tive estimation function
Face, neck and wrist with further ROI
Remote Heart Rate Measure-ment from Face Videos under Realistic Situations. Xiaobai Li and Jie Chen and Guoying Zhao and Pietikainen, M
Discriminative Response Map Fitting, average green value, Normalized least mean squares filter, Temporal filters, Welchs power spectral density estima-tion method
Face with extra ROI
Measuring pulse rate with a we-bcam; a non-contact method for evaluating cardiac activity. M. Lewandowska, J. Ruminski, T. Kocejko, and J. Nowak.
Webcam, Channel selection, PCA
Two different ROI - face and forehead, Further ROI
Non-Contact Physiological Pa-rameters Extraction Using Cam-era (Oct 2015) . Hamidur Rah-man, Mobyen Uddin Ahmed, Shahina Begum.
Webcam, cStress system, PCA, ICA, FFT
face, 60% width ROI
4
Problem Formulation and Thesis Contribution
To develop an intelligent environment to which a human can rely on is an important research topic in this thesis work. Reliability of a real time system or device depends on their response capability that means if they can respond in time and how accurate the diagnosed output is. Extracting vital signs from an image or video both in day and in low light condition or at night is even more challenging. Problem of this thesis are contact-less diagnostic system and real time application of the system in an embedded industry. Moreover, this thesis will also focus on the following research questions
-1. Which human body regions or areas that are most usefull and most convenient to extract physiological parameters like heart-rate using camera?
2. Does the relationship between blood volume pulse(BVP) and visible or diagnosable facial changes helps to study heart-rate?
3. Identification of data collection approach.
4. Are the requirements fullfiled with developing an algorithm which is compatible with a real time system?
Answers to above problem questions have been discussed in various chapters of the report. All of the answers have also been briefly discussed in the conclusion chapter for convenience of potential reader.
4.1
Thesis Contributions
Non-contact methods of physiological parameters are getting more and more attention for it’s ease of use but many related works uses expensive camera and sensors(thermal and NIR) which fails to reach to the purpose of mass people’s product. Thus a low cost method is desired. The main goal of the thesis is stated below
-This thesis acieves the mail goal by the following contributions:
• Study the literature review or state of the art regarding non-contact monitoring of physiolical parameters, medical facts behind BVP and HR, real time system requirements and so on. • Propose three different methods after having motivated and directed by related works. • Data collection from 8 participants.
• Experiment and evaluate the data with different methods. • Statistical analysis of the results.
5
Research Method and Approach
5.1
Research Method
Research method that has been roughly followed in this thesis is called Deductive Approach. According to Wilson[22] ”A deductive approach is concerned with developing a hypothesis (or hypotheses) based on existing theory, and then designing a research strategy to test the hypothesis” and the steps in it looks like the below figure 2
Figure 2: Steps in deductive approach
It seems that the working process in this thesis is loosly related to this kind of approach where difference methods has been tried and the outcomes is examined to take or leave a hypothesis in this research work. Throughout the study many ideas was gathered from related study or liter-ature review and then particular ideas has been left out from the final method through different examination. For example, the following steps shows how a particular problem question has been solved by using deductive approach
-1 Theory: A several related work including, Travis et al.[11] and many other have done face detection using Open Computer Vision library and a further region of interest method to approach similar solution as this thesis work.
2 Hypothesis: If it is possible to detect HR from human face using non-connected sensor e.g. camera.
3 Observation: How many subject and different skin color, light camera and statistical methods used for evaluation.
4 Confirmaiton: If the success rate of the result is above 90 percent, then it is accepted , oth-erwise rejected.
5.2
Approach
This thesis is about exploring an algorithm for contact-less diagnosis of physiological parameters that can eventually be fit in an embedded device, be it a medical device or other. It is important to focus on using the right tools and mechanism and develop an useful method to solve the problem. Preliminary idea of the methodical approach is described below:
1. Related study and literature review is needed for acquiring proper knowledge about such exist-ing intelligent systems used in industry, face and eye detection algorithms, image processexist-ing, signal processing and filtering, important physiological parameters and vital signs. The main algorithm needs to detect the subject and focus on the region of interest(ROI) so that it can then study on that particular area.
2. Determining proper tools or hardware for example camera. Related study shows that ther-mal, NIR and web camera are mostly used by researchers. This opens up possibilities to study about different electromagnetic spectrum for example heat and light. Since a normal camera works fine while good amount of light available but cannot work well in the dark, other camera that can detect other electromagnetic spectrum will be useful here.
IR/Thermal camera. ECG(Electrocardiogram) data of a number of subjects will also be recorded at the same time for validating. This data collection protocol will help organizing data and increase re-usability. Refer to the section 5 for details.
4. Since this system needs to respond in real time, focus on the timing constraints while de-signing algorithm is an important issue. It needs to study the possibility of the system being event triggered or time triggered that means a part of the system can be event triggered and another part can be time triggered. Execution time testing of tasks can be done on a multiprocessor and can be determined if the algorithm fits to a micro-controller that can be used in embedded systems. This can be achieved through a comparison between clock speed of those two processor/controller. 5. Focus will also be on memory constraints issue. Test with algorithms to filter data for ac-quiring useful data and discard the rest so that they can fit in a smaller memory storage.
6. Study and test with best methods for filtering and data analysis tools and algorithms are essential for extracting useful features from existing data available. For example in order to study on independent components, signal separation can be done with an ICA techniques like FastICA and JADE. Conversion between frequency and time can be done with FFT. There are other filter-ing techniques like Band-pass, high-pass filterfilter-ing and so on.
7. Evaluate and validate results with raw data taken from other sensor sources e.g.,ECG, ve-hicle data. Success of the research work can be measured on this validation phase.
6
Data collection
The aim is to collect video/image from the subjects that would be used to extract physiological signs, heart rate in this case. Along with video recording, physiological signals such as heart-rate has been collected as a reference signal.
Method of data collection are divided into several parts:
6.1
Participants
• 8 participants • Male and female
• Various skin color including Caucasian, Asian and brown skin • Age standard: Adult (18 - 35)
• All of the participants are students of Malardalen University
Participants are assumed to be healthy with no physical or psychological disorder and all of them were drug free during data collection. Participents were also be alcohol free for 48 hours prior to the experiment.
6.2
Primary data collection
This procedure includes system setup for baseline data recording which is discussed below: • Heart rate signal has recorded using ECG and respiration sensors system named cStress4 5.
This ECG signal was captured simultaneously with videos capturing.
• Data recording has been conducted indoor with two different light conditions 1. Normal light and
2. Low light condition.
All of the data has been recorded in artificial light environment.
An web-camera of a personal computer is used for video recording. The distance between subject and camera is ranging from 0.5 to 2 meters in both of the cases. The participants were allowed to have natural movements while sitting and looking straight to the camera. These natural movements include eye-blink and face and shoulder movement due to breathing. Images was captured over a period of time between 1 to 3 minutes.
6.3
Ethical statement
• All of the participants have been informed fully about the purpose and intended possible uses of the data prior to the experiment.
• The confidentiality of information provided by research perticipants has maintained.
• All of the participants have participated in a voluntary way, free from any coercion.
• There has been no possibility of harm to the participants.
• A few images or screenshots of participants has been used in this report for demonstration purpose. These images has been used with permission from the participants.
4http://stressmedicin.se/neuro-psykofysilogiska-matsystem/cstress-matsystem/ 5www.pbm.se
• No approval was taken from external organisations and this information has been delivered to all of the participants.
7
Proposed Solution and Implementation
This chapter includes the methods used and how solving the problem has been implemented. Also the design and method is presented here both for face and ROI detection and extraction of heart-beat from video sources. If we consider the whole scenario as small steps, then there are quite a few of them
-1. Detection of face of a human.
2. Select the Region Of Interest(ROI) within the image and particularly within the face area 3. Analyze ROI for extraction of a physiological signs.
7.1
Face detection and ROI Tracking
The face detection very much depends on the contrast- and light condition of the environment. The method used here to detect and track faces in this thesis is a Haar feature-based classifier[23] which is very widely used. A Haar-like feature is basically a rectangle divided into regions, where mean value of pixels in different regions are subtracted from each other. The Haar classifier detects faces using the knowledge that some regions of the face are darker than others. To do this a clas-sification model must first be created, also called cascade classifier. The cascade classifier consists of series of different relatively positioned Haar features( cascade of features). When certain area of the sample fails in the test for current feature,it is rejected from further scrutiny. A successful feature detection must pass all the features in the cascade. The model is created automatically by training the classifier on thousands of positive and negative images i.e. images with and without faces.
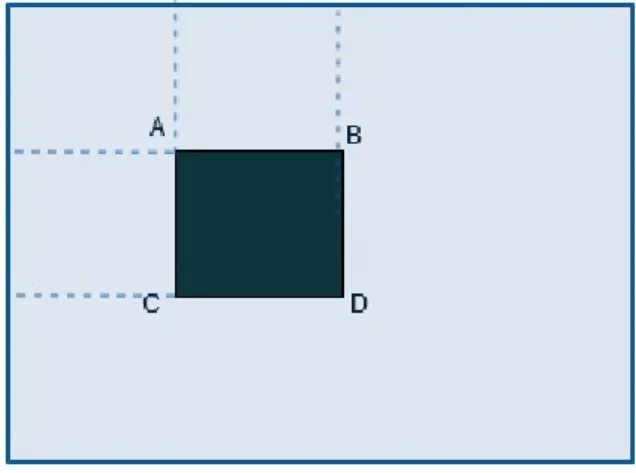
Haar features was first described by Viola and Jones(2001)[23], and works by taking a scalable rectangle in the image and count its shaded pixel and comparing it:
Sum=I(C)+I(A)-I(B)-I(D)
where all points A,B,C,D belongs to the integral image [24] as seen in fig 3 . Benefit of this method is that when it handles integral images Haar features can be evaluated within constant time O(1) irrespective of how big or small these features are. Moreover, face, eye or other recog-nition system can be obtained by training with a boosting algorithm like Ada-boost [25] by large set of positive and negative cases.
Figure 3: Integral image
Haar-cascade classifiers that is being used in this thesis is pre-trained classifiers which are part of Opencv library and generally very fast. According to Xiaobai Li[26] it is not an efficient idea to calculate a large number of sub-images for a small number of features that are needed to
determine if that particular sub-image has desired object. A further region-of-interest(ROI) tracker is developed. This tracker restricts area of the image to a useful ones by taking a minimum scale of possible face position of the area around previously detected face. This technique cost little time when trying to re detectect the face. The developed ROI tracker is also able to recover from unsuccessful detection or disappearance of tracked object. Figure 4 shows three different layers for face and ROI tracking.
Figure 4: Tracking of the face and Region of Interest(ROI)
The blue rectangle represents the area where it is trying to detect the face. The green rectangle shows detected face and the red one shows actual area or the Region Of Interest(ROI) from where data is extracted.
7.2
Heart rate Extraction
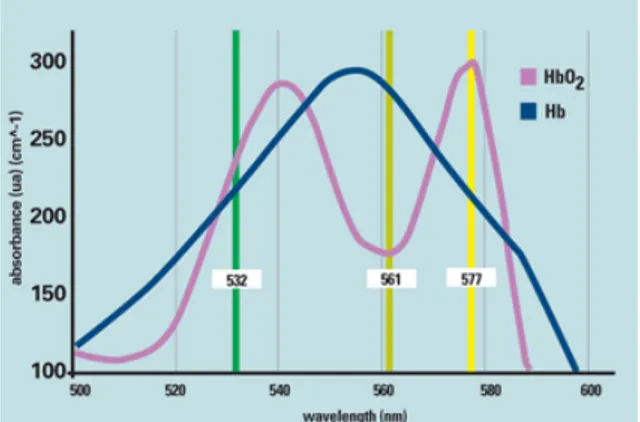
As PPG is discussed in the first chapter (section 1.2.3), different parts of cardiac cycle has dif-ferent amount of blood present in veins and therefor, this also happens in the face area which is well supplied with blood [27]. Strong PPG signal is expected to show in green channel and that is because the presence of hemoglobin in blood which absorbs green light. This changes can be de-tected and separated from other sources of changes in color. Figure5 below depicts the insight here.
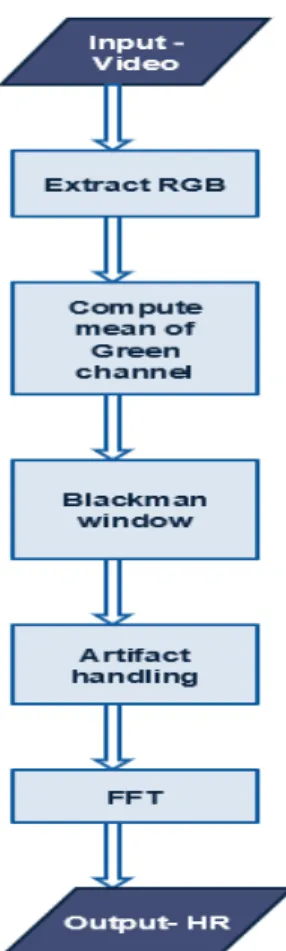
7.2.1 Method-1
This method is a combination of filters over RGB signal and Fourier transform. The video signal is first converted into matrices for RGB channels. Mean value of the green channel has been com-puted and this value is then used as input value at each time. Here, input means input to the filters applied. The next step is to de-trend, remove the constant part of the signal and apply filtering to the data. The filter used in this method is Windowed-sinc[28] high-pass filter with Blackman Window. An equation for Blackman window is given below.
W [i] = 0.42 − 0.5cos(2π ∗ i
M ) + 0.08Cos( 4π ∗ i
M ) Where, M + 1 equals to total number of points.
Figure 5: Light absorption by Hemoglobin
This method can also be combined with other filters or detrending process like Linear Interpo-lation [29] or Gaussian filter [30] but tests shows that these would give no better result.
The next step is to remove artifacts artifacts which comes to the signal because of the movement of object and other sources. The following approach is taken for handling and removal of the existing artifacts - if filtered output value is outside defined interval, it was considered as product of one time artifact and output value was set to 0.
HR = 60 ∗ indexT oF req Where,
indexT oF req = index ∗ F P S 2 ∗ size
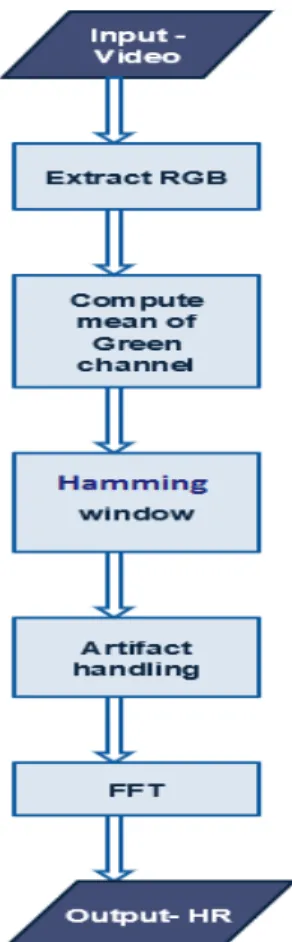
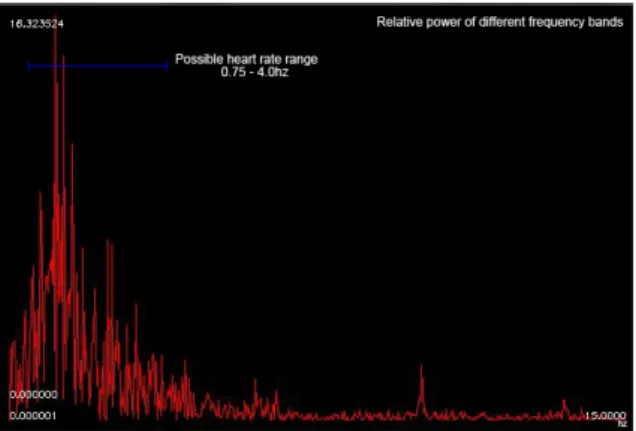
Then the signal needs to be studied in the frequency domain. To achieve this, Discrete Fourier Transformation (FFT, in this case) [31] is performed on the signal with windowing of 512 samples, which equals to around 15-20 second of signals depending on the frame rate of the video. It is better to have an even number of the sample because FFT works best with it (has magnitude power of 2). (see in fig-8). Since heart rate should be the only really periodical source in the signal, the strongest periodic signal in frequency between 45-180 bps is considered as heart rate. Figure 6 is to visual idea of the steps of this method.
7.2.2 Method-2
This method is very similer to the first method applied and has a close or inferior result. This has a slightly different filter than the earlier one. Instead of using Blackman Window, this filter uses Hamming Window. Below equation represents this windowing technique.
W [i] = 0.54 − 0.46cos(2π ∗ i M ) Where, M + 1 equals to total number of points.
Figure 7: Flowchart of Method 2
All the other steps in this method is exactly the same as Method 1. Description of those steps all over again has been skipped to avoid redundancy. See the Result chapter for comparison study between this two windowing techniques in detail. Figure 8 gives an example output of discrete furrier transformation representing data in frequency domain with peak around subjects current heart rate. Both of method 1 and 2 have similar FFT outputs.
Figure 8: Discreate Fourier Transformation of filtered data
7.2.3 Method-3
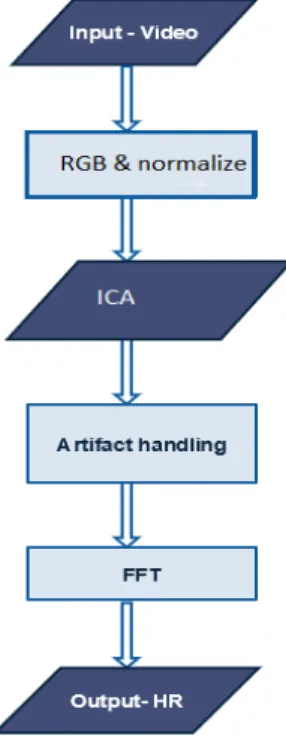
The third method consists of Independent component analysis(ICA) [9]. This method is to study some independent sources of the original signal. This means that these independent signals which are extracted by a ICA technique will have the information of all three (RGB) channels. Imple-mentation of fastICA [9] is tested in Matlab 2013a.
First step in this method is to extract RGB signals and then normalize those before applying ICA on the detrending signal and it gives multiple independent signals with mixed RGB values. Then ,it is time to study those signals to determine which signal gives the most valuable infor-mation about the signal which is significant to the heart rate. Fast Fourier transforinfor-mation(FFT) [31][32] is applied. The signal that has most amplitude has been picked which is in the range between 45 to 180 and represents heart-beat. That is these numbers are the frequency of the peaks of the signal. Figure 7 shows steps of this method.
Here is an image (see figure 10) of independent components and their corresponding Fourier transformation.
8
Result and Evaluation
For testing the outcome or results, a test case has been developed from which a certain number of statistics on different area is presented in this chapter. It also gives the statistics of comparison between different methods. The result section is divided firstly into two parts - Face and ROI detection and heart beat detection. There is an entire section dedicated to the analysis for CPU utilization and memory analysis because these are the very important criteria to fulfill so that the developed method can be used in a real time embedded system.
8.1
Test cases
For the test case , 20 videos of 2 min length has been recorded in different light conditions. While recording videos, heart rate measurement was also taken with the help of an ECG machine at the same time so that the results can be verified with ECG data. More of data collection can be found in chapter 3. Morever, some important code and visual output will be shown in Appendix chapter.
8.2
Face and ROI detection
Face detection and ROI selection was very successful in almost all of the cases with very few in-correct detections. Some images are presented here to show the face detection of different persons of different skin color.
(a) Participant-1: Asian, Normal light (b) Participant-2: Caucasian, Good light
(c) Participant-3: Asian(brown), Normal light (d) Participant-4: Caucasian, Normal light
For face detection test, an algorithm has been defined so that the program give an alert when no face is detected(see appendix). The table3 below shows a statistics of success rate
-Event no Detected 1 Yes 2 Yes 3 Yes 4 Yes 5 Yes 6 Yes 7 Yes 8 Yes 9 No 10 Yes 11 Yes 12 Yes 13 Yes 14 Yes 15 Yes 16 Yes 17 Yes 18 Yes 19 Yes 20 Yes
Table 2: Face detection incidents
Table 2 shows 20 incidents of face detection experiment. Some perticipants has experimented more than once for recording video on different light conditions. Table 3 shows the succes rate on different color and skin toned participant.
Combination Success rate
Low light + bright skin 100% Normal light + bright skin 100% Low light + dark skin 95% Normal light + dark skin 100%
Table 3: Success rate subjective to light and skin condition
Out of 20 videos, only one video in really low light condition and a person with dark skin tone had the case of unsuccessful face detection in time.
8.3
Heart rate extraction test
This section presents a comparison study between different methods that were tested on different subjects in this thesis. To give a quick recap here are the list of methods which will be compared with the original HR measure by
Cstress-1. Method 1: RGB + blackman window 2. Method 2: RGB + hamming window
3. Method 3: Bind source seperation + ICA
For this experiment, 15-40 seconds of prerecorded videos were picked to test with these algo-rithms. Then the average data for 1 minute is calculated from that existing result. The data given by these methods was examined with the original heart rate data from ECG signal.
8.3.1 Method-1 Evaluation
A figure is presented here to show the output data using method-1. Figure12 represents the signal of a random participant using this method and the original heart-rate signal which was taken using cStress(ECG) for comparison.
Figure 12: HR signal of a random participant using method-1(left) and cStress(right) This figure12 shows HR data(y-axis) over time(x-axis) for both the sources. Frame rate of the video has been used is around 30 fps(frame per second)which means there is 30 HR prediction value given per second. These data have been saved in a txt file for further statistical analysis. Such as the table4 below. It shows minimum, maximum and average heart rate of all of the par-ticipants/subjects. It has HR data from both sources - method-1 and cStress(ECG).
Features Participant-1 Participant-2 Participant-3 Participant-4 Participant-5 Participant-6 Participant-7 Participant-8 M-1 C M-1 C M-1 C M-1 C M-1 C M-1 C M-1 C M-1 C Max 79 78 78 86.7 140 130 92 89 120 130 115 110.09 122.3 111.39 74 70.76 Min 63 60 50 60 44 41 52 60 72.5 74.2 65 59.62 75 71.87 46.8 51.94 Avg 67.50 70.12 76.051 73.54 62.064 63.91 75.07 76.09 74.4 81.8 72 75.29 91 89.98 63 59.24 RSQ 0.9015 0.80844 0.9947 0.9993 0.9918 0.9684 0.9814 0.9441
Table 4: HR data using method-1 and ECG(cStress)
Where M-1 represents method-1 and C represents cStress. From the table, we can see that method-1 data does not always agree to the ECG data, but they have similar average data over the same period of time. For example, the 1st subject/participent has got an average value of 67.50 from method-1 which is quite cloe to the average value of 70.12 from ECG(cStress). This trend is followed by other HR data of different participants.
8.3.2 Method-2 Evaluation
Similar to the previous subsection, some figures are presented here to show the outputs using the second method in compare to HR data from ECG(cStress). Figure13 represents the signal of a random participant using this method and the original heart-rate signal which has been taken using cStress(ECG) for comparison.
Figure 13: HR signal of subject-3 from method-2(left) and cStress(right)
This figure13 shows HR data(y-axis) over time(x-axis) for both the sources(method-2 and ECG(cStress)). However the table5 below shows minimum, maximum and average heart-rate of all of the participants/subjects. It has HR data from both sources - method-2 and cStress(ECG).
Features Participant-1 Participant-2 Participant-3 Participant-4 Participant-5 Participant-6 Participant-7 Participant-8 M-2 C M-2 C M-2 C M-2 C M-2 C M-2 C M-2 C M-2 C Max 73 78 76 86.7 140 130 90 89 115.89 130 116 110.09 100 111.39 72.4 70.76 Min 64 60.3 50.3 60 47.2 41 51 60 80 74 55 59.62 72 71.87 64 67.94 Avg 68.42 70.12 69.58 73.54 63.35 63.91 74.14 76.09 73.25 81.8 69 75.29 94.6 89.98 60.8 59.24 RSQ 0.9946 0.9272 0.9924 0.9980 0.9253 0.9923 0.8561 0.7358
Table 5: HR data using method-2 and ECG(cStress)
Where M-2 means method-2 and C represents Cstress(ECG). Similar to method-1, method-2 has also given HR data which are close to the original heart-rate of the participant. We have done a corelation analysis to show which method gives more accurate value compared to original HR and this analysis is found in verdict subsection.
8.3.3 Method-3 Evaluation
Matlab implementation of method 3 on a random participant is depicted by figure which shows a side by side view of the signal from both sources, method-3 and cStress(ECG).
Table 6 shows minimum, maximum and average heart-rate of all of the participants/subjects. It shows HR data from both sources - method-3 and cStress(ECG).
Where M-3 represents method-3 and C represents cStress. More statistical analysis can be found in table 8.
Figure 14: HR signal of subject-3 from method-2(left) and cStress(right)
Features Participant-1 Participant-2 Participant-3 Participant-4 Participant-5 Participant-6 Participant-7 Participant-8 M-3 C M-3 C M-3 C M-3 C M-3 C M-3 C M-3 C M-3 C Max 69 78 77 86.7 150 130 96.5 89 120.3 130 100 110.09 93.2 111.39 81.1 70.76 Min 64 60 50.3 60 50.2 41 50 60 83 74.2 50 59.62 60 71.87 65 51.94 Avg 66.2 70.12 66.58 73.54 70.5 93.91 80.4 76.06 86.3 81.8 80.5 75.29 81.6 89.98 50 59.24 RSQ 0.9802 0.9861 0.9967 0.9871 0.9978 0.8876 0.9522 0.3883
Table 6: HR data using method-3 and ECG(cStress)
8.3.4 Verdict
From the experiments it was found that the first method gave the most accurate results comparing to other methods.
A table is constructed to show the statistics to compare between methods. Table 8 shows the correlation analysis between average heart-rate that has method-1 method-2 and method-3 has delivered. There are plenty of implementation of correlation coefficient(corrcoef() function) and one has been used here. In this particular case, matlab implementation and another Statistics calculator2has been used. For RSQ, Microsoft Excel 2013 has been used.
Participants Correlation Coefficient
M1 M2 M3 1 0.93 0.97 0.9901 2 0.923 0.9717 0.9931 3 0.9974 0.9961 0.9953 4 0.999 0.99 0.9937 5 0.9959 0.9628 0.9989 6 0.98 0.9923 0.8922 7 0.9907 0.8692 0.9758 8 0.9717 0.98 0.8118 Avg RSQ 0.9487 0.9277 0.8970
Table 7: Statistical analysis(Correlation Coefficient) and avg RSQ of different methods and par-ticipants
Table 7 shows the correlation coefficient of maximum, minimum and average value of all the 8 participants using method-1, method-2 and method-3. Correlation coefficient has been calculated
with the maximum, minimum, and average value that we have got from cStress. It represents how closely correlated each value with it’s cStress counterpart. From the table we can see that method-1 and method-2 has better correlation coefficient than method-3 which has occurances of correlations that are below 90%.
Method 1 Method 2 Method 3
Max Coefficient 0.9990 0.0.99 0.9989
Min Coefficient 0.923 0.8692 0.8118
Avg Coefficient 0.9487 0.9277 0.8970
Table 8: Statistical analysis(Correlation Coefficiant) between different methods
Table-8 shows the minimum, maximum and average corelation coefficient of heart-rate from all of the methods and cStress. From this table , it can be seen that method 1 has an average correlation coefficient of 0.948 which is the highest among 3 methods. That means it gives the most accurate result closer to the original heart rate measured from ECG(cStress), nevertheless, method 2 and 3 also has given good results as well.
8.3.5 Different light conditions
Different light conditions gave slightly different results while using the same algorithm. In low light conditions, images tend to have more noise and more artifacts resulting inferior result both for filtering and it’s Fourier transformation. Figure 15 and 16 shows different outputs for video in different light conditions. Different amount of accuracy in the result(previously shown) is due to slighly different light effects.
Figure 16: Filtered signal: Bad
8.4
CPU utilization and memory testing
The algorithm that has been developed in this thesis work aims to be used as real time embedded system. A real time system need to supply information and decisions in real time and need to less demanding to CPU cost and memory. To justify the efficiency of the algorithm, a program was written in C++ language. OpenCV (Open Source Computer Vision Library) which is an open source computer vision and machine learning software library, was used as a core library.
A number of statistics have been gathered from a few tests using this C++ program and prerecorded videos. Tools that were used for this testing are as follows
-1. Microsoft visual studio 2013
2.Performance and diagnostic tool for Microsoft visual studio
8.4.1 CPU use
The first report is on CPU consumption by the program. Figure 17 is the diagnostics session for about over 1 minute data. This shows percentage of CPU utilization cost by the process. It also shows the hot path that is which functions are doing most individual work and it can clearly be seen that link library for OpenCV is among the top.
The second image shows CPU utilization of same amount of data and the functions that uses much of the CPU. The whole program cost 20% of the CPU but there are some function used here for plotting or logging the data which costs a lot memory. These types of functions can be avoided while writing similar program for an embedded system equipment because normally they do not contain a personal computer with a display. These figures also shows that after tracking the face, the program is really consistent in CPU and memory consumption.
8.4.2 Memory Use
The second thing to care is the memory consumption because the program cannot fit in an em-bedded system if it is too big in size. The executable application for windows(heartBeatTest.exe) is about 270KB in size. But the main concern is the amount of memory it uses. Figure 19 shows the memory consumption by the process.
From figure-19, it can be seen that the memory consumption by the program remain nearly con-stant(around 67MB) after certain time. That is when the program finishes detecting face and ROI and start detecting and logging the hear-rate and fps information. From the graph, it looks like that face detection phase is taking too long but the delay (from 0 to 27 seconds) was due to manual supplying of the video to the program. Basically the face detection works very fast (less than 1 second). Besides it does not save any image rather it logs and saves heart-rate and FPS information in a text file which is of-course very little in size (typically under 1 MB) depending on how much information it saves. Information that are logged into the file for quite some time can be discarded in a timely manner (about 2 minutes, in this case). This can be modified depending
Figure 17: CPU utilization and HOT path
Figure 18: CPU utilization by functions
on the purpose and profitability of the solution. This resolves the problem with unimportant data storage.
This amount of memory and CPU uses can be handles by small microprocessors like BeagleBone Black1and Raspberry Pi2or even smaller ones available in the market. That is this kind of system
can easily be applied into these kind of microprocessors where there are connections (usb, ethernet etc) available to integrate simple inexpensive camera.
1http://beagleboard.org/BLACK 2https://www.raspberrypi.org/
9
Discussion, limitations and future work
9.1
Discussion
Four problem questions has been defined in chapter 4 to address the problem which eventually has led this research to the following solutions or answers
-Which human body regions or areas that are most usefull and most convenient to extract physiological parameters like heart-rate using camera?
From table 1 in the literature review chapter, almost all of the related works can be found that have used face as their region of interest for heart-rate extraction. Reasons behind the phenomena are - there are several superficial vessels on the face and those tissue areas in the face are usually exposed naked. It is also probem by the result I got in this thesis. Besides, another related work [?] determines that two facial areas namely forehead and cheek are more relevant for computing the heart-rate.
Does the relationship between blood volume pulse(BVP) and visible or diagnos-able facial changes helps to study heart-rate?
Yes it certainly does because from the background chapter we see that volume of blood changes in a cyclic order that is related to heart pump. Result also shows that if we can study the face with good methods, then it is not very hard to follow the heart beat.
Are the requirements fullfiled with developing an algorithm which is compatible with a real time system?
The algorithm that i developed certainly fits in a small purpose micro-controller in terms of CPU it used and time it takes. This method does not have any time limit and can read and process data for unlimited time. Storage it should take, if it runs for long time, is managed by dumping logged data when it reaches any given data limit. The code for this can be found in Appendix.
Identification of data collection approach
Proper data collection method is written for dara acquisition for this research work. It has a primary protocol and ethical declaration as well.
9.2
Limitations and Future Work
Some limitations and future work that can be acheived is given below
-• This research work can have the aim to use the developed algorithm in real time embedded systems and further research to achieve the same goal in a really dark environment would be pursued hopefully in the future.
• This solution extracts only heart-rate for the moment and can be extended to determine heart rate variability and some other physiological parameters
• No formal Ethical approval from government organization has been taken for this thesis. It would be necessary for future when the research grows bigger and has to take data from outside school.
• More types of camera (ex. thermal) can be used in future for more experiment and new directions in this field.
10
Conclusion
A research has been going all through the thesis period and a few methods have been proposed and compared for extraction of a physiological parameter(heart-rate in this case) from a normal, low-cost video camera. The following steps have been followed to achieve the goal - Face detection from a video, Selection of region of interest(ROI), heart-beat extraction by observing particular ROI, represent data and evaluate results with real heart-rate data. The tools, methods and imple-mentation have been selected and used in a way that the proposed solution can be modified to be used in real-time embedded systems.
There are a few other points worth mentioning about the overall result
-- The smaller Region Of Interest(ROI) tracking method, the lesser data is to be processed, that is less memory consumption and less time consumption.
- Because of ICA uses all the information of RGB in a mixed matter, it sometimes has more false data because of more mixed up data and more artifacts. Hence, the result was not as optimal as the other methods that are proposed in the thesis.
- Generally Laptop and mobile cameras have some built-in optimization and the image signal get a little modified. That results in distorted data supplied to the program which makes it harder to analyze the data. That is to say, a better quality camera would give a better result.
- Between Method 1 and Method 2, there is negligible different in memory and time consump-tion. Method 1 costs a tiny bit more memory and time though it gives a better result.
- The proposed system can be modified and tailored to use to detect a person’s mental and physical state based on the data collected in real time. This can be useful in situations like driving in cars, remote medical situations, old-care solutions and so on. In that case, a decision-making system should be developed on the top of this proposed method.
References
[1] S. McKernon and N. Z. L. T. NZ., A Literature Review on Driver Fatigue Among Drivers in the General Public, ser. NZ Transport Agency research report. New Zealand Government - NZ Transport Agency, 2009. [Online]. Available: http: //books.google.se/books?id=FwVzPgAACAAJ
[2] H. Tanaka, K. Monahan, and D. Seals, “Age-predicted maximal heart rate revisited,” Journal of the American College of Cardiology, vol. 37, no. 1, pp. 153 – 156, 2001. [Online]. Available: http://www.sciencedirect.com/science/article/pii/S0735109700010548
[3] H. Greenberg, “Cardiac arrhythmias: Their mechanisms, diagnosis, and management,” JAMA, vol. 258, no. 10, p. 1399, 1987.
[4] R. I.-M. L. T. H. Peper, E. Harvey and D. Moss, vol. 35, p. 54, 7 2007.
[5] W. Verkruysse, L. O. Svaasand, and J. S. Nelson, “Remote plethysmographic imaging using ambient light.” Optics express, vol. 16, pp. 21 434–45, 2008 Dec 22 2008.
[6] A. A. Aymen and H. Kirk, “Photoplethysmography,” vol. 28, 2014.
[7] D. Baldwin, K. C. Duncan and S. K. West, The Driver Monitor System: A Means of Assessing Driver Performance. Johns Hopkins APL Technical Digest, 2004.
[8] M. Sigari, M. H. Fathy and M. Soryani, “A Driver Face Monitoring System for Fatigue and Distraction Detection,” 2013.
[9] J. Cardoso, “High-order contrasts for independent component analysis,” Neural Comput., vol. 11, no. 1, pp. 157–192, Jan. 1999. [Online]. Available: http://dx.doi.org/10.1162/ 089976699300016863
[10] H. Abdi and L. Williams, “Principal component analysis,” Wiley Interdisciplinary Reviews: Computational Statistics, vol. 2, no. 4, pp. 433–459, 2010. [Online]. Available: http://dx.doi.org/10.1002/wics.101
[11] T. Gault and A. Farag, “A fully automatic method to extract the heart rate from thermal video,” in Computer Vision and Pattern Recognition Workshops (CVPRW), 2013 IEEE Con-ference on, June 2013, pp. 336–341.
[12] T. Gault, N. Blumenthal, A. Farag, and T. Starr, “Extraction of the superficial facial vascula-ture, vital signs waveforms and rates using thermal imaging,” in Computer Vision and Pattern Recognition Workshops (CVPRW), 2010 IEEE Computer Society Conference on, June 2010, pp. 1–8.
[13] C. Puri, L. Olson, I. Pavlidis, J. Levine, and J. Starren, “Stresscam: Non-contact measurement of users’ emotional states through thermal imaging,” in CHI ’05 Extended Abstracts on Human Factors in Computing Systems, ser. CHI EA ’05. New York, NY, USA: ACM, 2005, pp. 1725–1728. [Online]. Available: http://doi.acm.org/10.1145/1056808.1057007 [14] L. Wei, Y. Tian, Y. Wang, T. Ebrahimi, and T. Huang, “Automatic webcam-based human heart rate measurements using laplacian eigenmap,” in Computer Vision ACCV 2012, ser. Lecture Notes in Computer Science, K. Lee, Y. Matsushita, J. Rehg, and Z. Hu, Eds. Springer Berlin Heidelberg, 2013, vol. 7725, pp. 281–292. [Online]. Available: http://dx.doi.org/10.1007/978-3-642-37444-9 22
[15] D. Datcu, M. Cidota, S. Lukosch, and L. Rothkrantz, “Noncontact automatic heart rate analysis in visible spectrum by specific face regions,” in Proceedings of the 14th International Conference on Computer Systems and Technologies, ser. CompSysTech ’13. New York, NY, USA: ACM, 2013, pp. 120–127. [Online]. Available: http://doi.acm.org/10.1145/2516775.2516805
[16] Springer-Verlag, Ed., Learning AAM fitting with kernel methods, vol. 7267. Zakopane, Poland,: Springer, 2012 2012.
[17] M. Garbey, N. S., A. Merla, and I. Pavlidis, “Contact-free measurement of cardiac pulse based on the analysis of thermal imagery,” vol. 54, no. 8, Aug 2007, pp. 1418–1426.
[18] M. Rezaei and R. Klette, “3d cascade of classifiers for open and closed eye detection in driver distraction monitoring,” in Computer Analysis of Images and Patterns, ser. Lecture Notes in Computer Science, 2011, vol. 6855, pp. 171–179. [Online]. Available: http://dx.doi.org/10.1007/978-3-642-23678-5 19
[19] G. Berntson, K. Quigley, J. Jang, and S. Boysen, “An approach to artifact identification: Application to heart period data,” Psychophysiology, vol. 27, no. 5, pp. 586–598, 1990. [Online]. Available: http://dx.doi.org/10.1111/j.1469-8986.1990.tb01982.x
[20] G. Balakrishnan, F. Durand, and J. Guttag, “Detecting pulse from head motions in video,” in Computer Vision and Pattern Recognition (CVPR), 2013 IEEE Conference on, June 2013, pp. 3430–3437.
[21] W. Wolf, B. Ozer, and T. Lv, “Smart cameras as embedded systems,” Computer, vol. 35, no. 9, pp. 48–53, Sep 2002.
[22] J. Wilson, Essentials of Business Research: A Guide to Doing Your Research Project. SAGE Publications, 2010. [Online]. Available: https://books.google.se/books?id=BnFymS0cjLsC [23] P. Viola and M. Jones, “Rapid object detection using a boosted cascade of simple features,” in
Computer Vision and Pattern Recognition, 2001. CVPR 2001. Proceedings of the 2001 IEEE Computer Society Conference on, vol. 1, 2001, pp. I–511–I–518 vol.1.
[24] ——, “Robust real-time face detection,” vol. 57, no. 2. Hingham, MA, USA: Kluwer Academic Publishers, May 2004, pp. 137–154. [Online]. Available: http: //dx.doi.org/10.1023/B:VISI.0000013087.49260.fb
[25] Y. Freund and R. Schapire, “A decision-theoretic generalization of on-line learning and an application to boosting,” Journal of Computer and System Sciences, vol. 55, no. 1, pp. 119 – 139, 1997. [Online]. Available: http://www.sciencedirect.com/science/article/pii/ S002200009791504X
[26] X. Li, J. Chen, G. Zhao, and M. Pietikainen, “Remote heart rate measurement from face videos under realistic situations,” in Computer Vision and Pattern Recognition (CVPR), 2014 IEEE Conference on, June 2014, pp. 4264–4271.
[27] I. Pavlidis, J. Dowdall, N. Sun, C. Puri, J. Fei, and M. Garbey, “Interacting with human physiology,” Computer Vision and Image Understanding, vol. 108, no. 12, pp. 150 – 170, 2007, special Issue on Vision for Human-Computer Interaction. [Online]. Available: http://www.sciencedirect.com/science/article/pii/S107731420600230X
[28] S. Smith, The Scientist and Engineer’s Guide to Digital Signal Processing.
[29] M. Hazewinkel, Encyclopaedia of Mathematics. New Jersey, U.S.A.: Kluwer Academic Pub. [30] R. Haddad and A. Akansu, “A class of fast gaussian binomial filters for speech and image processing,” Signal Processing, IEEE Transactions on, vol. 39, no. 3, pp. 723–727, Mar 1991. [31] S. Smith, The Scientist and Engineer’s Guide to Digital Signal Processing. California Technical
Pub., 1997. [Online]. Available: https://books.google.se/books?id=rp2VQgAACAAJ
[32] T. Cormen, C. Stein, R. Rivest, and C. Leiserson, Introduction to Algorithms, 2nd ed. McGraw-Hill Higher Education, 2001.
![Figure 1: A general Photoplethysmography Waveform[?]](https://thumb-eu.123doks.com/thumbv2/5dokorg/4779058.127713/11.892.192.703.231.441/figure-a-general-photoplethysmography-waveform.webp)