Analysis of EEG Signals
For
EEG-based Brain-Computer Interface
Jessy Parokaran Varghese
School of Innovation, Design and Technology
Mälardalen University
Vasteras, Sweden
Supervisor and Examiner: Dr. BARAN ÇÜRÜKLÜ Date: July 2009
Abstract
Advancements in biomedical signal processing techniques have led Electroencephalography (EEG) signals to be more widely used in the diagnosis of brain diseases and in the field of Brain Computer Interface(BCI). BCI is an interfacing system that uses electrical signals from the brain (eg: EEG) as an input to control other devices such as a computer, wheel chair, robotic arm etc. The aim of this work is to analyse the EEG data to see how humans can control machines using their thoughts.In this thesis the reactivity of EEG rhythms in association with normal, voluntary and imagery of hand movements were studied using EEGLAB, a signal processing toolbox under MATLAB. In awake people, primary sensory or motor cortical areas often display 8-12 Hz EEG activity called ’Mu’ rhythm ,when they are not engaged in processing sensory input or produce motor output. Movement or preparation of movement is typically accompanied by a decrease in this mu rhythm called ’event-related desynchronization’(ERD). Four males, three right handed and one left handed participated in this study. There were two sessions for each subject and three possible types : Imagery, Voluntary and Normal. The EEG data was sampled at 256Hz , band pass filtered between 0.1 Hz and 50 Hz and then epochs of four events : Left button press , Right button press, Right arrow ,Left arrow were extracted followed by baseline removal.After this preprocessing of EEG data, the epoch files were studied by analysing Event Related Potential plots, Independent Component Analysis, Power spectral Analysis and Time-Frequency plots. These analysis have shown that an imagination or a movement of right hand cause a decrease in activity in the hand area of sensory motor cortex in the left side of the brain which shows the desynchronization of Mu rhythm and an imagination or a movement of left hand cause a decrease in activity in the hand area of sensory motor cortex in the right side of the brain. This implies that EEG phenomena may be utilised in a Brain Computer Interface operated simply by motor imagery and the present result can be used for classifier development and BCI use in the field of motor restoration.
Preface
I would like to sincerely thank the EURECA programme and Erasmus Mundus
External Cooperation window and Prof Dr. Sasikumar Punnekatt, the EURECA
Co-ordinator for selecting me and giving me an opportunity to learn in Europe.
Sincere thanks to Malardalen University for providing me with all the facilities
and guidance needed for my thesis work here. I also thank Amrita University and
Dr.Narayanankutty for permitting me to do my final year project at Malardalen
University.
I sincerely want to thank my supervisor Dr. Baran Cürüklü for providing me with
his valuable guidance irrespective of his busy schedule and gave me the chance to
do this wonderful experience that will help me all my life. I also want to give my
sincere thanks to Ozgur Ali Argunshah who gave me guidelines from Sabancci
University, Turkey, for analyzing the EEG signals.
Table of Contents
1 Introduction 6
1.1 Aim and Scope of the Thesis 6
1.2 Terminology 6
2 Biological Back ground 7
2.1 Human Brain 7
2.2 Sensory Motor Cortex 8
2.3 Brain waves and EEG 8
3 Brain Computer Interface 9
3.1 Definition and Applications of BCI 9
3.2 Principle of BCI 9
3.3 Types of BCI 10
3.4 Brain Signals for BCI 11
4 Related Work 12 4.1 ERS/ERD of Mu and Beta rhythm during Mental Imagery 12
4.2 Classification of EEG data for BCI 15
5 Problem Formulation 16
6 Method and materials 16
6.1 Subjects 16
6.2 Experimental Paradigm and EEG Recording 16
6.3 Preprocessing of EEG Data 17
7 Analysis of EEG Signals 19
7.1 Power Spectrum Analysis 19
7.2 Event Related Potential (ERP) plots 19
7.2.1 Channel ERP Image plots 19
7.2.2 ERP Comparisons 20
7.3 Time frequency Analysis 20
7.4 Independent Component Analysis 21
7.5 Component Clustering 22
8 Results 23
8.1 Power Spectral Plots 23
8.2 Channel ERP Image plots 24
8.3 Comparison of channel ERPs 26
8.4 Time frequency Plots 27
8.4.1. ERSP plots 27
8.4.2 Time frequency decompositions on all electrodes 29
8.5 Independent Component Clustering 30
8.5.1. kmeans clustering Results 30
8.5.1 Neural network clustering Results 33
9 Analysis of Results 36 10 Future work 37 11 Conclusion 37 12 References 38 Appendix A 40 Appendix B 44 Appendix C 45
1 Introduction
1.1 Aim and Scope of the Thesis
Advancements in biomedical signal processing techniques have led Electroencephalography (EEG) signals to be more widely used in the diagnosis of brain diseases and in the field of Brain Computer Interface. With the new understanding of brain function, the advent of powerful low-cost computer equipment and by the recognition of needs and potentials of people with disabilities, now the BCI research concentrate on developing new augmentative communication and control technology for those with severe neuromuscular disorders, such as amyotrophic lateral sclerosis, brainstem stroke, and spinal cord injury (Wolpaw et al., 2002). The present-day BCIs determine the intent of the user from a variety of different electrophysiological signals like EEG, ECoG etc. These signals include slow cortical potentials, P300 potentials, and mu or beta rhythms recorded from the scalp, and cortical neuronal activity recorded by implanted electrodes. They are translated in real-time into commands that operate a computer display or other device (Wolpaw et al., 2002).
The aim of this thesis work is to analyse the EEG data to see how humans can control machines using their thoughts by differentiating the event related synchronisation and desynchronisation of Mu and beta rythms occuring in the Sensory motor cortex of human brain during imagination of left hand and right hand movement. In this thesis the reactivity of EEG rhythms in association with normal, voluntary and imagery of hand movements were studied using EEGLAB, a signal processing toolbox under MATLAB.The results of this work are of practical interest for the development of an EEG classifier which can be used in a BCI for motor restoration.
1.2 Terminology
BCI- Brain Computer Interface ERS- Event Related Synchronization ERD- Event Related Desynchronization ERP-Event Related Potential
ERSP- Event Related Spectral Perturbation ITC- Inter Trail Coherence
2 Biological Back ground
Accurate measurements of EEG signals are very important for correct analysis of brain signals. Therefore, measurement locations are also important. So it is necessary to have an overall idea of anatomy and physiology of human brain before the explanation of proposed method.
2.1 The Human Brain
The Brain is the part of central nervous system which is located in the skull and controls the mental processes and physical actions of a human being (Gulli et al., 2003). The brain, along with the spinal cord and network of nerves, controls the information flow throughout the body, voluntary actions such as reading, talking, and involuntary reactions such as breathing and digestion (Gulli et al., 2003). The human brain is a soft, grayish-white, mushroom-shaped structure. The four principal sections of human brain are: Cerebrum (divided into two large paired cerebral hemispheres), Diencephalon (Thalamus and HypoThalamus), Cerebellum and Brain stem (Gulli et al., 2003).
Fig 1: The Parts of Human Brain
The cerebrum is the largest and uppermost portion of the brain. It consist of five paired lobes-frontal lobe which is associated with reasoning, planning, parts of speech, movement, emotions, and problem solving, parietal lobe which is associated with movement, orientation, recognition, perception of stimuli, occipital lobe which is associated with visual processing and temporal lobe which is associated with perception and recognition of auditory stimuli, memory, and speech within two convoluted hemispheres.
The two cerebral hemispheres are connected by the corpus callosum. The surface of each cerebral hemisphere is covered with a thin mantle of gray matter called cerebral cortex. The functional part of the cerebral cortex is a thin layer of neurons covering the surface of all the convolutions of the cerebrum. This layer is only 2 to 5 millimeters thick, with a total area of about one quarter of a square meter. The cerebral cortex contains six layers of neurons, beginning with layer I next to the brain surface and extending progressively deeper to layer VI The total cerebral cortex contains about 100 billion neurons (Guyton et al., 2005).
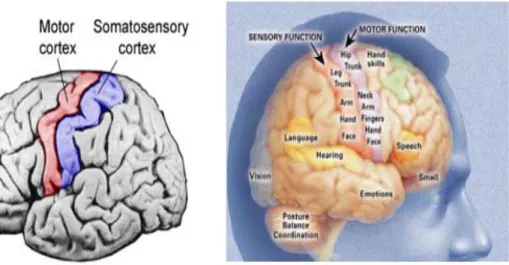
2.2 Sensory Motor Cortex
The human cerebral cortex is divided into about 50 distinct areas called Brodmann’s areas based on histological structural differences. The sensory signals from all modalities of sensation terminate in the cerebral cortex immediately posterior to the central fissure (also called central sulcus) which is called the somatosensory cortex. The anterior half of the parietal lobe is concerned almost entirely with reception and interpretation of somatosensory signals. But the posterior half of the parietal lobe provides still higher levels of interpretation (Guyton et al., 2005). The portion of the cerebral cortex anterior to the central fissure and constituting the posterior half of the frontal lobe is called the motor cortex and is devoted almost entirely to control of muscle contractions and body movements (Guyton et al., 2005). A major share of this motor control is in response to somatosensory signals received from the sensory portions of the cortex, which keep the motor cortex informed at each instant about the positions and motions of the different body parts (Guyton et al., 2005).
2.3 Brain waves and EEG
Electrical recordings from the surface of the brain or even from the outer surface of the head demonstrate that there is continuous electrical activity in the brain. Both the intensity and the patterns of this electrical activity are determined by the level of excitation of different parts of the brain resulting from sleep, wakefulness, or brain diseases such as epilepsy or even psychoses. The undulations in the recorded electrical potentials are called brain waves, and the entire record is called an EEG (Guyton et al., 2005). The intensities of brain waves recorded from the surface of the scalp range from 0 to 200 microvolts, and their frequencies range from once every few seconds to 50 or more per second. The character of the waves is dependent on the degree of activity in respective parts of the cerebral cortex, and the waves change markedly between the states of wakefulness and sleep and coma. Much of the time, the brain waves are irregular, and no specific pattern can be discerned in the EEG (Guyton et al., 2005).
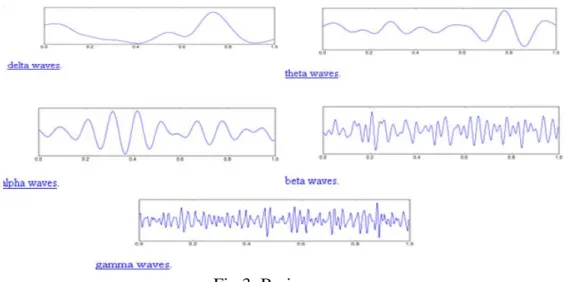
Fig 3: Brain waves
There are mainly five types of Brain waves: Delta waves(0.4-4 Hz) which occurs in sleeping adults, premature babies or if there is any sub cortical lesions and is found in the frontal region of brain in adults and posterior region in children , Theta waves (4-8 Hz) which occurs in children, in adults when they are in emotional stress or they have deep midline disorders and is found in parietal and occipital region, Alpha waves (8-13 Hz) which occurs in quiet resting state but not sleep and is found in the occipital region, Beta waves(13-30 Hz) which occurs in active ,busy, active concentration or anxious thinking state and is found in the frontal and parietal region and Gamma waves (26-100 Hz) and occurs in certain cognitive or motor functions.
3 Brain Computer Interface
3.1 Definition and Applications of BCI
A BCI is a communication system in which messages or commands that an individual sends to the external world do not pass through the brain’s normal output pathways of peripheral nerves and muscles (Wolpaw et al., 2002). For example, in an EEG based BCI the messages are encoded in EEG activity. A BCI provides its user with an alternative method for acting on the world (Wolpaw et al., 2002). BCI interfaces only to CNS, direct communication pathway between brain & external device in order to restore sight, hearing, movement, ability to communicate and cognitive function restoration.
BCIs are mainly used control and communication applications in medical field like controlling a motorized wheel chair or a prosthetic limb, restore mobility in paralyzed limbs by electrically stimulating muscles controlling home appliances, lights, television, room temperature, operate the door just by thinking, controlling a robotic car, play computer games, to decode brain activity to reproduce movements in Robotic arms(robotic arm control),controlling elements in virtual reality, walking in a virtual street by thought, typing a message on computer screen by concentrating on the display, controlling a computer cursor, for spelling words.
3.2 Principle of BCI
A BCI has an input (e.g. electrophysiological activity from the user), an output (i.e. device commands), components that translate input into output and a protocol that determines the onset, offset, and timing of operation(Wolpaw et al., 2002).
Signals from the brain are acquired by electrodes on the scalp or in the head and processed to extract specific signal features (e.g. amplitudes of evoked potentials or sensory-motor cortex rhythms, firing rates of cortical neurons) that reflect the user’s intent. These features are translated into commands that operate a device (e.g. a simple word processing program, a wheelchair, or a neuroprosthesis). (Wolpaw et al., 2002).Success of BCI operation depends on the interaction of two adaptive controllers, user and system. The user must develop and maintain good correlation between his or her intent and the signal features employed by the BCI; and the
BCI must select and extract features that the user can control and must translate those features into device commands correctly and efficiently (Wolpaw et al., 2002).
Fig 4: Basic Design and operation of BCI system
3.3 Types of BCI
BCI systems can be classified under different categories based on which type of signals are used, whether invasive or non invasive, whether feedback is provided or not. Accordingly the major classifications of BCI systems are:
1. Open loop BCI- without any feed back 2. Closed loop BCI-with feed back
1. One way BCI-Computers either accept or send signals
1. Invasive BCI: - In this type electrodes are implanted directly in to the grey matter of the brain during neuro-surgery thereby direct neural contact via pins. This is used for repairing damaged sight and provides new functionality to paralyzed people. Eg: ECoG based BCI.
2. Partially Invasive BCI:- In this BCI, electrodes are implanted inside the skull but outside the brain rather than within the grey matter.
3. Non Invasive BCI: - Here electrodes placed on the skull. Limitation is poor signal resolution because skull dampens the signal. Eg: EEG based BCI.
4. Cell culture BCI: - In this type of BCI devices to interface with neural cells and entire neural networks in cultures outside animals, and recording is done from individual neurons grown on semiconductor chip to learn how human brain performs at cellular level.
1. ElectroCorticography (ECoG) based BCI:- uses electrical activity of brain taken from beneath the skull, electrodes placed above the cortex beneath the dura matter.
2. EEG based BCI: - uses EEG signals from the scalp. The advantages are ease of use, non-invasive, reproducibility, low set up cost but extensive training is required before users can work, susceptibility to noise.
3. Magneto Encephalography (MEG) based BCI:- This is a non invasive BCI which uses the magnetic fields produced by electrical activity of brain.
4. fMRI based BCI- used for non invasive BCI. It measures blood flow in brain using MRI. Blood flow correlates to neural activity.
5. NIRS (near infra red spectroscopy) based BCI- uses the Infrared signals from the brain for their operation.
3.4 Brain signals used for EEG based BCI
EEG activity can be analyzed and quantified in the time domain, as voltage versus time or in the frequency domain, as voltage or power versus frequency .Both forms of analysis can be used for EEG based communication (Wolpaw et al., 2002). Also the various studies have indicated that people can learn to control certain features of EEG thereby the use EEG signals became more popular than all other types of BCI. The five commonly used brain signals for EEG based communication are:
1. Visual Evoked Potentials (VEP):- They are potentials generated in the brain in response to external stimuli like light. The BCI system uses the VEP recorded from the scalp over visual cortex to determine the direction of eye gaze thus depending on the user’s ability to control gaze direction. They show that the EEG can yield precise information about concurrent motor output, and might prove superior to other methods for assessing gaze direction (Wolpaw et al., 2002).
2. Slow Cortical Potentials: - Among the lowest frequency features (below 1or 2 Hz) of the scalp recorded EEG are slow voltage changes generated in cortex. These potential shifts occur over 0.5–10.0 s and are called slow cortical potentials (SCPs). Negative SCPs are typically associated with movement and other functions involving cortical activation, while positive SCPs are usually associated with reduced cortical activation (Wolpaw et al., 2002).
3. P300 potentials:- Infrequent or particularly significant auditory, visual, or somatosensory stimuli, when interspersed with frequent or routine stimuli, typically evoke in the EEG over parietal cortex a positive peak at about 300 ms .This is called P300 which is a positive peak around 300ms after the target stimulation onset and occurs at the parietal lobe(Wolpaw et al., 2002).
4. N400 potentials:- The N400 is an event-related potential (ERP) component typically elicited by unexpected linguistic stimuli. It is characterized as a negative deflection (topologically distributed over central-parietal sites on the scalp), peaking approximately 400ms (300-500ms) after the presentation of the stimulus.
5. Mu Rhythm and Central Beta Rhythms: - The primary sensory or motor cortical areas often display 8–12 Hz EEG activity in awake people when they are not engaged in processing sensory input or producing motor output. This idling activity, called Rolandic mu rhythm when focused over somatosensory or motor cortex and visual alpha rhythm when focused over visual cortex, is thought to be produced by thalamocortical circuits. These mu rhythms are usually associated with 18–26 Hz beta rhythms. While some beta rhythms are harmonics of mu rhythms, some are separable from them by topography and/or timing, and thus are independent EEG features (Wolpaw et al., 2002).
4 Related Work
A variety of studies over the past 60 years have shown that people with or without motor disabilities can learn to control the amplitude of Mu or Beta rhythms in EEG activity recorded from the scalp over sensorimotor cortex and can use that control to move a cursor on a computer screen in one or two dimensions. Several factors suggest that mu and/or beta rhythms could be good signal features for EEG-based communication .This EEG-based brain–computer interface (BCI) could provide a new augmentative communication technology for those who are totally paralyzed or have other severe motor impairments. Since the mid-1980s, several mu/beta rhythm based BCIs have been developed. (Wolpaw et al., 2000).
4.1 ERS/ERD of Mu and Beta rhythm during Mental Imagery
Unlike the visual alpha rhythm, which is obvious in most normal people, the mu rhythm was until quite recently found only in a minority (Chatrian, 1976). However, computer-based analyses reveal the mu rhythm in most adults (Pfurtscheller, 1989). Such analyses also show that mu-rhythm activity comprises a variety of different 8–12 Hz rhythms, distinguished from each other by location, frequency, and/or relationship to concurrent sensory input or motor output. They are associated with those cortical areas most directly connected to the brain’s normal motor output channels The two mainly used mu rhythms in BCI are lower mu rhythm(8-10 Hz) and upper mu rhythm(10-12 Hz).
Motor imagery or Mental Imagery is described as the mental rehearsal of a motor act without overt movements by muscular activity, is assumed to involve to a large extent the same cortical
areas that are activated during actual motor preparation and execution (Jeannerod, 2001). Similar brain signals, i.e. oscillations in the mu and beta frequency bands, are reactive to both motor imagery (Pfurtscheller et al., 1997) and observation of biological movement. There is evidence from functional magnetic resonance imaging (fMRI) studies that the observation of manual actions, such as grasping a cup and raising it to the mouth, is associated with activation of premotor cortical structures (Buccino et al.,2001).
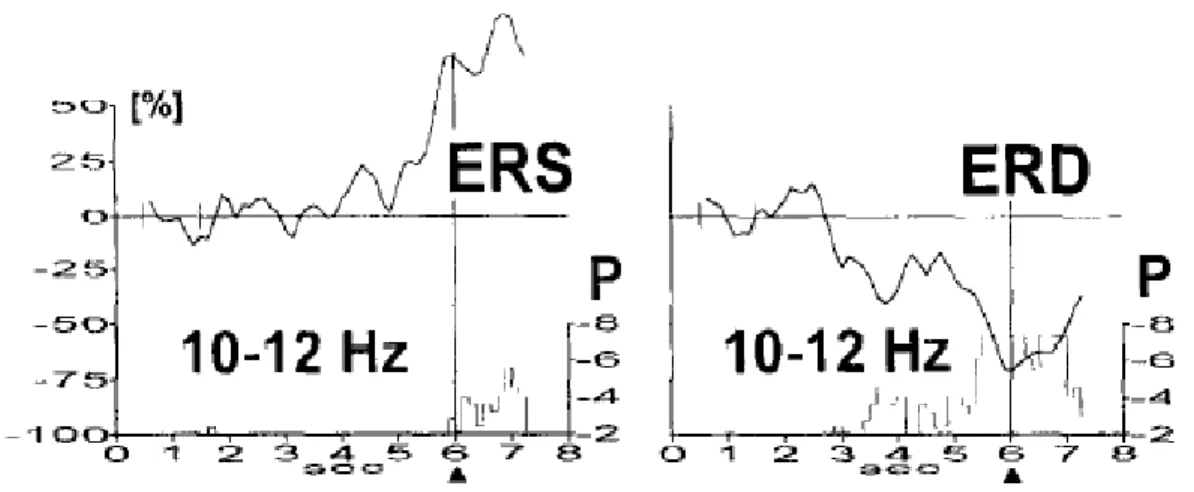
Movement or preparation for movement is typically accompanied by a decrease in mu and beta rhythms, particularly contralateral to the movement. This decrease has been labeled ‘event-related desynchronization’(ERD).Its opposite, rhythm increase, or ‘event-‘event-related synchronization (ERS) occurs after movement and with relaxation. Furthermore, and most relevant for BCI use, ERD and ERS do not require actual movement; they occur also with motor imagery (i.e. imagined movement).Thus, they might support an independent BCI. Rolandic mu and beta rhythms in humans are characteristically recorded over sensorimotor areas with spectral peaks around 10 and 20 Hz Both frequencies show typical reactivity in association with voluntary movements and motor imagery (Pfurtscheller et al., 1999).
Fig 5: ERS and ERD at sensory motor area during movement
This event-related desynchronization (ERD) can be quantified in time and space and displayed in the form of time courses or maps (Pfurtscheller et al., 1977). Mu rhythm ERD within the alpha band (named further l0Hz ERD) can be task specific, circumscribed and localized in task-relevant sensory and motor areas. Experimental data from several sources suggest that l0-Hz ERD can represent an electrophysiological correlate of activated cortical areas related to information processing, selective attention and motor preparation (Pfurtscheller et al., 1992; Van
Winsum et al., 1984). The size and magnitude of ERD reflect the mass of neural networks involved in the performance of a specific task at a special moment of time. For instance, task complexity increases the magnitude of ERD (Van Winsum et al., 1984) and finger movements in elderly subjects are accompanied by a more widespread ERD over motor and premotor areas compared with young subjects (Derambure et al., 1993). Event Related Synchronization can also be quantified in time and space similarly to ERD (actually ERS can be seen as a negative ERD) ,band power decrease relative to a predefined reference interval indicates ERD and a band power increase stands for ERS (Pfurtscheller et al.,1992).
The present view of mu rhythms is that the sensorimotor cortex displays a variety of ‘mu rhythms showing specific topographic and functional properties rather than one uniform rhythm. The hand area mu rhythm is a prominent mu rhythm which can be considered as an intrinsic rhythm of the hand area located on the scalp close to electrodes C3 and C4 (Pfurtscheller et al.,1996). Desynchronization of the hand area mu rhythm during movement was reported in classical studies (Chatrian et al., 1959). On the other hand, the foot area mu rhythm is difficult to detect in EEG recordings because of the anatomical location of the foot area within the mesial wall in the interhemispheric fissure. Hence present day mu rhythm based BCI mainly concentrate detection of mu rhythm ERD and ERS based on imagery of hand movements.
Fig 6: An EEG Based BCI. With the electrode cap placed on the head the user controls the virtual keyboard by thinking about left and right hand movement .
Considering the relationship between central beta and mu rhythms, on the one side the most reactive beta components are very often a first harmonic of the mu rhythm (Huber et al., 1971) but on the other side the localization of the origin of central beta and mu rhythms is slightly different and time courses of recovery after desynchronization are different with a significantly faster recovery of beta rhythms. From this, it can be concluded that central beta rhythms are of somatomotor origin and non-linearly coupled with the mu rhythm generated in somatosensory cortex. During rest or idling both rhythms are synchronized and form the arch-shaped mu rhythm. Preparation and execution of movement results in a blocking of both frequency components. After termination of movement, beta components recover much faster compared to the mu rhythm. (Pfurtscheller et al.,1996).
A short-lasting enhancement (synchronization) of beta frequency components below 30 Hz (named post-movement beta ERS) was reported by Stancak and Pfurtscheller (stancak et al., 1995). In this case, the sensorimotor hand area passes from ‘cortical work’ (also called Cortical activation or ERD) during preparation and execution of finger movement into a state of ‘ cortical nilwork’ or cortical idling( ERS), when no further motor commands are sent to the muscles controlling finger movement and no more afferent stimuli from the cutaneous touch and pressure receptors, reach the somatosensory cortex. Cortical idling can thus denote a cortical area of at least some cm2 which is not processing sensory input or motor output. In this sense occipital alpha rhythms can be considered as idling rhythms of the visual areas and mu rhythms as idling rhythms of sensorimotor areas (Pfurtscheller et al.,1996).
While a localized l0-Hz ERS(mu rhythm) or 20-Hz ERS (central beta rhythm) points to an idling cortical area, synchronized activity around 40 Hz (40-Hz ERS) indicates active involvement of a cortical area in information processing and motor preparation (Llinas et al., 1992). Thus, short bursts of oscillations around 40 Hz can be embedded in a desynchronized alpha band activity (Pfurtscheller et al., 1996).
4.2 Classification of EEG data for BCI
The EEG based BCI research is based on recording and analyzing EEG brain activity and recognizing EEG patterns associated with mental states. Since brain takes charge of each opposite side body, imagining a movement of the right hand is associated with a pattern of EEG activity in the left side of the motor cortex. Normally EEG signals of the right side is used to analyze the movement of the left arm and EEG signals of the left side brain for the right arm(Yeom et al.,2008). Hence mental tasks are carefully chosen so that they activate different parts of the brain, which makes them easier to detect.
Supervised classification methods are employed to learn to recognize these patterns of EEG activities, i.e. to learn the mapping between the EEG data and classes corresponding to mental tasks such as movement of the left hand (Lotte et al. 2007). But this is a difficult learning task because the EEG data is noisy and selecting the optimal frequency band and extracting a good set of features are still open research problems. Also the quality of the data is affected by the different degree of attention of the subject and changes in their concentration.
There are so many techniques for analyzing the EEG signals and extracting useful feature for making the analysis and classification easier. In general, the process of EEG signal analysis and classification consists of three steps: signal preprocessing, feature extraction and classification. The EEG signals recorded from the scalp electrodes are amplified, digitized, preprocessed and then these signals are subjected to one or more of a variety of feature extraction procedures, such as spatial filtering, voltage amplitude measurements, spectral analyses or single-neuron separation. This analysis extracts the signal features that encode the user’s messages or commands. BCIs can use signal features that are in the time domain (e.g. evoked potential amplitudes or the frequency domain (e.g. mu or beta-rhythm amplitudes) or both for improving performance (Wolpaw et al, 2002).
Independent Component analysis (ICA) also called blind signal separation or blind source separation is a mathematical tool that can help solving the problem of separation of sources and reduction of artifacts in EEG( mainly ECG and EOG artifacts). ICA allows blind separation of sources, linearly mixed, assuming only the statistical independence of these sources. It was
verified that the ICA can separate artificial, stimulus-locked, response locked, and non-event related background EEG activities into separate components (Jung, 2001). This suggests the possibility of using ICA to separate different independent brain activities during motor imagery into separate components.
Traditionally, classical linear classifiers such as the Fisher’s linear discriminant have been favored for the classification of extracted features. More recently, a variety of machine learning classifiers have been applied, e.g. neural networks such as multi-layer perceptrons, probabilistic classifiers, lazy learning classifiers such as k-nearest neighbor and state of the art classifiers such as support vector machines.
Present BCI researches all over the world focuses on improving the speed and accuracy of BCI communication by implementing better feature extraction and classification algorithms.
5 Problem Formulation
The aim of this thesis work is to analyse the EEG data of normal ,voluntary and imagination of hand movements thereby studying how EEG activity changes with right and left hand movements by differentiating the event related synchronisation and desynchronisation of Mu and Beta rythms occuring in the sensory motor cortex. This work also aims to determine whether similar changes occur in both imagination and actual hand movements thereby determining whether humans can control machines using their thoughts in EEG based Brain Computer Interface.The development of feature extraction and classification algorithm is not aimed in this thesis work, but the result this thesis target for development of classifiers which will improve the speed and accuracy of EEG based BCIs.
6 Methods and materials 6.1 Subjects
Four healthy subjects, three males (two of them were right handed and one left handed) and one female (right handed) participated in the experiment. All of them were first time EEG users and their age ranges from 18-25.One of the male subject had Myopia and was wearing glasses during
the normal and voluntary finger movement experiments. Subjects were informed about the purpose and procedure before the experiment.
6.2 Experimental Paradigm and EEG Recording
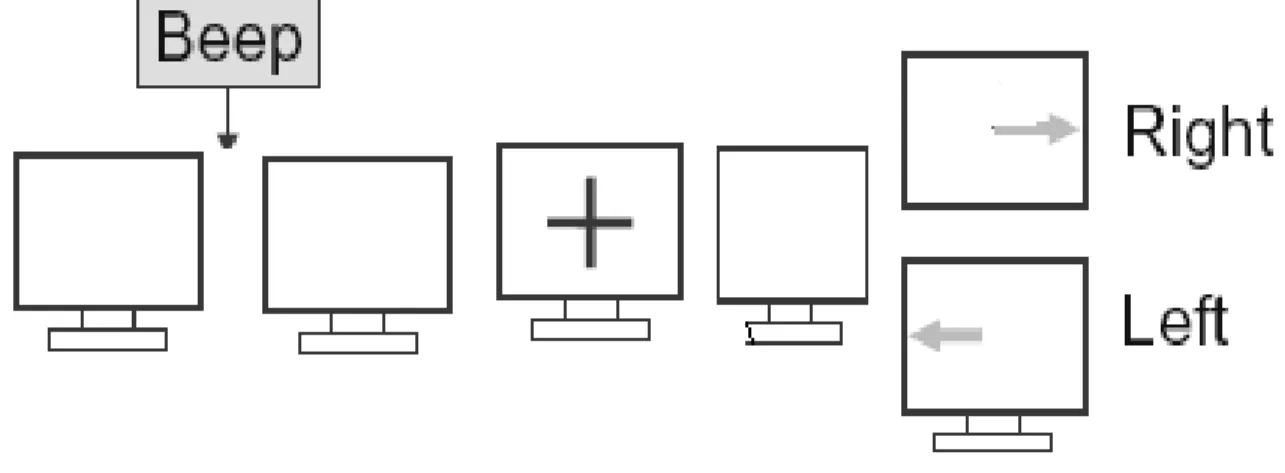
Each subject participated in two sessions. In each session they had to perform three types of task: Imagery (Im), Voluntary (V) and Normal (N). Experiment order is S1N– S1V - S1Im - S2N - S2V - S2Im. During the experiment, the subject sat in a comfortable armchair and fixated a computer monitor in front of him. In the ‘Imagery’ experiment each trail started with the presentation of a blank screen for 2000 ms followed by a short warning tone (‘beep’). At 3000ms, a fixation cross is presented at the centre of the monitor followed by a blank screen for 500ms.At 4000ms an arrow is presented at the centre of the monitor for 1000ms, pointing either to the left or to the right. Depending on the direction of the arrow, the subject was instructed to imagine pressing a key with his right or left hand finger. The timings and procedure for ‘Normal’ experiment was same but instead of imagination of pressing a key, the subject actually pressed the key with his right or left hand finger according to the direction of the arrow presented on the monitor. In the ‘voluntary’ experiment the subject pressed the key without the direction of pointer arrow. Thus total time for one epoch of the experiment is 5.5 seconds for Normal and Imagery and 4.5 seconds for Voluntary experiment.
Experiment procedure: Blank Screen – Beep – Blank Screen – Cross –Blank Screen - Arrow Timings: 2000ms – 500ms – 500ms – 1000ms – 500ms - 1000 ms.
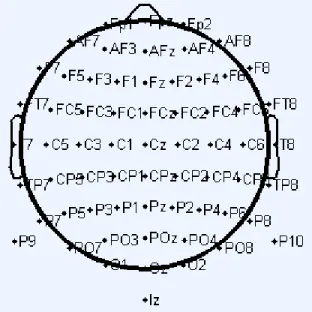
EEG signals were recorded in the Biosemi format at a sampling rate of 2048 Hz from a grid of 64 Ag/AgCl scalp electrodes which were placed on the scalp according to the international 10-20 lead system.
Fig 8: Electrode positions
6. 3 Preprocessing of EEG Data
The existing investigations about EEG signals have shown that the noises in the EEG signal can be eliminated by preprocessing thereby improving the performance EEG analysis. In this thesis work ,an open source tool box called EEGLAB provided by SCCN lab, running under the cross platform MATLAB environment(The Mathworks,Inc.) is used for both preprocessing and analysis of the EEG data.
The favoring features of EEGLAB for using in this thesis work is that it can be used for processing collections of single-trial and/or averaged EEG data of any number of channels and the available functions in the EEGLAB include EEG data, channel and event information importing, data visualization (scrolling, scalp map and dipole model plotting, multi-trial ERP-image plots), preprocessing (including artifact rejection, filtering, epoch selection, and averaging), independent component analysis and time/frequency decompositions including channel and component cross-coherence supported by bootstrap statistical methods based on data resampling(Delorme et al.,2004).
The EEGLAB functions are organized into three layers: Top-layer functions allow users to interact with the data through the graphic interface without needing to use MATLAB syntax. Menu options allow users to tune the behavior of EEGLAB to available memory. Middle-layer functions allow users to customize data processing using command history and interactive ‘pop’ functions. Experienced MATLAB users can use EEGLAB data structures and stand-alone signal processing functions to write custom and/or batch analysis scripts (Delorme et al.,2004). So at the beginning of this thesis work the data analysis was done using EEGLAB GUI, but later on batch scripts were used.
All the standard data analysis functions available in EEGLAB which includes data filtering, data epoch extraction, baseline removal, data resampling and extraction of data epochs time locked to specified experimental events from continuous data were used in this thesis work for the preprocessing of the collected EEG data.
The EEG data was at first referenced to Cz electrode while importing the EEG data files which were in biosemi format(.bdf files) in to the EEGLAB. Then the channel locations were imported for getting information about the recording electrodes which is necessary for plotting EEG scalp maps or to estimate source locations for data components.The data was then downsampled from 2048 Hz to 256 Hz to save memory and disk storage. The resampled data was then highpass filtered with lower cut-off frequency 0.1Hz and there after lowpass filtered with cutoff frequency 50Hz.This bandpass filtering of continuous EEG data using linear FIR filter eliminated the powerline noise, EMG and EOG artefacts.To study the event related EEG dynamics of continuously recorded data,the data epochs time locked to events of interest were extracted from the filtered data followed by the removal of meaningless epoch baseline offsets.Epochs of four events: Left button press(labelled as event 1), Right button press (event 2), Right arrow (event 11), Left arrow (event 12), were extracted for EEG data of ’Normal’ experiment, Left button press (labelled as event 1), Right button press (event 2) for ’Voluntary’ and Right arrow(event 11), Left arrow(event 12) for ’Imagery’ data. Each epoch was 3 sec length ,one second before the event to two second after the event.
After this preprocessing of EEG data, each epoch file was studied by plotting channel spectra, maps, various Event Related Potential (ERP) plots like channel ERP with scalp maps, two and
three dimensional ERP map series, comparing ERP averages, channel ERP images, time frequency plots ,ICA, diploe localisation and component clustering.
7 Analysis of EEG Signals
Since the event-related synchronization and desynchronization (ERS/ERD) can be quantified in time and space and can be displayed in the form of time courses or maps, the EEG data can be analyzed by the following ways:
7.1 Power Spectrum Analysis
Spectral plot shows a colored trace that represents the spectrum of the activity of one data channel (Yeom et al., 2008). It is a way to present the magnitude of signals at measurement points with colors. EEGLAB also shows the power spectrum on the brain model at chosen frequency. Therefore, it is easy to know the activated parts on the brain during the event. In this work, power spectrum at 4, 8, 10, 12, 14, 20, 22 and 40 Hz of epoched data was plotted to study the scalp distribution of power at these frequencies.
7.2 Event Related Potential (ERP) plots
Since ERP averaging leads to a reduction in event‐unrelated EEG activity, the field of electro-physiological data analysis has been dominated by analysis of one-dimensional averaged event-related potential time series. ERP-image is a more general two dimensional representation of the data sorted in order of some relevant measure (e.g., collection time, subject reaction time) (Delorme et al., 2004). So in this thesis work, analysis of epoched data was mainly done using ERP images. ERP averages were used to compare the event related potentials of two channels for the same event.
7.2.1 Channel ERP Image plots
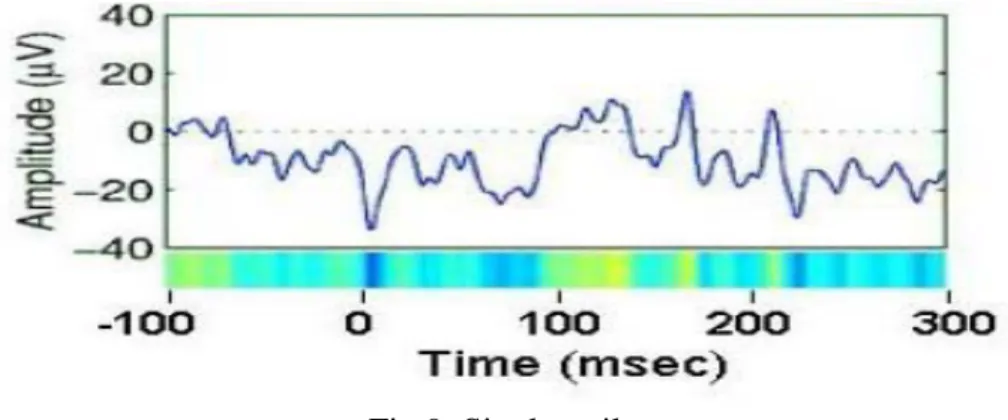
Data averaging collapses the dynamic information in the data, ignoring inter-trial differences which are large and may be crucial for understanding how the brain operates in real time. In order to better understand the causes of observed ERP effects, ERP image is plotted which gives trial by trail views of a set of data epochs. An ERP image is a colored rectangular image in which
each horizontal line represents a potential time series during a single experimental trial. (Delorme et al., 2004)
Fig 9: Single trail
Instead of plotting activity in single trials as left-to-right traces in which potential is encoded by the ordinate of a data trace, trials are represented as horizontal lines whose changing color values indicate the potential at each time point in the trial. Trials may be plotted in any sorting order of interest, and a moving average across adjacent single trials may be used to highlight trial-to-trial consistency (Delorme et al., 2004). By stacking above each other the color-sequence lines for all trails in a dataset an ERP image is formed.
7.2.2 ERP Comparisons
Comparing the ERPs in two conditions or events makes the EEG data analysis more meaningful since the aim of this thesis is to differentiate the EEG activity during right hand and left hand movements, so comparing the ERP averages of electrodes C3 and C4 will provide the exact information about the event related changes occurring in brain during each hand movement. This function can also be used to compute and plot grand-mean ERP differences between conditions across several subjects, and can assess significant differences between two conditions using a paired t-test (two-tailed).
7.3 Time frequency Analysis
The neural processes that generate EEG are intrinsically dynamic. There are transient changes in the power or peak frequency of EEG waves which can provide information of primary
interest. The non stationary nature of the EEG signals makes it necessary to use methods which are able to quantify their spectral content as a function of time. Time-frequency Analysis is a well suited tool for the study of spontaneous and induced changes in the oscillatory states (Delorme et al., 2004).
To assess event-related spectral amplitude, phase and coherence perturbations in data the two spectral decomposition techniques used in this work are:
(1) Event-related spectral perturbation (ERSP), which measures the mean event-related changes in the power spectrum at a data channel or component. They generalize the narrow-band event-related desynchronization and synchronization (Delorme et al., 2004). Calculating an ERSP requires computing the power spectrum over a sliding latency window then averaging across data trials. The color at each image pixel then indicates power (in dB) at a given frequency and latency relative to the time locking event. Typically, for n trials, if, Fk(f,t) is the spectral estimate of trial k at frequency f and time t, then ERSP is given by
To compute Fk(f, t), EEGLAB uses either the short-time Fourier transform, a sinusoidal wavelet (short-time DFT) transform, or a Slepian multitaper decomposition that provides a specified time and frequency resolution (Delorme et al., 2004).
(2) Inter-trial coherence (ITC magnitude and phase) at single channels or components. ITC is a frequency domain measure of the partial or exact synchronization of activity at a particular latency and frequency to a set of experimental events to which EEG data trials are time locked. The term ‘inter-trial coherence’ refers to the related phase coherence (ITPC) or event-related linear coherence (ITLC) between recorded EEG activity and an event-phase indicator function (e.g. a Dirac or cosine function centered on the time locking event) (Delorme et al., 2004). ITPC and ITLC are defined by
7.4 Independent Component Analysis
ICA algorithms have proven capable of isolating both artifactual and neurally generated EEG whose EEG contributions, across the training data, are maximally independent of one another. ICA is widely used in the EEG research community to detect and remove eye, muscle, and line noise artifacts and also to separate biologically plausible brain sources whose activity patterns are distinctly linked to behavioral phenomena. EEGLAB contains an automated version of the infomax ICA algorithm with several enhancements. ICA finds a coordinate frame in which the data projections have minimal temporal overlap. The core mathematical concept of ICA is to minimize the mutual information among the data projections or maximize their joint entropy (Delorme et al., 2004).
ICA applied to a matrix of EEG scalp data finds an ‘unmixing’ matrix of weights (W) that, when multiplied by the (channels by time points) Scalp data matrix, gives a matrix of independent component (IC) activities or activations (lower right). This is the process of ICA decomposition of the data into maximally temporally independent processes, each with its distinct time series and scalp map. The process of back projection recaptures the original scalp data by multiplying the IC activations matrix (lower right) by the matrix of independent component (IC) scalp maps (lower center) whose columns give the relative projection weights from each component to each scalp channel(Makeig et al.,)
7.5 Component Clustering
Clustering functions are used to assess the consistency of ICA decompositions across subjects and conditions, and to evaluate the separate contributions of identified clusters of these data components to the recorded EEG dynamics. In EEGLAB there is a data structure called the ‘STUDY’ which contains a set of epoched EEG datasets from one or more subjects, in one or more groups, recorded in one or more sessions, in one or more task conditions and additional information. The dataset information contained in a STUDY structure allows straightforward statistical comparisons of component activities and/or source models for a variety of experimental designs (Delorme et al., 2006).The 7 steps in the independent component clustering process are:
1. Identify a set of epoched EEG datasets containing ICA weights to form the STUDY set.
2. Specify the subject code and group, task condition, and session for each dataset.
3. Identify the components in each dataset to cluster.
4. Specify and compute measures (ERPS, scalp maps, ERSPs, ITCs, dipole locations) to use
in the clustering.
5. Perform component clustering using these measures.
6. View the scalp maps, dipole models, and activity measures of the component clusters.
There are two types of clustering available in the EEGLAB ‘kmeans’ clustering and 'neural network' clustering. The kmeans algorithm can relegate 'outlier' components to a separate cluster. Outlier components are defined as components further than a specified number of standard deviations (3, by default) from any of the cluster centroids (Delorme et al., 2006).
7.6 Dipole localization
To visualize the macroscopic brain dynamics, i.e. the brain source distributions that, contributes to the scalp data. The idea of dipole localization is to find some number of equivalent current dipoles whose summed projections to the scalp most nearly resemble the observed scalp distribution. An approach to localize dipoles is Independent Component Analysis. ICA identifies temporally independent signal sources in multi-channel EEG data as well as their pattern of projection to the scalp surface. These 'component maps' have been shown to be significantly more dipolar (or "dipole-like") than either the raw EEG or any average ERP at nearly any time point even though neither the locations of the electrodes nor the biophysics of volume propagation are taken into account by ICA (Delorme et al.,2006 ).
EEGLAB has two plug-ins for localizing equivalent dipole locations of independent component scalp maps: the DIPFIT plug and a BESAFIT .In this thesis work, DIPFIT plug-in is used for dipole localization. To fit dipole models to ICA components in the dataset, ICA decompositions were performed and then selected the components to be fitted.
8 Results
ERD/ERS results for EEG data of Mental Imagery 8.1 Power Spectral Plots
Fig 11: Scalp distribution of power during left hand imagery
8.2 Channel ERP Image plots
8.3 Comparison of channel ERPs
Fig 15: Comparison of ERP averages of right and left imagery at electrodes positions C1, C2, C3, C4, C5, C6
(Blue trace represents the average ERP of right hand imagery and red line represents the average ERP of left hand imagery)
8.4 Time frequency Plots 8.4.1. ERSP plots
8.4.2 Time frequency decompositions on all electrodes
Fig 18: Time frequency decomposition on all electrodes during right hand imagery
8.5 Independent Component Clustering
A study set with 8 epoched data files of imagery data of 4 subjects (4 right hand imagery epoched file and 4 left hand imagery files was made .Then independent component analysis of this study set was done on this study set followed by preclustering. In preclustering, computation of ERSP, ITC, component spectra and ERP was done which are the four measures used to cluster the components. This preclustered study set was then subjected to both kmeans clustering and neural network clustering. Both clustering methods classified the independent components in to two clusters. After the clustering, the outliers were removed from each cluster. Then various plots(ERP,ERSP,ITC and spectral plot) of this clusters were studied to assess the consistency of ICA decompositions across subjects and conditions and to evaluate the separate contributions of identified clusters of these data components to the recorded EEG dynamics.
8.5.1. Kmeans clustering Results
Fig 21: Mean properties of cluster 2
Fig 23: ERSP plot of cluster 1
8.5.1 Neural network clustering Results
Fig 25: Mean properties of cluster 1
Fig 27: ERSP plot of cluster 1
8.6 Dipole localization
Fig 29: Top view, Saggital view, Coronal view of dipole source localization of left hand imagery
9 Analysis of Results
From the spectral plot results shown above, it can be seen that the spectral plot of left hand imagery shows a decrease in the spectral power near the C4 electrode position(right side sensori motor area which is responsible for the left hand movement) at 8-10Hz and that of right hand imagery shows a decrease in spectral power near the C3 electrode position(left side sensory motor area which is responsible for the right hand movement) at 12Hz and 22Hz.This proves the desynchronization of mu rhythm(8-12 Hz) and central beta rhythm(18-26 Hz) at sensory motor cortex at respective hand areas during the imagination of hand movements.
The channel ERP image shows a decrease in the event related potentials (blue color) on the left side of the sensorimotor area and an increase in event related potentials on the right side (red color) during the right hand imagery. Also the channel ERP image of left hand imagery shows a decrease in the event related potentials on the right side of the sensorimotor area and an increase in event related potentials on the left side which indicates the desynchronization of the sensorimotor rhythms during imagination of hand movements. The comparison of the channel ERPs strengthens the result obtained from ERP image.
The ERSP plot of C4 electrode of right hand imagery shows a decrease in the spectral power around 500ms after the onset of event related potential around 10-12 Hz and the ERSP plot of C3 electrode of right hand imagery shows a decrease in the spectral power around 500ms after the onset of event related potential around 10-12 Hz which shows the desynchronization of mu rhythms in the respective hand areas for hand motor imagery. Time frequency decomposition of all electrodes strengthens the result of ERSP plots.
The results of Independent component clustering also show the desynchronization of sensorimotor rhythms. The ERSP plots of the two clusters shows a decrease in spectral power at 8-12Hz and 20-20 Hz around 500ms-1000ms for both right hand and left hand imagery and the ITC plot strengthens this result. The ERP average plot of right hand and left hand imagery also shows a decrease in potential around 500ms after the onset of the event.Both kmeans clustering and neural network clustering gave similar results for right hand and left hand imagery. The difference was in the number of independent components in the clusters. After the
dimensionality reduction, there were 252 independent components (ICs) for the clustering. Both methods classified these ICs in to two clusters. In kmeans clustering, cluster 1 contained 4 ICs and cluster 2 contained 230 ICs whereas in neural network clustering, cluster 1 contained 157 ICs and cluster 2 contained 95 ICs.
The dipole localization results shows that the sources (independent components) of EEG scalp distribution activity during imagination of hand movements are mainly from sensory motor cortex area thereby validating all the above mentioned plot results.
Since this thesis work mainly aims for analyzing imagery data, only the result of imagery data analysis is shown here. The analysis of the normal and voluntary experiment data are showing the similar result.
10 Future work
It is necessary that there should be some computing statistics applied to the observation of group, session or condition measure differences in order to estimate the reliability of these differences across conditions or groups. So the future work is to perform classical parametric tests like paired t test, unpaired t test, Analysis of variance (ANOVA) on ERPs, power spectra, ERSPs, and ITCs measured from the epoched imagery data.
11 Conclusion
Event related Desynchronization can be interpreted as an electrophysiological correlate of activated cortical areas involved in processing of sensory or cognitive information or production of motor behavior (Pfurtscheller etal., 1996).In this thesis work, EEG signals recorded during imagination of hand movements were analyzed using EEGLAB, an open source toolbox running under MATLAB. The result of this analysis proved that an imagination of right hand movement will desynchronize the mu rhythm and central beta rhythms in the sensory motor hand area of left side brain (since brain takes charge of opposite side of the body) and an imagination of left hand movement will desynchronize the mu rhythm (8-12 Hz) and central beta rhythms (16-26 Hz) in the sensory motor hand area of right side brain.
The neuromuscular channels can be disrupted by many different disorders through which the brain communicates with and controls its external environment. Amyotrophic lateral sclerosis (ALS), brainstem stroke, brain or spinal cord injury, cerebral palsy, muscular dystrophies, multiple sclerosis, and numerous other diseases impair the neural pathways that control muscles or impair the muscles themselves. Those most severely affected may lose all voluntary muscle control, including eye movements and respiration, and may be completely locked in to their bodies, unable to communicate in any way to the outside world (Wolpaw et al.,2002). Brain-Computer Interface has become a great help to such severely motor-disabled persons to communicate and control their environment using their thoughts. The present work has proved that without the need of actual hand movements, changes in brain activity in the sensory motor area can be made by humans just by the thinking of such movements. There is also need of mental practice in order to control the sensory motor rhythms. The present results are of practical interest for a classifier development for a Brain Computer Interface which will provide more accuracy in classification of brain signals which in turn will improve the performance of a BCI.
12 References
[1] Bhardwaj,M., Nadir,A.K., Analyzing Electroencephalogram Signal using EEG lab
[2] Buccino,G., Binkofski,F., Fink,G.R., Fadiga.L.,(2001),Action observation activates premotor and parietal areas in a somatotopic manner: an fMRI study, European Journal of Neuroscience, Vol 13, pp 400–404.
[3] Chatrian,G.E.,(1976),The mu rhythm the EEG of the waking adult, Handbook of electro-encephalography and clinical neurophysiology, Elsevier, Amsterdam, pp. 46–69.
[4] Delorme,A.,Makeig,S.,(2004),EEGLAB: an open source toolbox for analysis of single-trial EEG dynamics including independent component analysis, Journal of Neuroscience Methods, Vol 134 ,pp 9-21
[5] Delorme,A., Fernsler,T.,Serby,H.,Makeig,S.,(2006), EEGLAB Tutorial, University of San Diego California
[6] Derambure,P.,Defebvre, L.,Dujardin,K.,(1993) ,Effect of aging on the spatio-temporal pattern of event-related desynchronization during a voluntary movement. Journal of Clinical Neurophysiolology, Vol 89, pp 197-203.
[7] Gulli, Farad,L.,(2003),Gale Encyclopedia of Mental Disorders, Gale Group Inc., Michigan.
[8] Guyton,A.C.,Hall J.E,(2005), Textbook Of Medical Physiology, Elsevier Inc., Philadelphia.
[9] Huber,P.J.,Kleiner,B,.Gasser,T.,(1971),Statistical methods for investigating phase relations in stationary stochastic processes,IEEE Transactions on Audio Electroacoustics, vol 19,pp 78-86.
[10] Jeannerod M.,(2001),Neural simulation of action: a unifying mechanism for motor cognition, Neuroimage,Vol 14,pp 103–109.
[11] Jung,T.,(2001),Analysis and visualization of single-trial event-related potentials, Human Brain Mapping, Vol 14,pp 166-185.
[12] Linas,R.R., Ribary,U.,(1992),A global characteristic of the 40 Hz response during sensory input, Induced Rhythms in the Brain, Birkhiauser, Berlin, pp. 147-154.
[13] Lotte,F., Congedo,M., Lecuyer,A.,(2007),A review of classification algorithms for EEG-based brain-computer interfaces, Journal of Neural Engineering, Vol 4,pp R1-R13.
[14] Makeig,S., Onton,J.,ERP Features and EEG Dynamics: An ICA Perspective.
[15] Pfurtscheller,G., Aranibar,A.,(1977),Event-related cortical desynchronization detected by power measurements of scalp EEG, Journal of Clinical Neurophysiology., Vol 42, pp 817-826.
[16] Pfurtscheller,G., (1989),Functional topography during sensorimotor activation studied with event-related desynchronization mapping, Journal of Clinical Neurophysiology, Vol.6,pp 75–84.
[17] Pfuttscheller,G., Klimesch,W.,(1992),Functional topography during a visuo verbal Judge-ment task studied with event-related desynchronization mapping, Journal of Clinical Neuro-physiology, Vol 9,pp 120- 131.
[18] Pfurtscheller,G., Neuper,C.,(1996),Event-related synchronization(ERS) in the alpha band : an electrophysiological correlate of cortical idling: A review,International Journal of Psycho-physiology, Vol 24,pp 39-46.
[19] Pfurtscheller,G., Neuper,C.,(1997),Motor imagery activates primary sensorimotor area in humans, Neuroscience Letters, Vol.239,pp 65–68.
[20] Pfurtscheller,G.,Lopes da Silva,F.H.,(1999),Event-related EEG/MEG synchronization and de -synchronization: basic principles , Journal of Clinical Neurophysiolology,Vol.110, pp1842– 1857.
[21] Pfurtscheller,G.,Neuper,C.,Guger,C.,(2000),Current Trends in Graz Brain-Computer Inter- face Research, IEEE Transactions on Rehabilitation Engineering,Vol.8,pp 216-219
[22] Stancak,Jr.,Pfurtscheller,G.,(1995),Desynchronizationand recovery of beta rhythms during brisk and slow self-paced finger movements in man, Neuroscience Letters, Vol 196, pp 21-25.
[23] Van Winsum W., Sergeant, J., Geuze, R., (1984), The functional significance of event-related desynchronization of alpha rhythm in attentional and activating tasks, Journal of Clinical Neurophysiolology, Vol 48,pp 519-524.
[24] Wolpaw,J.R., Birbaumer,N., Pfurtscheller,G.,McFarland,D.J.,(2002),Brain-Computer Inter-faces for communication and control,Journal of Clinical Neurophysiology,Vol.113,pp 529–538.
[25] Wolpaw J.R, McFarland D.J, Vaughan T.M, (2000), Brain–computer interface research at the Wadsworth Center. IEEE Transactions on Rehabilitation Engineering, Vol.8, pp 222–225.
[26] Yeom,H.G., Sim,K.B.,(2008)ERS and ERD Analysis during The Imaginary Movement of Arms,International Conference on Control, Automation and Systems 2008,Oct. 14-17.
Appendix A
EEGLAB Tutorial: Analysis of EEG data using EEGLAB
There are 8 key steps to be performed before starting the analysis of EEG data using EEGLAB. which includes preprocessing , extracting epochs and ICA decomposition(Delorme et al.,2004)
Key step1: Start Matlab.
Keystep2: start EEGLAB by typing ‘eeglab’ at the Matlab command line and hit enter.
Key step 3: Importing the data (in this work Biosemi format data ,.bdf files) in to the EEGLAB
Since biosemi data is recorded without any reference, a reference channel should be mentioned while importing it in to the EEGLAB. Usually the Cz(channel no.48) is given as reference.
Key step 4: Load the channel locations by selecting Edit> channel locations. Since data is in Biosemi format the channel labels will be present in the dataset.so just click OK in the next pop-up window.
After loading the channel locations , down sampling of the EEG data may be done in order to save memory and disk storage.
Key step 5: Remove linear trends.
EEG data is filtered using both high pass and low pass filters for removing linear trends.Select Tools> Filter the data>Basic FIR filter and then enter the cut off frequency.If high-pass and low-pass cutoff frequencies are BOTH selected, the filtering routine may not work. So first apply the low-pass filter and then, in a second call, the high-pass filter (or vice versa).
Key step 6: Extracting epochs
In order to study the event-related EEG dynamics of continuously recorded data , the data epochs time locked to events of interest should be extracted .To extract epochs, select Tools>Extract epochs. Then select the event to be extracted and the length of the epoch to be extracted.
Key step 7: Remove baseline values
Removing a mean baseline value from each epoch is useful when baseline differences between data epochs (e.g., those arising from low frequency drifts or artifacts) are present. These are not meaning fully interpretable, but if left in the data could skew the data analysis. After the data has been epoched, a window will pop up automatically asking for baseline removal. Also base line can be removed by selecting select Tools>Remove baseline.
Key step 8: Calculate ICA Components
To compute ICA components of a dataset of EEG epochs (or of a continuous EEGLAB dataset), select Tools > Run ICA. This calls the function pop_runica(),an automated version of the infomax ICE algorithm.
Appendix B
Creating a STUDY structures and study set
EEGLAB has a data structure called STUDY which is used to manage and process data recorded from multiple subjects, sessions, and/or conditions of an experimental study. EEGLAB uses study sets for performing statistical comparisons, for automated serial computation, and for clustering of independent signal components across subjects and sessions(Delorme et al.,2004).
To create a study set, select menu item File > Create study > Browse for datasets.Enter all datasets for all subjects in the STUDY, so that the STUDY creation gui looks like this:
Appendix C
EEGLAB Matlab Script used in this thesis work
Writing EEGLAB Matlab scripts simply involves calling Matlab functions from a script file or from the command line instead of calling them interactively from the EEGLAB GUI. EEGLAB's history mechanism keeps track of all operations performed on datasets from the EEGLAB graphic interface and eases the transition from menu-based to script-based computing. It allows the user to perform exploratory signal processing on a sample dataset, then use the accumulated commands issued from the EEGLAB window in a script file, which can then be modified using any text editor. Writing Matlab scripts to perform EEGLAB analyses allows the user to largely automate the processing of one or more datasets.
Because advanced analyses may involve many parameter choices and require fairly lengthy computations, it is often more convenient to write a custom script. Hence at the beginning of this thesis work , the EEG data processing was done by calling functions from EEGLAB GUI, but later on EEG script file was used to process the EEG data .A script file which was used to plot the time frequency decomposition of all electrodes is shown below.
clear all
close all
clc eeglab;
% load bdf eeg data and reference to channel 48 -> Cz
Ns=5;Nc=2; for m=1:Ns for s=1:Nc
setname = ['D:\EEG Data\Imaginary\S' int2str(m) 'Im' int2str(s) '.bdf']; EEG = pop_biosig(setname,'ref',48);
[ALLEEG EEG CURRENTSET ] = eeg_store(ALLEEG, EEG);
EEG=pop_chanedit(EEG, 'lookup',
'E:\\MATLAB2008b\\eeglab2008October01_beta\\plugins\\dipfit2.2\\standard_BESA\\standard-10-5-cap385.elp', 'plotrad',1);
% resampling
EEG = pop_resample( EEG, 128);
% filter
EEG = pop_eegfilt( EEG, 1, 0, [], [0]); EEG = pop_eegfilt( EEG, 0, 50, [], [0]);
% re-reference
EEG = pop_reref( EEG, [], 'refstate',0);
% EXTRACT EPOCHES
EEG = pop_epoch( EEG, { '11' }, [-1 2], 'newname', 'Continuous EEG Data Epochs,11',
'epochinfo', 'yes');
% Base line Removal
EEG = pop_rmbase( EEG, [-1000 0]);
[ALLEEG EEG] = eeg_store(ALLEEG, EEG, CURRENTSET);
% Compute a time-frequency decomposition for every electrode
for elec = 1:EEG.nbchan
[ersp,itc,powbase,times,freqs,erspboot,itcboot] = pop_timef(EEG, ...
1, elec, [EEG.xmin EEG.xmax]*1000, [3 0.5], 'maxfreq', 50, 'padratio', 16,'plotphase', 'off',
'timesout', 60, 'alpha', .05, 'plotersp','off', 'plotitc','off');
if elec == 1 % create empty arrays if first electrode
allersp = zeros([ size(ersp) EEG.nbchan]); allitc = zeros([ size(itc) EEG.nbchan]);
allpowbase = zeros([ size(powbase) EEG.nbchan]); alltimes = zeros([ size(times) EEG.nbchan]); allfreqs = zeros([ size(freqs) EEG.nbchan]);
allerspboot = zeros([ size(erspboot) EEG.nbchan]); allitcboot = zeros([ size(itcboot) EEG.nbchan]); end;
allersp (:,:,elec) = ersp; allitc (:,:,elec) = itc;
allpowbase (:,:,elec) = powbase; alltimes (:,:,elec) = times; allfreqs (:,:,elec) = freqs;
allerspboot (:,:,elec) = erspboot; allitcboot (:,:,elec) = itcboot; end;
% Plot a tftopo() figure summarizing all the time/frequency transforms
figure;
tftopo(allersp,alltimes(:,:,1),allfreqs(:,:,1),'mode','ave','limits', ...
[nan nan nan 35 -1.5 1.5],'signifs', allerspboot, 'sigthresh', [6], 'timefreqs', ... [400 8; 350 14; 500 24; 1050 11], 'chanlocs', EEG.chanlocs); end end eeglab redraw;