VTI meddelande
Nr 689A - 1992
Driver Attitudes and Behavioural Changes related to Presentation of Roadside
Information inside the Car A pilot study of the CAROSI system
Lena Nilsson and Maria Berlin
RDS
Vaq-och
VTI meddelande
Nr 689A - 1992
Driver Attitudes and Behavioural Changes related to Presentation of Roadside
Information inside the Car A pilot study of the CAROSI system
Lena Nilsson and Maria Berlin
as
v
Publisher: Publication:
-vTI MEDDELANDE 689A
Published: Project code: 1992 57323-8
SwedishRoadand Project
M TrafficResearchInstitute PROMETHEUS
Swedish Road and Traffic Research Institute e $-581 01 LinkGping Sweden
Author: Sponsor:
Lena Nilsson and Maria Berlin Saab, Volvo and Swedish Road and Traffic Research Institute (within the Swedish PROMETHEUS S/IT4 Programme)
Title:
Driver Attitudes and Behavioural Changes related to Presentation of Roadside Information inside the Car - A pilot study of the CAROSI system
Abstract (background,aims, methods, results) max 200 words:
Effects on driver behaviour of the RTI system CAROSI, providing roadside information on a display inside the car, were studied in a field test. Drivers' opinions about different system aspects were also obtained. Nine subjects between 22 and 59 years, relatively experienced as drivers, participated in the study. Each subject drove a test route in Gothenburg, both in a CAROSI equipped car, and in a conventionally equipped car. Generally, the subjects' attitudes to CAROSI were positive, because the system seems to fulfil a need without bringing too much of disturbance. The subjects found the presented information easy to detect and recognize, even if problems could occur due to low visibility in heavy sunshine. The majority also believed that traffic safety, for instance in terms of their own tendency to follow posted speed limits, could be positively influenced by the introduction of a CAROSI-type system. At the same time the subjects denied that CAROSI had influenced their speed choice during the experiment. They also expressed some safety related worries, as they experienced that they, compared to the conventional dashboard, looked at the CAROSI dashboard more often and for longer periods.
This experience was confirmed by a recorded increase in the number of fixations to the CAROSI dashboard (on the average 204 during a test route lap), compared to the (on the average 93) fixations to the conventional dashboard. No speed level differences could be detected, and subjects obeyed the posted speed limits very closely. Subjects' knowledge about passed road signs revealed that the information presented via CAROSI was read and interpreted. To conclude, the possibilities for a CAROSI-type system to be accepted and used by drivers seem to be good. However, CAROSI seems to have an impact on drivers' visual behaviour that can influence traffic safety negatively. Suggestions that can improve the situation were discussed.
Keywords:
FOREWORD
The authors are indebted to a number of colleagues at Volvo and VTI, who have assisted us in the planning, performing, and analyzing phases of this study. We are particularly grateful to Hakan Alm for valuable discussions, comments, and suggestions, and to Mats Rosenquist for his assistance with practical matters during the experiments in Gothenburg. Christina Ruthger has corrected the English language.
The study was part of the Swedish PROMETHEUS S/IT4 Programme and financially supported by Saab, Volvo and VTI.
ABBREVIATIONS CAROSI MMI RDS LCD PROMETHEUS SD RTI HUD S/IT4
VTI MEDDELANDE 689A
Car Roadside Signalling
Man Machine Interaction
Radio Data System
Liquid Crystal Display
PROgraM for European Traffic with Highest Efficiency and Unprecedented Safety (Euro-pean car manufacturers research program)
Standard Deviation
Road Transport Informatics
Head Up Display
Swedish research project in the area Infor-mation Technology
CONTENTS UQ lea ] Db b Db iD ib i} U1 & Q DJ t-Un on on on on on Un on on on J Un Bb Q ND DD DD DD -C o a oa oa oa BD B Q D |H Oo. Ja Q NJ t-OV, Un BACKGROUND CAROSI PURPOSE METHOD Subjects Test route Design Procedure Measures RESULTS
Questions before test Questions after test MMI design
Behavioural effects related to traffic safety General aspect
Answers to direct questions during driving Glances at the dashboard
Speed observations Time on the task
DISCUSSION
Drivers' need for roadside information Acceptance of the CAROSI system
Design of the CAROSI system
Safety related effects of the CAROSI system Subjective judgments of traffic safety related behaviour
Observed traffic safety related behavioural effect
The knowledge effect of the CAROSI system Future research
CONCLUSIONS AND SUGGESTIONS
REFERENCES
VTI MEDDELANDE 689A
23 2 4 29 26 27 29
1 BACKGROUND
A considerable part of the driving task is information process-ing. The carriers of information that appear in the traffic system can be of different types. Some examples are: moving road users, which drivers have to interact with, various types of obstacles, and also static road signs along the roads. To solve the driving task, drivers have to perform the information processing successfully. The first and very important step in this process is to detect and identify relevant information in the traffic environment. To achieve this, drivers probably have some ideas about what is important information. Based on these ideas they select what to look for, and where and when to look for it, to get the information needed to perform the driving task. Then drivers use the gained information to make more or less correct decisions, and finally they perform appropriate manoeuvres.
Today, the number of information carriers in the traffic system (for instance static road signs) tends to increase. The amount of available information thus increases at the same time as the time intervals available for information processing tend to decrease, due to increasing speed levels. The high load some-times imposed on drivers from information processing, can lead to divided attention and high levels of stress. Therefore, it is not strange that drivers experience difficulties in coping with the information processing task, not least with detection and identification of information (Treat 1980, Planek 1989). The difficulties can be exemplified by drivers' own explanations of their errors. They often explain them by "I didn't see the car, the prohibition sign, the red light" etc. Driver errors of the type "looked but didn't see", and due to inattention have also been reported to increase the risk of road accidents (Treat 1980, Alm 1989, Nilsson 1989) .
Presently, large research and development efforts are made to use modern information technology to support drivers in their
information processing task. CAROSI is a prototype system that shows information, warnings and prohibitions inside the car, which so far have been presented on road signs along the road. The road sign icons appear on a display in the car at the time they are passed, and stay there as long as their messages are valid. Contrary to the conventional system, with road signs at fixed locations along the road, the continuous availability on a display inside the car, gives drivers the possibility to detect and identify road sign messages, even if they for some reason missed them when passing the sign. Furthermore, drivers always have a back-up of valid warnings, speed limits etc, whenever they need or want to know them in case of forgetfulness or uncertainty. The idea with CAROSI is that continuous availa-bility of roadside information may be a way to increase traffic safety by reducing drivers' attentional problems and stress, which can result from drivers being unsure or unaware of valid information, warnings etc. So far this is just a hypothesis, and a lot of basic research, concerning effects on safety, accep-tance, comfort etc, is needed before a "CAROSI-type" system can be available for public use.
When a new RTI system (like CAROSI) is developed, it is impor-tant to get an idea about the potential users' opinions about the system as early as possible in the process. For instance: Do they feel a need for the system? Do they find the system user-friendly? Is it thus probable that they will accept and use the system in the future? It is also important to obtain knowledge about if and how the new RTI system may influence driver beha-viour, and if the eventual behavioural changes will be benefi-cial in terms of traffic safety. If roadside information is presented inside the car as long as it is valid: Then, will drivers perceive more warning signs? Such an effect could lead to better prepared drivers who are able to drive safer. Will the continuous availability of the valid speed limit increase speed limit obedience? In that case, the result could be smoother traf and less speed variations, with positive effects for safety as well as for the environment. Or, will the supposed negative effects of divided attention in today's system only be replaced
by similar problems? This may be the result when roadside infor-mation is available inside the car, because drivers then have to divide their attention between the traffic scene outside the car and the display inside the car?
2 CAROSI
CAROSI (CAr ROadside SIqgnalling) is a Volvo demonstrator within the PROMETHEUS project (Hellaker 1990). The system is a first step in the development towards realization of the PROMETHEUS functions F1l1 (intelligent cruise control) and F1l15, F16 (route guidance). It displays information from road signs and from a traffic information centre (via RDS) inside the car. The road sign data are communicated when the microwave antenna mounted on the right rear end of the car activates the transponders mounted on the road sign poles. The information is presented on a display in the car 0.5 - 1.0 second after a road sign has been passed by the car.
The MMI (man-machine interaction) between the driver and CAROSI takes place via a software controlled LCD display (Figure 1), which replaces the conventional dashboard. The display (first version, Autodisplay A.S., Norway) is monochromatic (green) and has three sections, each displaying different types of infor-mation. The left section presents valid road signs in two different positions according to priority (Hellaker 1989). Far to the left, low priority road signs (for example major road and road number) are shown in a column. To the right of this column there is a "high priority frame", where the latest received road sign with medium or high priority (for example warnings for pedestrian crossing, playing children, and sharp bend) is shown. The mid-section of the LCD display looks like a conventional analogue speedometer, supplemented with the legal speed limit shown in the form of a speed limit sign below the speedometer.
VTI MEDDELANDE 689A ( T R A F I N F ) R o a d w o r k s o n
W
ro
ut
e
64
-on
e
we
st
ba
un
d
la
ne
cl
os
ed
of
f.
-
Bi
e
|-Fi
gu
re
1.
Th
eC
AR
OS
I
da
sh
bo
ar
d,
sh
ow
in
gf
ro
ml
eft
to
rig
ht,
lo
wp
rio
rit
yr
oa
ds
ign
,h
ig
hp
rio
rit
yr
oa
ds
ig
ni
na
fr
am
e,
sp
ee
do
me
te
rw
it
hl
ega
ls
pe
ed
lim
it
be
lo
w,
an
dt
raf
fic
in
fo
rm
at
io
n(
wh
ic
hc
an
be
ch
an
ge
dt
ot
ri
pc
om
pu
te
ro
r
ta
ch
om
et
er
in
fo
rm
at
io
nd
ur
in
gd
riv
ing
).
The information presented in the right section varies with the function of this particular section, which can be chosen by the driver via push buttons on the steering wheel. Three alterna-tives are available: a traffic information display which informs the driver about traffic jams, roadworks, accidents etc along the route (via RDS), a tripcomputer which informs the driver about the amount of fuel left, how far s/he can go on this amount etc, and finally a tachometer which informs the driver about the revolutions per minute of the engine. By use of one of the steering wheel buttons the driver can also get the traffic information read (repeated) by a synthetic voice (Infovox) .
3 PURPOSE
The purposes of the study were:
1) to obtain the subjects' opinions about CAROSI, concerning general aspects, design aspects, and effects on driver behaviour related to traffic safety.
2) to compare driver behaviour when "roadside" information is presented inside the car, with driver behaviour when "road-side" information is presented in the conventional way, on road signs along the road.
4 METHOD
4.1 Subjects
Nine subjects (5 men and 4 women) working at Volvo in Gothenburg volunteered for the experiment. Their working tasks were not in the areas of system design and technical development. The subjects were between 22 and 59 years old (mean 38.2, SD 14.0 years). They had had their driving licence for between 3 and 38
years (mean 16.0, SD 10.4 years) and drive between 10,000 and 25,000 km a year (mean 15,833, SD 500 km).
Using a seven-point scale (ranging from 1="no experience at all" to 7="very large experience"), the subjects estimated themselves to be slightly more than average experienced as drivers, and slightly less than average experienced in using computers and/or other electronic devices (mean scores 4.78 and 3.33, respecti-vely). The subjects rated their familiarity with the area where the experiment was run as medium (mean score 3.89 on a 7 pointed scale ranging from 1="no familiarity at all" to 7="very good familiarity").
4 , 2 Test route
A route on Hisingen in Gothenburg (see Appendix 1) was used for the experiment. The road sign poles along the route were "instrumented" with microwave transponders. The route was 26 km long and passed through residential areas, work areas and rural areas. Thus, road sections with legal speed limits of 30, 50, 70 and 90 km/h were included. The traffic information display, the tripcomputer, the tachometer and the steering wheel buttons were not used in this study. The reason was that it was not realistic to communicate messages concerning those aspects along the available test route.
The road signs that appeared on the display in the car during the experiment are shown on the map in Appendix 1.
4 .3 Design
The experiment had a within-subjects design. All the subjects drove the test route both in a conventionally equipped Volvo and in a similar Volvo equipped with the CAROSI system. The order in which the two cars were driven was balanced.
4 , 4 Procedure
When the subjects arrived at the test site they answered a questionnaire about background variables (age, sex, driver licence, distance driven each year and experience of car driv-ing, electronic equipment and test area). This pretest question-naire also contained questions about the need for and usefulness of presenting road sign information inside the car. After answering the pretest questionnaire the subject read "Instruc-tions to subjects". They were told that their task was to drive a test route twice, in a conventionally equipped car and in a car equipped with the CAROSI system. They were also told that one of the experiment leaders would communicate route guidance information verbally along the route. Finally, the subjects were asked to drive as they "should normally drive" under similar traffic and environmental conditions.
The subjects who drove the CAROSI equipped car first had the CAROSI system explained to them verbally, when sitting in the car. To get used to the test car and to the CAROSI system, the subjects drove a short distance within the Volvo area. After practicing, the subjects drove the test route. One experiment leader, sitting in the front passenger seat, communicated route guidance information, asked the subjects about traffic sign information at checkpoints along the route, and wrote down the subjects' answers to the questions. Another experiment leader, sitting in the rear seat, made speed observations, also at chosen checkpoints along the route. When the test route was com-pleted some recording devices were moved to the conventionally equipped test car, and the subjects practiced to drive that car. Directly after practicing they drove the test route a second time. The procedure from the first lap was repeated.
The subjects who drove the conventionally equipped car first practiced to drive that test car within the Volvo area. Then they drove the test route according to the procedure described above. When the ride was completed, and the recording devices had been moved to the CAROSI equipped car, the subjects had the
CAROSI system explained to them, sitting in the car. They practiced to drive the "new" test car with the CAROSI system available. Directly after practicing they drove the test route a second time.
When the subjects had driven the test route with both cars they answered a second, post-test questionnaire about CAROSI. The questions covered general aspects, MMI design and driver behaviour related to traffic safety.
The running of each subject took 1.5-2 hours in total. Six subjects drove under warm and sunny conditions, while it was raining when the remaining three subjects drove. The variations in traffic intensity were neither large nor of systematic nature.
4,5 Measures
Questionnaires were used to obtain the subjects' opinions about CAROSI, concerning different aspects relevant for user accep-tance and traffic safety.
Proportion of correct answers to questions during driving. The experiment leader sitting in the front passenger seat asked each subject a total of seven questions (both laps together). The questions were asked at certain checkpoints along the test route, and dealt with messages on recently passed road signs. For the CAROSI equipped car the messages were also presented on the display. A specific combination of question and location was used only once during the two consecutive laps driven by each subject. The questions were: "Do you drive on a main road"? "Is any prohibition valid here"? In case the answer was "Yes": "What prohibition"? "What speed limit is valid here"? (Asked two times at different locations). "Is any warning valid here"? In case the answer was "Yes": "What warning"?
Proportion of questions for which the subject looked at the CAROSI display before answering. When the subjects drove the CAROSI
equipped car they had the opportunity to look at
the
display to find out the right answer. But, when they drove
with-out CAROSI the subjects had to have perceived and remembered the
message
to be
able to give a
correct answer,
or they
could
guess.
Speed observations. The experiment
leader sitting in the rear
seat
read the speed from the speedometer at two locations along
the test route. Both locations appeared on road segments with a
legal
speed limit of 70 km/h. Thus, for each subject two speed
observations
were made when driving with CAROSI and two
speed
observations were made when driving with the conventional car.
Speed limit
obedience.
Once each lap, the
experiment leader
sitting in the rear
seat observed if the subjects obeyed the
legal
speed limit of 30 km/h at
a specific location. Thus, for
each subject one obedience observation was made during driving
with CAROSI and one obedience observation was made during
driv-ing with the conventional car.
Number of glances at
the dashboard. Via the rear mirror,
the
eyes
of the
subjects were recorded on video tape. The video
camera was positioned in the middle of the rear seat. Recordings
were made
throughout
each test
route lap and the
number of
glances
down at the dashboard was counted from the video tapes
afterwards.
Time on the task. The time taken to complete each test route lap
was measured. It ought not to have been influenced, to a
deter-mining extent, by traffic conditions. They were not controlled
actively in the experiment, but
did neither vary much or in a
systematic way.
10
3 RESULTS
The subjects' answers to the questionnaires are presented as mean ratings of different aspects of CAROSI (Tables 1 to 4). Driver behaviour is described in terms of the number of glances at the dashboard, actual speed, and legal speed limit obedience.
5.1 Questions before test
The first part of the pretest questionnaire served to collect basic data about the subjects and their experiences. These data are reported under the heading "Subjects" above.
The pretest questionnaire also contained questions about how often the subjects miss road sign messages (for instance speed limits), and how often they are unsure when road sign warnings, which are limited in distance, come to an end. We also asked if they think it would be an improvement to have road sign infor-mation available inside the car as long as it is valid. The intention with these questions was to get an idea about the need for and the usefulness of a system like CAROSI. The results are shown in Table 1.
Table 1; Mean ratings, standard deviations, min and max notations (on a 7-point scale with the end points defined in the table) for the answers to the pretest questionnaire.
Mean SD Min Max
Does it happen that you 3.11 0 . 93 2 5
miss road sign information? [never (1) - often (7) ]
Does it happen that you 3 . 33 0 . 87 2 5 are unsure about when
war-nings come to an end? [never (1) - often(7)]
Would it be an improvement 3.89 1.83 2 7
to have road sign informa-tion always available?
[not at all (1) - to a large extent (7) ]
11
The last question in Table 1, i.e. if availability of road sign information inside the car would be an improvement, showed a large rating variation between subjects. The subjects also had the opportunity to give open comments to this question. The comments supported the varying ratings, as both positive and negative comments appeared.
Positive comments:
Road sign information inside the car -= "will be a very good support".
- "will be an improvement because there is a lot of informa-tion and signs along the road, and it is easy to forget
some".
_
=_
"will be valuable when you miss detection of a sign when you
pass it".
Negative comments:
Road sign information inside the car
= "will move the attention from the traffic scene".
= "will
just be a precautionary check because
one is used to
' read' the road oneself".
-= "will be stressful and disturbing".
"It is easier to read conventional road signs".
"Information ought to be presented in detail along the road".
5.2
Questions after test
5.2.1
MMI design
Several
questidns
in the post-test
questionnaire dealt
with
different aspects of the MMI of CAROSI. The subjects' ratings of
these
aspects are summarized in Table 2, which shows
that the
considered MMI aspects generally got relatively high ratings.
The
subjects judged the presented road signs to be easy both to
detect (mean rating 5.44), and to recognize (mean rating 6.22) .
According to their comments the most
important reason for easy
12
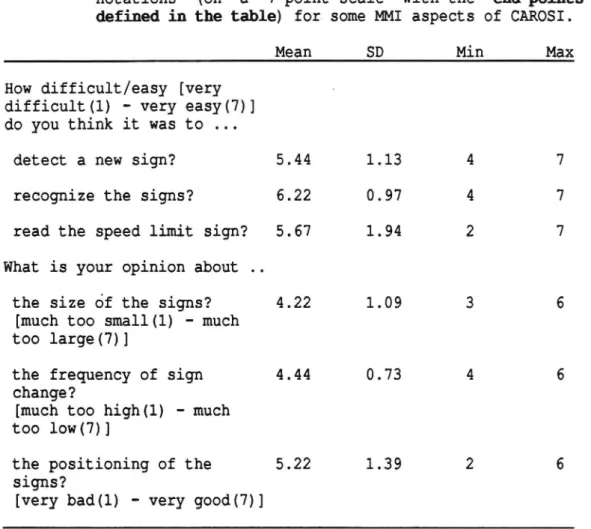
detection was that the signs were large and distinct. However, one subject commented that the low priority signs, presented far to the left on the display, were difficult to detect due to less distinctness. The subjects thought that the road signs were easy to recognize because they were very well reproduced, and looked like "real" road signs (except for the monochromatic colour) .
Table 2: Mean ratings, standard deviations, min and max notations (on a 7-point scale with the end points defined in the table) for some MMI aspects of CAROSI.
Mean SD Min Max
How [very
difficult (1) - very easy (7) ] do you think it was to ...
detect a new sign? 5.44 1.13 4 7
recognize the signs? 6.22 0 . 97 4 7
read the speed limit sign? 5.67 1.94 2 7
What is your opinion about ..
the size of the signs? 4,22 1.09 3 6
[much too small (1) - much too large (7) ]
the frequency of sign 4 , 44 0 . 73 «4 6 change?
[much too high(1) - much too low (7) ]
the positioning of the 5,22 1.39 2 6
signs?
[very bad (1) - very good (7) ]
The legal speed limit was shown as a speed limit sign below the speedometer, which was conventionally positioned on the dash, board (display). The readability of the speed limit was also rated high (mean rating 5.67) by the subjects. But, among the MMI-questions, the answers to this question showed the largest variation between subjects (SD 1.94). Frequent explanations for high rating of the readability were that the speed limit sign was positioned close to the speedometer, and right in the middle
13
of the visual field. The size and distinctness were also mentioned as reasons for high ratings. Explanations for low ratings were that the speed limit sign "disappeared" in the rest of the speedometer, and that an analogue pointer is easier to read. The general comment that the display was difficult to read in heavy sunshine appeared.
The size of the presented road signs was judged to be well adapted (mean rating 4.22), and the rate by which they were changed was at least not regarded as disturbingly high (mean rating 4.44). The positioning of the different sign categories also seems to be acceptable (mean rating 5.22), although not optimal as can be seen from the large variation in ratings between subjects (SD 1.39). Most subjects were positive because the signs were concentrated within a limited area, relatively -straight ahead in the visual field, and also because they were found where they could be expected. The subjects who were nega-, tive wanted the information to be presented higher and more to the right (more central in the visual field).
5.2.2 Behavioural effects related to traffic safety
In another section of the post-test questionnaire the subjects had to estimate the influence of CAROSI on their driving beha-viour, and on traffic safety. The results are shown in Table 3.
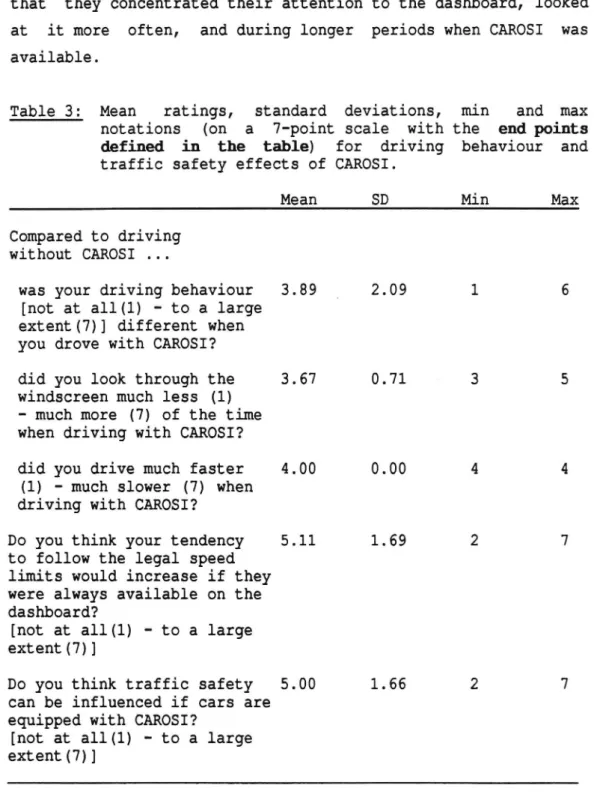
For well-defined subtasks of driving, speed choice and visual search, the subjects were fairly sure that their driving behaviour was similar whether CAROSI was available or not (mean ratings 4.00 and 3.67, respectively). On the other hand, when "driving as a whole" was considered the subjects rated their driving behaviour to be different to a relatively large extent when they drove the CAROSI equipped car (mean rating 3.89), com-pared to when they drove the conventionally equipped car. The variation in the individual ratings of "driving as a whole" was, however, very large. The open comments to this question (the first one in Table 3) revealed that most subjects experienced
14
that they concentrated their attention to the dashboard, looked at it more often, and during longer periods when CAROSI was available.
Table 3: Mean ratings, standard deviations, min and max notations (on a 7-point scale with the end points defined in the table) for driving behaviour and traffic safety effects of CAROSI.
Mean SD Min Max
Compared to driving without CAROSI ...
was your driving behaviour 3.89 _ 2.09 1 6 [not at all (1) - to a large
extent (7) ] different when you drove with CAROSI?
did you look through the 3 . 67 0.71
-
3
5
windscreen much less (1)
-= much more (7) of the time
when driving with CAROSI?
did you drive much faster
4.00
0.00
<4
4
(1) - much slower (7) when
driving with CAROSI?
Do you think your tendency
5.11
1.69
2
7
to follow the legal speed
limits would increase if they
were always available on the
dashboard?
[not at all (1) - to a large
extent (7) ]
Do you think traffic safety
5.00
1.66
2
7
can be influenced if cars are
equipped with CAROSI?
[not at all (1) - to a large
extent (7) ]
According to Table
3,
the subjects estimated that the
intro-duction of CAROSI may influence traffic
safety to a relatively
large
extent (mean
rating 5.00). The variation
in individual
ratings
was, however, large again
(SD 1.66). Only one
subject
was pessimistic and believed that traffic safety would decrease,
because
of "more dashboard-looking" resulting in delayed driver
reactions. The remaining (8) subjects estimated positive effects
15
of CAROSI on traffic safety. Mentioned reasons were (assuming an optimal and accepted system) :
- "Drivers need support to perceive the large amount of informa-tion available along the roads today".
- "The information will become more 'personal' as it was expe-rienced to have stronger 'influence' when it came so close". - "The attention to, and the awareness of roadside information
will be increased".
-= "Roadside information will be easier to obtain".
- "The proportion of missed roadside information will decrease". "Drivers' search for information will be facilitated, because roadside information appears within the same limited area'".
From Table 3 it is also obvious that some (SD 1.69) subjects think that their obedience of legal speed limits may increase considerably (mean rating 5.11), if the speed limit information is continuously available inside the car.
5.2.3 General aspect
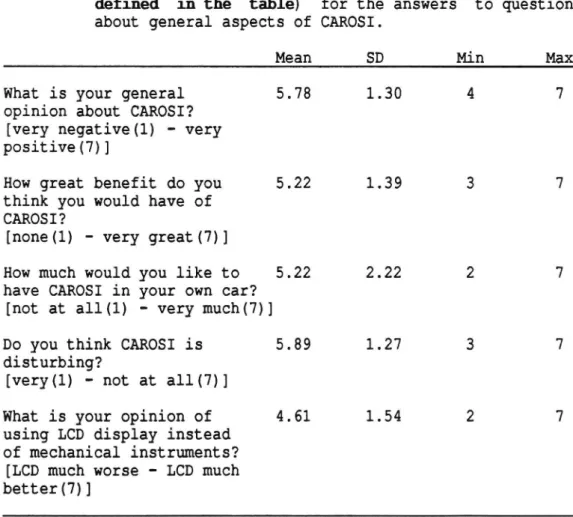
The more "general" questions asked in the questionnaire given after the test are listed in Table 4, together with the results. The answers show that, on average, the general opinion about CAROSI is positive (first three questions in Table 4), and the disturbance level is experienced to be low (forth question in Table 4). It can, however, be noticed that the inter-individual variability is commonly large for the answers to these ques-tions. The open comments reveal that some subjects are a little worried about the fact that the continuous availability of information inside the car will initiate more looking at the dashboard, and thus lead to divided attention, with less atten-tion left to the traffic scene outside the car. At the same time they think it is an improvement for the driver to be able to check if s/he has missed some information.
16
Furthermore, most subjects think that the LCD display, as a
type
of display, is as
good as conventional mechanical instruments
(mean rating 4.61). The opinions are,
however, somewhat
diffe-rent
(SD 1.54). It was
commented that drivers are
used to the
"old" mechanical instruments, and therefore
know by experience
how to read them. "New"
solutions can probably be
as good, or
even better in presenting relevant information, but drivers have
to
get used to using them. Another comment was
that the
"car-area"
has to follow the development in the rest of society. One
subject
complained about the low visibility of the LCD in heavy
sunshine.
An additional
complaint was
that the
contrast was
lower for the LCD compared to mechanical instruments.
Table 4:
Mean
ratings,
standard deviations,
min
and max
notations
(on a
7-point scale
with the
end points
defined in the table)
for the answers to questions
about general aspects of CAROSI.
Mean
SD
Min
Max
What is your general
5.78
1.30
4
7
opinion about CAROSI?
[very negative (1) - very
positive (7) ]
How great benefit do you
5.22
1.39
3
7
think you would have of
CAROSI?
[none (1) - very great (7) ]
How much would you like to
5,22
2 . 22
2
7
have CAROSI in your own car?
[not at all (1) - very much (7) ]
Do you think CAROSI is
5.89
1.27
3
7
disturbing?
[very (1) -=- not at all (7)]
What is your opinion of
4.61
1.54
2
7
using LCD display instead
of mechanical instruments?
[LCD much worse - LCD much
better (7) ]
17
5.3 Answers to direct questions during driving
At certain locations along the test route, the experiment leader sitting in the front passenger seat, asked the subjects about messages on passed road signs, also appearing on the CAROSI display. When the roadside information was available via CAROSI the proportion of correct answers was 78%. The corresponding proportion, when the information was to be found on the ordinary road signs only, was 69%. The difference is not significant (p>0.05). Hesitation before answering occurred for 6% (CAROSI) and 12% (conventional) of the questions, respectively. A wrong answer, or the answer "I don't know" was given to 16% (CAROSI) and 19% (conventional) of the questions, respectively. The proportion of wrong answers, when driving with CAROSI, includes two questions (responsible for 7 of the 16% wrong answers) for which the subjects were more or less cheated to give a wrong answer, because the display showed a wrong sign due to technical problems.
When the subjects drove the CAROSI equipped car, the experiment leader also observed if they looked at the display before they answered the questions. This was the case for 64% of the ques-tions. One subject never looked at the display in relation to the questions asked.
5 . 4 Glances at the dashboard
The number of glances at the dashboard was on the average 3 times higher when the subjects drove the CAROSI equipped car compared to when they drove the conventionally equipped car. The mean numbers of glances for the nine subjects were 204 (CAROSI) and 93 (conventional), respectively. The difference was found to be significant at the 5% level (F=6.07, p=0.027) in spite of a large inter-individual variability, with the number of glances ranging from a couple of tenth to a couple of hundreds for the conventionally equipped car, and from about one hundred to several hundreds for the CAROSI equipped car.
18
Also, the glances at the conventional dashboard were more fre-quent for the subjects who drove the CAROSI equipped car first compared to the subjects who drove the CAROSI equipped car after the conventionally equipped car. The subjects' tendency to look more often also at the conventional dashboard, after they had driven the CAROSI equipped car, was not found to be significant
(p>0.05) .
J
5.5
Speed observations
The mean speed for the nine subjects was 72 km/h when they drove
the CAROSI equipped car, and 70 km/h when they drove the
con-ventionally equipped car. The difference was not found to be
significant (p>0.05). No effect of "order of car" was obtained
either. The maximum speed observed was 85 km/h. On the whole,
the subjects obeyed the legal speed limits very strictly, both
when driving the CAROSI equipped car and the conventionally
equipped car.
At one location along the test route, the warning sign "Playing
children (school)" accompanied by a speed limit of 30 km/h was
passed. Seven of the subjects obeyed this speed limit strictly
when they drove the CAROSI equipped car, and eight subjects
obeyed it when they drove the conventionally equipped car.
5.6
Time on the task
The times to complete a test route lap did not differ (p>0.05)
between driving the CAROSI equipped car, and driving the
conven-tionally equipped car. No effect of "order of car" was found
either. The mean driving times for the nine subjects were 30.6
minutes for the CAROSI equipped car, and 31.2 minutes for the
conventionally equipped car. One subject took the wrong way at
one choice point, but the additional time was compensated for.
19
6 DISCUSSION
6.1 Drivers' need for roadside information
A basic question for any RTI system is whether it fulfils a driver need. If it does, the probability for acceptance of the system is higher than for a system that does not fulfil a driver need. Judging from the subjective ratings in this study, there seems to exist a need for presenting roadside information in a more dynamic and flexible way, that is, for the type of system that CAROSI represents. The subjects admitted that they sometimes miss roadside information, and that they sometimes are uncertain about when warnings come to an end. These problems may even be greater than rated, if we consider that people usually find it difficult to report their own mistakes (Svenson 1981). An example of this is the comment from one subject, that "CAROSI can be beneficial for other drivers, but it did not please me"! The subjects' opinions about the idea to present roadside infor-mation inside the car were more divided. Some subjects seemed a little unsure about to what extent a system like CAROSI would be an improvement, at least before they had tried it. This is hard-, ly surprising, but a normal reaction when new concepts and/or products are introduced. Earlier research in cognitive psycho-logy (Phillips and Edwards 1966) has shown that people often are conservative and slow in revising their opinions.
It is reasonable to conclude that the obtained ratings reflect a need for the "CAROSI-type" of information providing system, and that such a system would improve the driver situation, at least for some drivers.
Z Acceptance of the CAROSI system
The subjects' general opinion about CAROSI, after trying it, was mildly positive, and the system was not perceived as disturbing. The subjects also seemed to believe that the CAROSI system could be of some benefit to them, and there was a tendency that they
20
would like to have it in their own car. In this context it must, however, be stressed that there were rather large rating varia-tions between individuals in the (very small) experimental group. It must also be stressed that all the subjects were employed at Volvo, which may have had an influence upon their answers.
Based on the limited results, a reasonable conclusion is that the general driver attitude to the CAROSI system was positive. It seems to fulfil a need, at least for some drivers, without bringing too much of disturbance.
6.3 Design of the CAROSI system
Given the existence of the need described above, the next question concerns how to design a system that fulfils the need. This brings us to the questions dealing with the MMI design of the CAROSI system. A general comment is that using a LCD display may, under some light conditions, lead to readability problems. Low visibility in heavy sunshine, and lower contrast compared to mechanical instruments were pointed out as disadvantages by some subjects in the open comments. Efforts should be made to improve these features. Looking at the subjects' ratings of the MMI aspects some tentative conclusions (tentative due to the rather small sample of subjects in the study) can be drawn.
The results reveal that it was easier to recognize a sign than to detect it when it was presented. Thus, the subjects did not always notice that a new sign had been presented on the dash-board. This is positive if the driver already has detected the road sign outside the car. Then, the presentation inside the car is simply a redundant backup. But, if the driver has not detected the road sign outside the car, it is of course negative that s/he does not notice it on the display. One solution, to draw the attention to the presentation of a new sign more effec-tively, may be to let an alerting sound precede it. However, such a solution may, on the other hand, increase the risk of
21
internal distraction, because it can, to a too large extent, draw the driver's attention from the road scene. Another risk is that a frequently appearing sound may lead the driver to switch off the system.
One way to minimize the risks, for internal distraction and switching off the support system, is to select more carefully what information to present on the display inside the car. An idea is that only road signs, which are especially important for, and related to traffic safety should be automatically displayed, and preceded by some kind of alerting signal. Maybe less important road signs can be shown on the driver's request. Thus, future tasks are to determine what should be regarded as important roadside information in different traffic situations, and for different driving behaviour, and to modify the system according to this. Then, it is necessary to test the modified system again, in order to evaluate to what extent the system draws the driver's attention from the primary driving task. The testing must include long term studies of the system, to make it possible to judge if and what effects that remain after the introductory phase. For example, can the reported ease to detect and recognize the road signs be a result of the increased number of glances at the dashboard? If that is the case, a more select-ive choice of which road signs to present, together with drselect-ivers getting used to the system (resulting in less "charm of novelty glances" at the dashboard) may instead lead to deteriorations in detection and recognition.
The recognition of road signs got high ratings, reflecting the benefit of displaying icons looking like real road signs, to which drivers are familiar. The ratings were, however, not opti-mal and can probably be improved easily by presenting the signs in their real colours (which is the case for later versions of CAROSI displays), or making them larger, or by combining a more realistic colouring and increased size. To achieve better recog-nition, and detection, of displayed road signs they can all be positioned in a more limited area in the centre of the driver's field of vision. Then, it should be even easier for drivers to
22
find the information they are searching, as pointed out by some subjects in the open comments. Such a solution would be most likely to be used if only road signs with the highest priority should be presented. Then the "high priority frame" is enough.
The opinions about the readability of the specific speed limit sign, presented below the ordinary speedometer, varied a lot and shall be improved. This can be done by considering the colour, size and position aspects in the same way as discussed generally above. The idea to mark the legal speed limit in the speedometer is not bad. The marking can be realized by a pointer, by colour-coding, or why not by modifying the range of the displayed speed scale. The important thing is that the marking is pronounced enough so it does not "disappear" in the rest of the speedo-meter, as was the case in the tested CAROSI system according to some subjects. The legal speed limit must also be easy to distinguish from the actual speed.
6 . 4 Safety related effects of the CAROSI system
A very important aspect of any new RTI system is that it must not increase the risk of an accident, which may happen if a system distracts the driver. There exist some different ways to look at safety effects of new RTI systems. One way is to ask drivers to make judgments, concerning the level of distraction and other safety related behaviour. The danger with this approach is, of course, that it may be difficult to get honest answers. Not all drivers are willing to admit their own errors (Svenson 1981). Another way is to let someone else but the driver observe relevant driver behaviour. A combination of subjective reports and "objective" observations give more trust-worthy results.
23
6.4.1 Subjective judgments of traffic safety related beha-viour
We can note that most subjects regarded their driving behaviour as different, when they drove the CAROSI equipped car compared to when they drove the conventionally equipped car. The differ-ence consisted mainly, according to their subjective judgments, in a tendency to either look more or less through the wind-screen. Thus, if we prefer to trust the subjects' ratings of their own behaviour, then some subjects were partly distracted by the CAROSI system, and some seemed to avoid looking at it. In this context it is important to note that a curiosity reaction is to be expected when a new system is introduced. To investi-gate adaptation effects it is necessary to perform longitudinal studies. Another interesting result was that most subjects believed that their tendency to follow the legal speed limits would be positively influenced if they were presented (as by the CAROSI system) on a display inside the car. (This was stated despite the fact that the subjects also denied that the CAROSI system had any influence upon their own speed choice during the experiment . One possible reason for this being that they strict-ly obeyed the speed limits during the experiment). All but one subject believed that traffic safety could be positively influ-enced by the introduction of CAROSI. The reasons for traffic safety benefits were that the system would help the driver to perceive and attend to relevant information, that the system could act as an information backup, and also that it should make the information more personal. These subjective judgments should be regarded as hypotheses, which would be very interesting to test. If it is possible to affect the drivers' speed choice, and thereby decrease the dispersion in speed levels through the use of CAROSI, then the system can have a positive effect on traffic safety. That is, if the system does not have a negative impact on some other aspect (s) connected with traffic safety.
24
6.4.2 Observed traffic safety related behavioural effects
The CAROSI system transfers road sign (visual) information from the traffic environment outside the car to a display inside the car. Therefore, the number of eye fixations to the dashboard can be regarded as an important measure, reflecting the subjects visual attention. A significant difference between the number of fixations (on the average 204) to the CAROSI dashboard and to the conventional dashboard (on the average 93), during a test route lap, was found. This is in agreement with most of the subjects' ratings and comments, that they looked more frequent and for longer periods at the CAROSI dashboard. To what extent can it then be reasonable to allow an in-car information pro-viding system to distract the driver's visual attention? Despite the complicated nature of the issue, a tentative design guide-line has been presented (Zwahlen, Adams and DeBald 1988), suggesting that to gain visual information inside a car not more than three fixations shall be required, each fixation not being longer than 0.9 to 1.0 second (or maybe 1.2 seconds maximum if the number of fixations is reduced to one) .
As an example, if we assume that each fixation has a duration of 1 second, 204 fixations mean that the driver takes his/her eyes away from the traffic for 204 seconds. As the test route took about 30 min (=1800 seconds) to drive, the driver looked at the dashboard for about 11% of the driving time. The maximum number of fixations recorded was 442, representing 25% of the driving time. The duration of the fixations were not recorded in the study. It can, however, be expected to have been relatively long. The reason is that a road sign was not presented on the display until 0.5 to 1.0 second after the road sign pole with the transponder had been passed, and many subjects wanted to check if the passed sign would show up inside the car (a "charm of novelty effect"). The increase in number of fixations, as well as the assumed proportion of driving time when the driver is occupied by looking at the dashboard, are of orders of magni-tude which justify further investigation.
25
Looking at the speed levels, when driving with and without the CAROSI system available, no difference could be detected. It was also noted that all subjects obeyed the posted speed limits very closely, a result revealed in their subjective ratings of speed. This lack of speed effects is not surprising if we consider that the subjects were in a test situation, where they to some extent must experience that they are observed. Moreover, the subjects were a little more familiar with the test area than desired, that is, they probably knew the speed limits.
To conclude, the CAROSI system mainly seems to have an impact upon drivers' visual behaviour. Since the system was new to the subjects it is very likely that the effect (increase in number of fixations to the dashboard), at least partly, can be attri-buted to the "charm of novelty", and that it probably will decrease after repeated use of the system. But, for how long will the effect last? Is the "dashboard-looking" part of a con-scious and strategic information searching process, or is it a more randomized behavior of curiosity and caution? And, what will happen when more new, and maybe interacting, systems are introduced, giving the driver the opportunity to continuously monitor a lot of data available inside the car? These questions are important to answer, and point to the need of further studies (especially longitudinal ones) of the impact of CAROSI-type systems upon driver behaviour.
6.5 The knowledge effect of the CAROSI system
To be able to have a positive effect upon drivers' behaviour the information from the system must be processed (read and inter-preted) by them. When the subjects drove the CAROSI equipped car, they answered questions concerning roadside information more correctly than when this information was not available inside the car. The difference was not large enough to be signi-ficant. For 64% of the questions, the "CAROSI drivers" looked at the dashboard before answering. The proportion seems high if our hypothesis is that most drivers detect most of the "real" road
26
signs when they pass them. But, based on other results obtained in the study, and on the hypothesis that subjects, in a test situation, check their answers before delivering them when that possibility exists, the proportion seems to be rather low. A possible explanation can be that the subjects guessed, but a more probable reason is that they, due to their relatively good familiarity with the test route area, knew the correct answers "by heart". All the same, it seems safe to assume that the information presented by the CAROSI system actually was read and interpreted by the subjects.
6.6 Future research
From a researcher's point of view there exist several inte-resting and important questions that deserve attention. A basic assumption behind the CAROSI system is that the presentation of roadside information inside the car will have a positive effect on traffic safety and driver convenience. This study supports the possibility that the CAROSI-type of systems may have a positive effect upon drivers' speed choice, and thereby reduce speed variation and improve traffic safety. It is also possible that the system may have a negative impact upon especially the elderly drivers' ability to perceive information outside the car, and thereby increase the risk of an accident. If these two hypothetical effects cancel each other, or if one of them domi-nates over the other must be clarified.
If the CAROSI system changes drivers' visual attention in a negative way, then the next step is to consider how to improve the system design. One way would be to be very selective with what roadside information to present via the system, and as suggested earlier, only present prioritized safety related information. Another possibility is to design the system in a way that prevents the system from presenting messages when the driver is in a traffic situation, where the demands upon visual attention are high. There exist a number of possible solutions to this problem, solutions that deserve further studies. A third
27
possibility is to change the location of the presented informa-tion, from the present area to a more centrally located area. In the future the information may even be presented on a Head Up Display (HUD), a solution which would be attractive also for elderly drivers, by eliminating some accommodation problems. Still another possibility is to use other sense modalities as information receivers for roadside messages. Research in that direction is presently being undertaken in other European projects.
7 CONCLUSIONS AND SUGGESTIONS
The studied CAROSI version mainly influences the drivers' visual behaviour, that is the division of visual attention between the traffic environment outside the car and the display inside the car. A very reasonable hypothesis is that the increased "dash, board-looking", which could have a negative impact on traffic safety, at least to some extent, is an effect which can be attributed to the "charm of novelty". To gain the necessary knowledge on this topic longitudinal studies shall be performed.
The subjects' judgments of possible speed choice effects should also be investigated in a longer time perspective, after repeated use of the system, and in (for the drivers) unknown environments.
Another hypothesis is, that the large number of fixations to the CAROSI dashboard results from the drivers' wish to check if a "new" road sign has been presented. To facilitate this search of information, the road sign presentation can be preceded by an audible signal.
A lot of audible signals will, however, annoy drivers and neither be beneficial for driver acceptance/convenience nor for traffic safety. Probably, it is not necessary to show every road sign that is passed automatically, but only the most important
28
ones. Therefore, it is suggested that the classification of the road signs shall be looked over, to select those of real high priority for automatic presentation. All other road signs shall be possible to show on driver request.
The use of familiar "road sign icons" is beneficial for the detection and interpretation of the messages. However, a third hypothesis is that the in-car acquisition of road sign infor-mation can be improved, for instance if the signs have their "real" colouring (which is the case for the later versions of the CAROSI system), and if the combination of sign size and position is optimized.
The presentation of the legal speed limit deserves special attention, for its optimal integration in the presentations of other road signs and actual speed.
The LCD display used must be easier to read in "difficult" visibility conditions like heavy sunshine.
The possibilities for the CAROSI-type of RTI system to be accepted and used by drivers seem to be good, based on our study. But, work to improve the design still remains.
29
8 REFERENCES
Alm H: Driver behaviour models and accident causation. VTI sartryck 145 (Reprint from DRIVE project V1O01l7, BERTIE), 1989.
Hellaker J: CAROSI - Car Roadside Signalling. Proceedings of the 3rd PROMETHEUS Workshop, Torino, April 26 and 27, 1990.
Hellaker J:; CAROSI Application Protocol, VTS Transportation Systems AB, Sweden, 1989.
Nilsson L: Accident prone traffic situations and driver mistakes. Report RISAFO5, PROMETHEUS Sweden/IT4, 1989.
Phillips LD, and Edwards W: Conservatism in a simple probability inference. Journal of Experimental __Psychology, 72(3),
346-354, 1966.
'
Planek TW: The effects of aging on driver abilities,
accident
experience,
and licensing. In: H.C. Foot, A.J. Chapman, and
F.M. Wade
(Eds.),
Road Safety - Research and Practice,
Praeger, Eastbourne, 1989.
Svenson O: Are we all less risky and more skilful than our
fellow drivers? Acta Psychologica, 43, 119-133, 1981.
Treat JR: A study of precrash factors involved in traffic
accidents. HSRI Research Review, 1980.
Zwahlen T, Adams Jr. CC, and DeBald DP: Safety aspects of CRT
touch panel controls in automobiles. In (Eds.) A.G. Gale et
al., Vision in Vehicles - II, Elsevier, Amsterdam, 1988, pp.
335-344.
APPENDIX 1
Test route with the presented road signs indicated.
a R i k t ni n g f or p r o vs t r a c ka NS N y s to l p e = = V a q ma r k e B E TE C KN I N GA R | == # » T r an s p on d e r E d a l en