Examensarbete i omvårdnad, 15 hp
Physical frailty in association to depressive
symptoms among older adults
A cross-sectional study
Erika Liljenfors
Handledare: Professor Johan Berglund Sjuksköterskeprogrammet, kurs: OM1434
Blekinge Tekniska Högskola, Institutionen för hälsa Karlskrona december 2014
Blekinge Tekniska Högskola, Institutionen för hälsa, Sjuksköterskeprogrammet, Examensarbete i omvårdnad December 2014
Physical frailty in association to depressive
symptoms among older adults
Erika Liljenfors
Summary
Background: The Swedish populations is aging, and with age the risk of physical frailty and
having depressive symptoms increases and can have a negative impact on the person. With aging the physical ability changes because of the natural process and also because of other factors for example diseases.
Purpose: To examine if there was an association between physical frailty and depressive
symptoms among people 60 years and older.
Method: The study is a quantitative cross-sectional study, based on data taken from the
Swedish National Study on Aging and Care in Blekinge (SNAC-B). The processing of the material was done in two parts, a descriptive part and an analyzing part to identify the prevalence and examine relationships.
Results: According to the definition of physical frailty and depressive symptoms in this
study, there was an association between them two. There was statistic association between women with physical frailty and depressive symptoms but there was none between men with physical frailty and depressive symptoms. The persons having finished primary school had more physical frailty and more depressive symptoms then the ones that finished secondary school.
Conclusions: The study showed an association between physical frailty and depressive
symptoms for older adults. The most vulnerable were more likely to be woman and have less education. To be able to support the older adults it is essential for the nurse to have more knowledge about physical frailty and depressive symptoms to support the patient in their care.
Table of contents
Introduction 4
Background 5
Physical frailty 5
Depressive symptoms among older adults 6
Purpose 7 Hypothesis 7 Method 7 Sample 7 Data collection 8 Instruments 9 Data analysis 10 Ethical considerations 11 Results 11 Physical frailty 12 Depressive symptoms 13
Physical frailty in association to depressive symptoms 14
Discussion 16
Method discussion 16
Result discussion 19
Conclusions 21
Introduction
The Swedish population has during the last decade increased in age, mainly because of improved society structure (Scb, 2014). The lifestyle of people affects the longevity of their life and the development of different kind of diseases (Socialstyrelsen, 2013). In 2009 people over 65 years of age represented approximately 18% of the total population in Sweden and in 2060 according to calculations this group of people will have grown to 25% of the total population (Scb, 2009). In 2013 the life expectancy of women was 83,7 years and for men 80,1 years (Scb, 2014). With older age the risks of different kind of diseases increases, mainly cardiovascular diseases, which is the most common cause of death among elderly in Sweden (Socialstyrelsen, 2013).
According to the WHO (2011) reports show that the percentage of people 60 years and older is increasing all over the world. Many of the older adults have multiple organ problems and co-morbidity but the modern health-care systems are mostly organized around a specific disease (Rockwood & Hubbard, 2004). Physical frailty on the other hand is a practical approach that focuses on the holistic view of the patient with a concern about older adult’s vulnerability and outlook, instead of looking to the specific illness. Physical frailty increases steadily with age (Collard, Boter, Schoevers & Oude Voshaar, 2012). A person with physical frailty has a vulnerability, which increases the risk of adverse outcomes, falls and disability (Eeles et al., 2012). People categorized with physical frailty were reported to have a higher ratio for long-time care and mortality then people not having physical frailty but growing old is not in itself a guarantee to get physical frailty because every individual have different prospects depending on life situations (Fried et al., 2001). A person’s view on health is individual and based on the person’s earlier experience of health, upbringing and society’s influence. Therefor it is of importance for the nurse to have knowledge about factors that may affect the health among older adults negative (Eriksson, 1993). This to be able to help and prevent the individual from an aggravated condition and the risk of admission to long-term care since it is higher in those who suffer from physical frailty then in individuals with non-physical frailty (Rockwood et al., 2004).
Background
People all over the world are living longer because of the improved standards of public health and better medicine (WHO, 2011). In Sweden it is said that the chronological aging starts at age of 65 while the biological aging starts at age of 70 (Socialstyrelsen, 2011). These age limits has been criticized by Persson et al. (2001) instead they consider aging begins at the age of 60 because that is when the body start to show changes such as the body system becomes more sensitive as a result of spare capacity in the body decreases. Aging is a process with psychological, social and biological changes for the individual. The biological changes reduce the capacity of the body and make the organs more susceptible to illness and stress (Socialstyrelsen, 2009). Thanks to improved healthcare more people can today expect to live longer with health disorders. With the higher age it also comes a greater risk of attracting several diseases and health problems at the same time also known as co-morbidity (Sociala rådet, 2010). All the major causes of death in the population such as different diseases are more common among those with less education. Education is an indication of socioeconomic status and matters to the individuals’ health. A person with less education experiences their health as poorer and suffers from more mental illness then those with a higher level of education (Socialstyrelsen, 2013).
Physical frailty
Physical frailty is a term used to describe a state where the person has lost functional abilities and because of this becomes more vulnerable (Rockwood et al., 2005). Physical frailty is a common term, used by health care professionals but it does not have a precise definition or considered a diagnosis (Gillick, 2001). Previous research on physical frailty has suggested it possible to detect early those that are the most at risk of becoming ill or in need of care (Kaufman, 1994). The prevalence of physical frailty is increasing among older adults but is not a natural part of ageing in itself since many older people never get physical frailty.
Neither is to be disabled the same as having physical frailty. However physical frailty results in disability and usually indicates that a person is at higher risk for morbidity and mortality (Fried et al., 2001).
Two main models of physical frailty are the phenotype model (Fried et al., 2001) and the cumulative deficit model, the later, which forms the basis of the Canadian Study of Health and Aging (Rockwood et al., 2005). Fried et al. (2001) defined the physical frailty syndrome
based on the presence of at least three or more of five defined characteristics. The
characteristics are unexplained weight loss, muscle weakness, self-reported exhaustion, slow walking speed and low activity level. These criteria provides an empirically derived and validated definition of physical frailty and the presence of physical frailty was shown to be independently predictive of the incident of falls, worsening mobility, deteriorating function of activities of daily living, hospitalization and death (Fried et al., 2001).
Depressive symptoms among older adults
When aging the individual sometimes undergo more crises, sorrows and burdens than earlier in life. This may contribute to that depressive illness develops (Dehlin & Rundgren, 2007). The prevalence of depressive symptoms is higher among older adults than among young people as well as the etiology may differ (Dehlin & Rundgren, 2007). Somatic illness, living alone, medical treatment, disability, chronic pain, dependency on others and aging of the brain structures can contribute to the development of depressive symptoms in the older individual. The central symptoms of a real depression are the reduced general condition, having a feeling of rejection, melancholy and oppression. There can be a feeling of
listlessness, indifference to the surroundings and slowness, intellectually, emotionally and physically. Depressive symptoms are characterized by a depressed mood, decreased level of energy and activity. There can often be a pronounced fatigue after every little effort and sleep disorders are frequent, also the self-esteem is almost always reduced (Dehlin & Rundgren, 2007). Depressive symptoms is undoubtedly a common problem among older adults where many times the physical symptoms of depression are mistaken for a sign of real physical illness or a generally aging and they may not get proper treatment (Berg, 2007). Thus, it can mean a great deal of suffering and an increased need for services and care for the affected. In addition, if depressive symptoms is not detected and treated at an early stage it can result in severe depression and lead to increased risk of suicide (Berg, 2007).
A common way to screen for depression and depressive symptoms is to use questionnaires. By using questionnaires there is an opportunity to identify the variation in emotional status and it can provide a description of only a mildly reduced life satisfaction to the more severely depressed (Montgomery & Åsberg, 1979). The main requirement for a questionnaire
screening for depression and depressive symptoms is that it should be easy to apply in a clinical setting and relevant for depressive illness (Montgomery & Åsberg, 1979). The Montgomery Åsberg Depression Rating Scale (MADRS) is a screening tool with 10 items
that are all core symptoms of depressive illness. The symptoms involved is about apparent sadness, reported sadness, inner tension, reduced sleep, reduced appetite, concentration difficulties, lassitude, inability to feel, pessimistic thoughts and suicidal thoughts (Montgomery & Åsberg, 1979). The instrument exhibits good reliability and high
associations between expert assessment and self-assessment (Svanborg & Åsberg, 1994). The purpose of the questionnaire is to give a detailed picture of the individual’s state of mind with the help of 10 different statements on how one can feel in various ways. Statements
expressing various degrees of discomfort, from the absence of discomfort to a maximum of discomfort (Montgomery & Åsberg, 1979).
Purpose
The purpose of the study was to examine if there was an association between physical frailty and depressive symptoms among people 60 years and older.
Hypothesis
H0 - There is no association between physical frailty and depressive symptoms among older
adults.
H1 -There is an association between physical frailty and depressive symptoms among older
adults.
Method
This study is a cross-sectional study based on participants from the longitudinal study SNAC-B (Swedish National Study on Aging and Care – SNAC-Blekinge) (Lagergren et al., 2004).
Sample
SNAC is a Swedish national and long term, longitudinal, multipurpose study that has been initiated by researchers and the government in 2001 (Lagergren et al., 2004). The purpose of the SNAC-study is to follow people 60 years and older during their aging process and to see their need of health and social care. The intention is to increase the understanding of the aging process and to identify preventive strategies (Lagergren et al., 2004).
The SNAC-study consists of one population part that describes the aging in relation to life situation and one care and services part that describes and analyzes the health care system in relation to the older adults (Lagergren, 2005). SNAC is besides in Blekinge (Karlskrona SNAC-B) also performed in Skåne (Eslöv, Hässleholm, Malmö, Osby and Ystad, SNAC-S), Stockholm (Kungsholmen, SNAC-K) and Nordanstig (Gävleborg, SNAC-N), all different areas of Sweden to make the study as representative as possible for the country, giving a mix of urban, rural and mixed areas (Lagergren et al., 2004).
The sample in the present study is from the population part where a group of older adults in different age cohorts are followed over time. The participants have attended repeated
interviews, clinical examinations and questionnaires regarding the individual’s lifestyles and living conditions, health status, personality, care needs, functional and cognitive ability etcetera (Lagergren et al., 2004).
In the SNAC-B study the participants are residents in Karlskrona municipality which is considered an area of mixed structure with 60 600 inhabitants. To be enrolled in the study the requirement was to be aged 60 years or over and the participants were recruited from ten different age cohorts, 60, 66, 72, 78, 81, 84, 87,90, 93 and 96 + years old. The participants were selected from the Swedish civil registration database and were intended to represent the aging population in a Swedish midsized town. The response-rate in SNAC-B was 62%
(Fagerström et al., 2008). For the age groups between 60 and 78 years old there is a follow up every sixth year and after that age the follow ups are done every third year. Every sixth year there is also a new cohort of 60 and 81 years old that will join the study (Lagergren et al., 2004). The first baseline study was done in 2001-2003. In the four youngest age cohorts (60, 66, 72 and 78) the sample of the population was recruited by randomization whereas all individuals in the older age cohorts (81, 84, 87, 81, 90, 93 and 96 +) living in the community were invited to participate in the SNAC-study (Lagergren, 2005).
Data collection
Data for the SNAC-study were collected by structured interviews, self-administered
questionnaires and clinical examination. The interviews and examinations were done in the SNAC-B research center overseen by an organized team for the data collection (Lagergren et al., 2004). For those participants that could not make their way to the center the investigation
was done in their own home (Fagerström & Hellström, 2011). If needed interviews with relatives where done. All the participant gave their informed consent for participation and release of medical records (Lagergren et al., 2004).
Instruments
The variables used for this study are questions from the SNAC-B study suitable to the definition of physical frailty (Fried et al., 2001) and the screening tool MADRS to determine depressive symptoms (Montgomery & Åsberg, 1979).
The participants where asked 3 questions and did 2 examinations that composed the physical frailty variable. The questions were;
1. If they had during the last 12 months been doing regular exercising with easier exercises? The answers for the question were; never, once a month, twice a month, many times a week or every day. If older adults had more than 4 hours a day sitting down or only took a short walk once a month they were considered to have a low activity level (Fried et al., 2001). Therefore those who answered never or once a month were classified as having a low activity level.
2. If they feel tired and sleep more than two hours a day in the daytime? The answers for the question were; yes or no. If the participants answered yes they were classified as having self-reported exhaustion (Fried et al., 2001).
3. If they had lost weight during the last 3 months? The answers for the question were; yes more than 3kg, do not know, yes more than 1kg but less than 3kg or no, no weight loss. If older adults had lost more than 4,5kg in the last year they are considered with weight loss (Fried et al., 2001). Thus, those who answered yes more than 3kg or yes more than 1kg but less than 3kg were classified as having weight loss.
The examinations were;
4. The time measured in seconds it took for the participants to walk 6 meters. If it took more than 9 second for the participants to walk 6 meters they were classified having slow walking speed (Fried et al., 2001).
5. The grip strength of the right hand, measured in Newton. Men and woman have different threshold value for grip strength, for men it is 30kg or less and for women 18kg or less (Fried et al., 2001). Recalculated from kg to Newton (1kg = 9,80665 Newton) the limit for men is 294N and for women 177N. If the participants had less
grip strength than their gender predetermined limit they were classified as having muscle weakness (Fried et al., 2001).
One point was scored for each of the above criterion met and participants meeting 3,4 or 5 of the criteria were defined as having physical frailty (Fried et al., 2001).
The instrument used to determine depressive symptoms was the screening system MADRS. The instrument has been developed specially to show changes in the state of depression symptoms. MADRS has good reability and an acceptable level of agreement between the estimates made by patients and clinics (Montgomery & Åsberg, 1979 & SBU, 2012). Total score on the test was set to 60 points with different point ranges to determining different types of depressive symptoms according to swedish norms. No depression 0-6 points, mild depression 7-19 points, moderate depression 20-34 points and severe depression 34-60 points (Svanborg & Åsberg, 1994). With a total score between 7-60 points the test indicated some kind of depressive symptoms.
Demographic factors used for comparison in the analysis were gender, education and age. The education variable used was if the participants had finished primary school or secondary school. To compare differences in different ages the participants were divided into four age groups, 60-69 years old, 70-79 years old, 80-89 years old and 90+ years old.
Data analysis
The processing of the material in this study was done in two parts, a descriptive part and an analyzing part. The descriptive part describes the data with tables and numerical measures to make it easier to understand the distribution of the participants. In the descriptive part all the participants from the 2007-2010 follow up and new baseline have been included (n=1119). The analysis part describes if there is an association between the variables, and the level of significance. The significance level is the probability that a trial reject the null hypothesis if it is true (Bring & Taube, 2008). The hypothesis is an assertion about the truth unlike the null hypothesis which is formulated so there does not exist any difference (Björndal & Hofoss, 1998). In the analysis part the p-value shows the possibility if the null hypothesis can be rejected. The larger difference between the result and the null hypothesis the lower p-value (Lantz, 2009). If the level of significance is higher than the p-value the null hypothesis can be
rejected and the result will be considered statistically significant. For medical and nursing research the standard p-value is considered 0.05 (Ejlertsson, 2012).
Pearson Chi-Square test was used to see if there was an association between physical frailty and depressive symptoms among older adults. The test was also used too see if there was a difference between gender, age groups and education. The hypothesis was set up from the purpose of this study which was to see if older adults suffering from physical frailty also had depressive syndroms. The test was used to see if the hypothesis where correct or should be rejected in this study since the total number of individuals for analyzing the result were more than 30 and no expected frequency of the variables were less than 5. This test does not show how big the correlation or association is, if there is one, just that it exists. (Ejlertsson, 2012). Statistical analyses were carried out using the statistic program SPSS-Statistical for Windows 22.0.
Ethical considerations
To be able to take part of the database SNAC-Blekinge as a scientist it requires a special completed form that has to be approved by SNAC-Blekinge (Lagergren, 2005). The reason is to avoid that individuals integrity is violated. All the participants in the SNAC study has given their informed content to registration of the collected material. Every participant is informed of what the study is for and can leave whenever they feel to do so. The material is dealt with confidential and all the data is described on a group level. Because of this it is not possible to identify individuals in the results (Lagergren et al., 2004). The ethical committee of Lund has ethically tested and accepted the SNAC-study (LU 605-00 and LU 744-00).
Results
The participants in the study were 1119 individuals of whom 623 (55.7%) were female and 496 (44.3%) were male. In the different age groups there were 388 (34.7%) 60-69 years old, 311 (27.8%) 70-79 years old, 259 (23.1%) 80-89 years old and 161 (14.4%) 90+ years old. Of the participants (n=1119) 601 (53.7%) had finished primary school and 448 (40.0%) had finished secondary school and 70 (6.3%) had missing data in the education variable.
Physical frailty
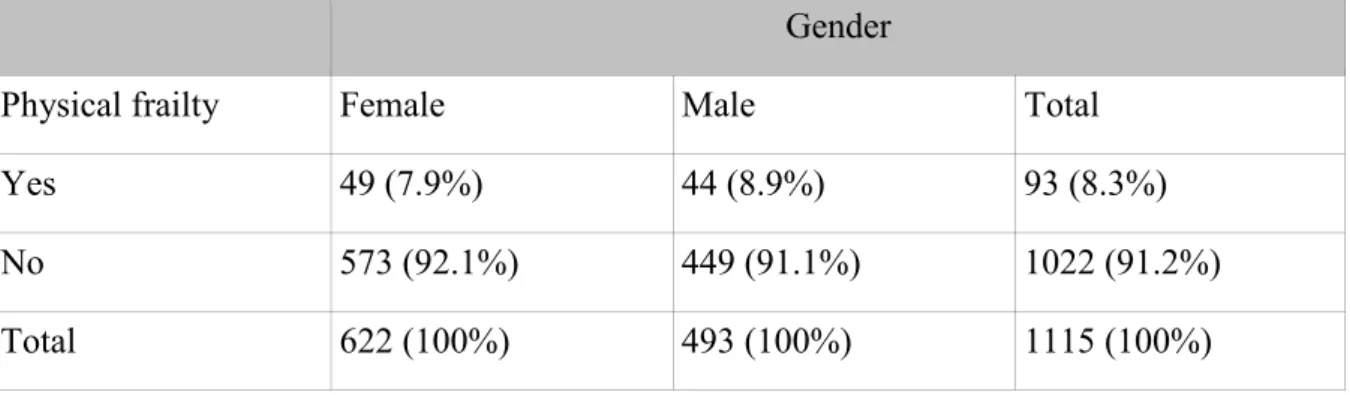
Totally 93 (8.3%) among the participants met the criteria for physical frailty according to the definition that was used. The participants scored one point for each criterion met of the 5 variables that defined physical frailty and the results showed that 178 (15.9%) scored 0 points, 516 (46.1%) scored 1 point, 328 (29.3%) scored 2 points, 74 (6.6%) scored 3 points, 19 (1.7%) scored 4 points and 4 (0.4%) had no data on the physical frailty index . Meeting 3, 4 or 5 criteria’s and scoring 3-5 points categorized the individuals that had physical frailty. Of the individuals (n=93) that had physical frailty, 49 (52.7%) were female and 44 (47.3%) male. Looking at the whole group of male (n= 494), 44 (8.9%) had physical frailty and in the whole group of female (n=622), 49 (7.9%) had physical frailty. Table 1 shows how physical frailty is divided among gender.
The loss from each criterion of defining physical frailty were the following, 199 (17.8%) if they had during the last 12 months been doing regular exercising with easier exercises, 92 (8.25%) if they feel tired and sleep more than two hours a day in the daytime, 8 (0.7%) if they had lost weight during the last 3 months, 306 (27.3%) the time measured in seconds it took for the participants to walk 6 meters, 308 (27.5%) the grip strength of the right hand, measured in Newton.
Table 1. Frequency table showing having physical frailty or not for older adults related to
gender (SNAC-B). (n=1115).
Gender
Physical frailty Female Male Total
Yes 49 (7.9%) 44 (8.9%) 93 (8.3%)
No 573 (92.1%) 449 (91.1%) 1022 (91.2%)
Total 622 (100%) 493 (100%) 1115 (100%)
The results showed that of all the individuals having physical frailty (n=93), 20 (21.5%) were in the age between 60-69 years, 22 (23.7%) in the age 70-79 years, 39 (41.9%) in the age 80-89 years and 12 (12.9%) in the age 90+. Table 2 shows how having physical frailty or not is divided in the different age groups.
Table 2. Frequency table showing older adults having physical frailty or not related to age
(SNAC-B). (n=1115).
Age groups Physical
frailty
60-69 years 70-79 years 80-89 years 90+ years Total
Yes 20 (5.2%) 22 (7.1%) 39 (15.1) 12 (7.5%) 93 (8.3%) No 366 (94.8%) 289 (92.9%) 219 (84.9%) 148 (92.5%) 1022 (91.2%) Total 386 (100%) 311 (100%) 358 (100%) 160 (100%) 1115 (100%)
The results showed that of all the individuals having physical frailty (n=93), 64 (68.8%) had finished primary school and 26 (28.0%) had finished secondary school, 3 (3.2%) had missing data.
Table 3. Frequency table showing older adults having physical frailty or not related to level
of education (SNAC-B). (n=1115).
Education
Physical frailty Primary school Secondary school Missing Total
Yes 64 (10.7%) 26 (5.8%) 3 (4.4%) 93 (8.3%)
No 536 (89.3%) 421 (94.2%) 65 (95.6%) 1022 (91.2%) Total 600 (100%) 447 (100%) 68 (100%) 1115 (100%)
Depressive symptoms
The results showed that of all the individuals (n=1119) 230 (20.6%) had depressive
symptoms and 832 (74.4%) no signs of depressive symptoms at all, according to the MADRS screening tool. Totally 57 (5.1%) had missing data since they had not completed the MADRS questionnaire.
Of the individuals that had depressive symptoms (n=230), 134 (58.3%) were female and 96 (41.7%) male. 74 (32.2%) were in the age 60-69 years, 50 (21.7%) in the age 70-79 years, 62 (27.0%) in the age 80-89 years and 44 (19.1%) in the age 90+ years. Totally 126 (54.8%) had
finished primary school, 86 (37.4%) also finished secondary school and 18 (7.8%) had missing data.
Physical frailty in association to depressive symptoms
Chi-Square test showed a statistical significance (p=0.011) between having physical frailty and depressive symptoms thus the null hypothesis could be rejected. Of those who had physical frailty (n=90), 29 (32.2%) had some kind of depressive symptoms and 61 (67.8%) had no depressive symptoms. The internal drop-out rate was 58 individuals due to either no data on the MADRS rating scale or the physical frailty classification. n=1061.
Table 4. Frequency table showing having physical frailty or not for older adults related to
having depressive symptoms or not (SNAC-B). n=1061.
Physical frailty p-value
Depressive symptoms Yes No 0.011
Yes 29 (32.2%) 201 (20.7%)
No 61 (67.8%) 770 (79.3%)
Total 90 (100%) 971 (100%)
The results showed that of the individuals having both physical frailty and depressive
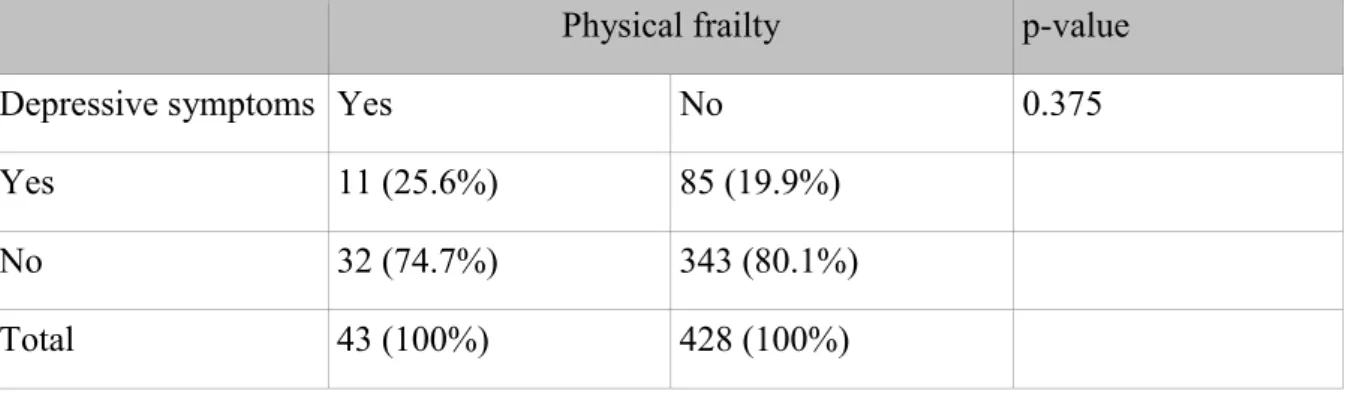
symptoms (n=29), 18 (62.1%) were female and 11 (37.1%) male. In the group of female that had physical frailty (n=47), 18 (38.3%) also had some type of depressive symptoms. Of the male older adults that had physical frailty (n=43), 11 (25.6%) suffered from some type of depressive symptoms.
Table 5. Frequency table showing older female adults having physical frailty or not related to
depressive symptoms or not (SNAC-B). (n= 590).
Physical frailty p-value
Depressive symptoms Yes No 0.008
Yes 18 (38.3%) 116 (21.4%)
No 29 (61.7%) 427 (78.6%)
The p-value from the Chi-Square test showed 0.008 and the null hypothesis could be rejected and there was an association between women having physical frailty and depressive
symptoms.
Table 6. Frequency table showing older male adults having physical frailty or not related to
depressive symptoms or not (SNAC-B). (n=471).
Physical frailty p-value
Depressive symptoms Yes No 0.375
Yes 11 (25.6%) 85 (19.9%)
No 32 (74.7%) 343 (80.1%)
Total 43 (100%) 428 (100%)
The p-value from the chi-Square test showed 0.375 resulting in the null hypothesis could not be rejected and there were no association between men having physical frailty and depressive symptoms.
Chi-square test of female with physical frailty suffering from depressive symptoms showed a statistically significance (p=0.008), wich was greater than the statistically significance of men with physical frailty suffering from depressive symptom (p=0.375).
Among the older adults that only finished primary school (n=570) 23 (4.0%) of them had physical frailty and depressive symptoms, showing a statistically significance of p=0.002. Among the older adults that also finished secondary school (n=439) 5 (1.1%) of them had physical frailty and depressive symptoms, showing a statistically significance of p=0.962. There was a disappearance of 58 from the total group (n=1061) and 1 of them had physical frailty and depressive symptoms. The statistical significance showed on an association between having physical frailty and depressive symptoms and only finished primary school. There was no statistical significance between having physical frailty and depressive
Table 7. Frequency table showing the different age groups having physical frailty and
depressive symptoms or not (SNAC-B). (n=1061).
Physical frailty and depressive symptoms
Age Yes No Total p-value
60-69 years 6 (1.6%) 372 (98.4%) 378 (100%) 0.176 70-79 years 8 (2.6%) 299 (97.4%) 307 (100%) 0.05 80-89 years 12 (5.0%) 227 (95.0%) 239 (100%) 0.387 90+ years 3 (2.2%) 134 (97.8%) 137 (100%) 0.580 Total 29 (2.7%) 1032 (97.3%) 1061 (100%)
Discussion
Method discussion
The data for this study was taken from the existing, previously collected information from the SNAC-B study 2007-2010 follow-up with the strength that the study is based on a large number of individuals and has multiple different variables examined. SNAC has selected municipalities in Sweden where the older people should be represented of the number of older adults in the whole country. The purpose of SNAC-B is that the result will represent the Swedish elderly population in terms of age and gender (Lagergren et al., 2004). SNAC-B lacks information about older people living in large cities which could be a weakness in this study, however there is no reason to not generalize the findings to the general population of older adults.
A quantitative research method was chosen for this study since the purpose was to see if older people suffering from physical frailty had more depressive symptoms. Thus, the quantitative research method was chosen because of the large data sample and that the material is based on surveys and examinations. With a quantitative research method the empirical and quantifiable data is collected and summarized in a statistical form, then analyzed by the hypotheses, with the variables well defined and limited (Ejlertsson, 2012).
A total of 1119 individuals aged 66-102 years old participated in the SNAC-B 2007-2010 follow up and new baseline study with interviews, medical examinations and questionnaires. The majority of research examinations were done in the research centre. For those who could not get to the research centre the examination was performed in their home. Examinations that could be carried out in the home lead to those who were unable to get to the research center still participate in the study. This makes the results more representative for the population of older adults in general. Reason why the participants could not attend the research center is not analyzed in the present study. However, every participant normally requires approximately 4 hours to complete the survey and the relatively long time it takes may be one reason that individuals choose to refrain from attending or participating, also the distance to the research center can be an obstacle (Lagergren et al., 2004). Probably this has led to an underestimation of frailty since more immobilized individuals could not perform the examination. Also grip strength and walking speed were not registered at home visits,
resulting in underestimation of these individuals frailty index.
Older adults tend to have more biological, social and psychological changes, therefore the follow up for the participants in the age cohorts from 80 years and older, halved from a six years intervals to a three years interval. For the first survey of SNAC-B in 2001-2003 the number of participants was 1402 and in the follow up 2007-2010 the number was down to 838 with a new group of 281, 60 and 81 years old taking part. The loss may have been selective which mean that the sickest were no longer included in the study. A selective loss can cause a selection bias meaning that part of the population is under- or overrepresented and the population become less representative (Björk, 2011). It then becomes more difficult to generalize the result against the Swedish population and the result might not be
generalizable for the sickest proportion of the older adults. However in the SNAC-B study every age cohort is well represented (Lagergren et al., 2004).
In the study the physical frailty and depressive symptoms is examined among older adults in Blekinge. The term physial frailty is defined by Fried (Fried et al., 2001) and the variables have been chosen from his definition. The clear criteria are easy to apply and offer a basis for screening of physical frailty and risk of physical frailty in elderly people (Fried et al., 2001). It differs from other methods of screening physical frailty that are based on clinician
(Rockwood et al., 2005) the present studies result could have been different if another definition of physical frailty had been chosen.
The different variables were chosen in order to meet the Fried et al. (2001) criteria of defining physical frailty. Since they were taken from already collected data from SNAC-B, they were customized based on the question that exists. The unexplained weight loss was defined by Fried et al. (2001) to be the loss of 4,5kg in the last 12 months. The question suitable were if they had lost weight the last 3 months and the answers, more than 3kg and yes more than 1 kg but less than 3 kg were classified as having physical frailty. But the people answering yes more than 1 kg but less than 3 kg might only have lost 4 in total the last year and should therefore not be classified as having physical frailty (Fried et al., 2001). The individuals muscle weakness were measured by the grip strength in their right hand since 70-90 percent of the total population in the world are right handed and only 5-30 percent are left handed or both handed (Holder, 1997). Considering this some of the individuals having weak grip strength might have been left-handed and therefor did not reach the predetermined limit and were classified as having muscle weakness when in fact they did not.
The internal drop-out in this study has been reported for at each table, with a low loss the reliability increases and enhances the quality of the research. The risk with a higher number of internal drop-out is that those who do not participate or answer the questions have other characteristics than those who do participate (Eliasson, 2006). When screening for physical frailty among all the participants of the SNAC-B 2007-2010 follow up and new baseline study (n=1119) the loss was 4 (0.4 %). Of the participants not all of them had done all of the examinations or answered all the questions that was required to be defined as having physical frailty. The reason for that could be shortage of time during examination or that the
examination was conducted in the home and there was no access to the equipment needed. The internal drop out from each criterion of defining physical frailty could, besides slow walking speed and grip strength, all together seem small and the consequences probably are underestimation of physical frailty, thus, the study presents a lower limit of the physical frailty prevalence.
Result discussion
The purpose of the study was to examine if there was an association between physical frailty and depressive symptoms. When testing the hypothesis it showed statistically significance with a correlation between physical frailty and depressive symptoms in terms of these two. Therefor the null hypothesis could be rejected.
To be defined as having physical frailty the person needed to score a total of 3-5 points of the criterion defining physical frailty (Fried et al., 2001). For every criterion there was an
individual loss and even if the person had not completed all of the examinations the total score was still counted for. Meaning that it was possible the persons scoring 0-2 points had 1 or more of the examinations missing. 328 (29.3%) scored 2 points and 516 (46.1%) scored 1 point. The loss could have been the individuals who was not able to get to the research center because of different reasons and if they would have completed all the examinations needed their total score could have been different. If all the people would have done all the
examinations more persons could have been included in the analyzing part and the study could have had larger generalizability. The people scoring 1-2 points on the physical frailty scale are at bigger risk of getting physical frailty with more adverse outcomes since they are in a pre-physical frailty stage and it is difficult to dispose of the symptoms (Fried et al, 2001). The results showed a statistically significance between women that had physical frailty and depressive symptoms but not between men that had physical frailty and depressive
symptoms. Of the people having physical frailty and depressive symptoms 62.1% were women and 37.1% men. The difference may be because men usually die before women because of biological aging (Socialstyrelsen, 2011) or because not as many men as women wanted to participate in the SNAC-B study. Woman is expected to live longer than men and they spend more years with pre-physical frailty and physical frailty (Romera-Ortuno,
Fouweather & Jagger, 2013). An earlier study shows that women spend a larger proportion of their life expectancy with disability (Van Oyen et al., 2013). Woman may be at greater risk of getting physical frailty due to they start with less muscle mass and strength compared to men and therefor with aging, losing muscle mass woman are more likely to have some criteria for physical frailty. Why woman have a greater risk of getting physical frailty might also be because inadequate nutritional intake due to living alone more often than men (Evans, 1995).
The results showed on an association between frailty, depressive symptoms and only having finished primary school. A person with less education experiences their health as poorer and suffers from more illness both mental and physical then those with a higher level of education (Socialstyrelsen, 2013). All the greatest causes of death such as heart disease, stroke, and cancer are more common among those with less education. Physical frailty is an indication of co-morbidity and becoming ill (Fried et al., 2001). So therefor having less education can more likely lead to physical frailty and depressive symptoms with an adverse outcome such as hospitalization or death.
The majority of the people suffering from physical frailty and depressive symptoms were in the age 70-89 years old. The youngest age group and the oldest had the lowest rating of physical frailty and depressive symptoms. The youngest because physical frailty appears with older age so therefor the appearance was not so common (Fried et al., 2001). It might be less physical frailty among the oldest participant because they could not make their way to the research center and therefor did not do all the examinations included in the screening for physical frailty. The oldest participants are also a selection of the strongest since they past the limit for life expectancy (Scb, 2014) and therefor it can be that the physical frailty was not so common among the participants in the age 90+. The aging process is individual and together with heredity, inactivity and diet it may have affected the results of the study. Also the biological aging is an individual process because all people do not have the same psychological prospects of aging (Berg, 2007).
In order to better understand the effects of aging it is important to know what can lead to physical frailty. One of many assignments for a nurse is to promote health and prevent diseases. Therefor it is important to work from a health care perspective and have knowledge about factors that may increase the risk of older adults suffering from illness or bad health (Eriksson, 1993).
The results can be of importance since it is essential for the nurse to have knowledge on older adults different ability to function and be able to meet the patients depending on their
individual needs. The patient need to be in focus when it comes to the care therefor it is important to work with person-centered nursing. It is of importance for the nurse to have an understanding of what the patients’ values in life and how the individual understand what is happening (Leksell & Lepp, 2013). It is also included for the nurse to identify and help
prevent different health risks (Socialstyrelsen, 2005). To be able to do that it is of importance to remember that every individual has his or her own experience of health and what it is (Eriksson, 1993).
Conclusions
The study showed that there is an association in older adults between having physical frailty and depressive symptoms. Age also contributes to the condition and the risk is higher for women than for men to get physical frailty and depressive symptoms. Physical frailty can be linked to reduced quality of life and therefor it is important to understand the causes behind it and connections to depressive symptoms since it is a common state among older adults. The life expectancy has increased in Sweden but that does not mean the older adults are healthier. To be able to support the older adults in the meeting it needs more research on physical frailty and depressive symptoms. In identifying physical frailty the nurse can support the patient in their self-care and help with programs for individual care of importance for their autonomy.
References
Berg, S. (2007). Åldrandet – Individ, familj, samhälle. Stockholm: Liber.
Björndal, A. & Hofoss, D. (1998). Statistik för hälso- och sjukvårdspersonal. Stockholm: universitetsförlaget.
Bring, J. & Taube, A. (2008). Introduktion till medicinsk statistik. Lund: studentlitteratur. Collard, R M., Boter, H., Schoevers, R A. & Oude Voshaar, R C. (2012). Prevalence of frailty in community-dwelling older persons: a systematic review. Journal of the American
Geriatrics Society, 60, 1487-1492.
Dehlin, O., & Rundgren, Å. (2007) Geriatrik. Lund: Studentlitteratur.
Eeles, E M., White, S V., O´Mahony, S M., Bayer, A J., & Hubbard, R E. (2012). The impact of frailty and delirium on mortality in older inpatients. Age Ageing, 41, 412-416.
Ejlertsson, G. (2012). Statistik för hälsovetenskaperna. Lund: studentlitteratur. Eriksson, K. (1993). Hälsans idé. Stockholm: Liber.
Evans, WJ. (1995). Exercise, nutrition and aging. Clinics in Geriatric Medicine, 11, 725–734. Fagerström, C. & Hellström, A. (2011). Sleep complaints and association with comorbidity and health-related quality of life in an older population in Sweden. Aging and Mental Health,
15, 204-213.
Fagerström, C., Persson, H., Holst, G. & Hallberg, I.R. (2008). Determinates of feeling hindered by health problems in daily living at 60 years and above. Scandinavian Journal of
Caring Sciences, 22 (3), 410-421.
Fried, LP., Tangen, CM., Walston, J., Newman, AB., Hirsch, CH., Gottdiener, J., Seeman, T., Tracey, R., Kop, W., Burke, G. & Mcburnie, M A. (2001). Frailty in older adults: evidence for a phenotype. Journals of Gerontology Series A- Biological Sciences & Medical Sciences,
56(3), 146-156.
Gillick, M. (2001). Pinning down frailty. Journals of Gerontology Series A-Biological
Sciences & Medical Sciences, 56(3), 134-135.
Holder, M K. (1997). Why are more people right-handed? Hämtad från: http://www.scientificamerican.com/article/why-are-more-people-right/ 141210.
Lagergren, M. (2005). SNAC-studien: Övergripande om SNAC-studien. (Elektronisk). SNAC - The Swedish National Study on Aging and Care. Hämtad från: www.snac.org 141108.
Lagergren, M., Fratiglioni, L., Rahm-Hallberg, I., Berglund, J., Elmståhl, S., Hagberg, B., Holst, G., Rennemark, M., Sjölund, B-M., Thorslund, M., Wiberg, I., Winblad, B. & Wimo, A. (2004). A longitidunal study integrating population, care and social services data. The Swedish National study on Aging and Care (SNAC). Aging Clinical and Experimental
Research, 16(2), 158-168.
Leksell, J. & Lepp, M. (2013). Sjuksköterskans kärnkompetenser. Stockholm: Liber. Kaufman, S. (1994) The social construction of frailty: an anthropological perspective.
Journal of Aging Studies, 8(1), 45-58.
Montgomery, S. & Åsberg, M. (1979). A New Depression Scale Designed to be Sensitive to Change. Brittish Journal of Psychial Health, 134, 382-389.
Persson, G., Boström, G., Allebeck, P., Andersson, L., Berg, S., Johansson, L. & Thille, A. (2001). Elderly people’s health – 65 and after. Scandinavian Journal of Public Health, 29, 117-131.
Rockwood, K., Howlett, SE., MacKnight, C., Beattie, B L., Bergman, H., Hebert, R., Hogan, D B., Wolfson, C. & McDowel, I. (2004). Prevalence, attributes, and outcomes of fitness and frailty in community-dwelling older adults: report from the Canadian study of health and aging. Journals of Gerontology Series A-Biological Sciences & Medical Sciences, 59, 1310-1317.
Rockwood, K. & Hubbard, R. (2004). Frailty and the geritrician. Age Ageing, 33, 429-430. Rockwood, K., Xiaowei, S., MacKnight, C., Bergman, H., Hogan, D B., McDowell, I. & Mitnitski, A. (2005). A global clinical measure of fitness and frailty in elderly people.
Canadian Medical Association Journal, 173 (5). 489-495.
Romero-Ortuno, R., Fouweather, T. & Jagger, C. (2014). Cross-national disparities in sex
differences in life expectancy with and without frailty. Age and Ageing, 43, 222–228.
SBU, (2012). Diagnostik och uppföljning av förstämningssyndrom. En systematisk
litteraturöversikt. Stockholm: Statens beredning för medicinsk utvärdering, Swedish Council on Health Technology Assessment.
Sociala rådet 2010. Multipla hälsoproblem bland personer över 60 år: en systematisk
litteraturöversikt om förekomst, konsekvenser och vård. En rapport. Stockholm: Fritze.
Socialstyrelsen. (2005). Kompetensbeskrivning för legitimerad sjuksköterska. Hämtad från:
http://www.socialstyrelsen.se/Lists/Artikelkatalog/Attachments/9879/2005-105-1_20051052.pdf 141204.
Socialstyrelsen. (2009). Folkhälsorapport 2009. Stockholm: Socialstyrelsen. Socialstyrelsen. (2011). Dödsorsaker 2010, Causes of Death 2010. Stockholm: Socialstyrelsen.
Socialstyrelsen & Statens folkhälsoinstitut. (2013). Folkhälsan i Sverige. Årsrapport 2013. Stockholm: socialstyrelsen.
Statistic Sweden (SCB), enheten för befolkningsstatistik. (2014). Medellivslängd 2013. Mäns
medellivslängd för första gången över 80 år. Hämtad från:
http://www.scb.se/sv_/Hitta-statistik/Artiklar/Mans-medellivslangd-for-forsta-gangen-over-80-ar/141210.
Svanborg, P. & Åsberg, M. (1994). A new self-rating scale for depression and anxiety based on the comprehensive psychopathological rating scale. ACTA Psychiatrica Scandinavica, 89, 21-28.
Van Oyen, H., Nusselder, W., Jagger, C., Kolip, P., Cambois, E. & Robine, JM. (2013). Gender differences in healthy life years within the EU: an exploration of the“health-survival”paradox. International Journal of Public Health, 58, 143–55.