Typhoon Maemi and impacts on Lower Nakdong River, South Korea
8
0
0
Full text
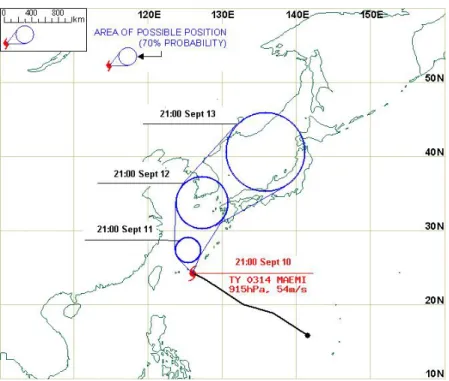
(2) Ji and Julien. Figure 1. Passage of Typhoon Maemi (Typhoon Research Center, TRC). Figure 2. Area of possible position on the passage of Typhoon Maemi (Korea Meteorological Administration, KMA). 104.
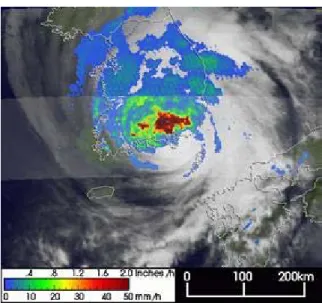
(3) Typhoon Maemi and Impacts on Lower Nakdong River, South Korea. Table 1. Comparisons of the major typhoons in South Korea (KMA) Maximum Sustained Winds(m/s) Lowest Pressure (hPa). Sarah 1959 (9/15/1929). Thelma 1987 (7/15/1987). Rusa 2002 (8/30/2002). Maemi 2003 (9/12/2003). 52.7(Pusan). 40.3(Yeosu). 39.7(Yeosu). 60(Jeju). 952(Pusan). 972(Yeosu). 970(Yeosu). 954(Tongyoung). The satellite view of Tropical Rainfall Measuring Mission (TRMM) which is a joint mission between NASA and the Japanese space agency NASDA provided valuable images of Typhoon Maemi. It formed as a minimal typhoon of the Philippines to a super typhoon with winds over 155 mph as it was approaching the southern Ryuku Islands. Figures 3 and 4 are the images of the satellite which monitored Maemi on the southeast coast of South Korea.. 2. Rainfall and Floods Figure 3 taken at 12:24 UTC on 12 September 2003 is the condition of Maemi just after it made landfall near Pusan on the Korean peninsula. Significantly heavy rainfall ranged from the north of the center with a large area of greater than 2 inch per hour rates and it was classified as a Category 2 typhoon of the Saffir-Simpson Scale with winds of 105 mph at this time. The Saffir-Simpson Scale (Table 2) is the scale for dividing hurricanes to 5 categories by the magnitude of destruction in United States. Considering the maximum sustained wind, Typhoon Maemi ranges to Category 4.. Figure 3. Rainfall distribution of Typhoon Maemi on the Korean peninsular (9/12/2003). 105.
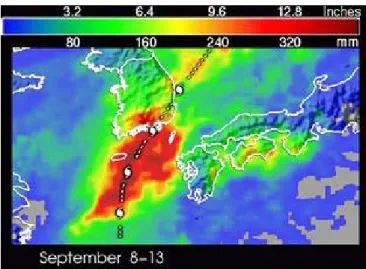
(4) Ji and Julien. Table 2. Saffir-Simpson Scale Scale No.. Central Pressure. Winds. Surge. Damage. 1. >28.94" (980 mb). 74-95 mph (119-153 km/hr). 4-5 ft (1.2-1.7 m). Minimal. 2. 28.91-28.50" (979-965 mb). 96-110 mph (154-177 km/hr). 6-8 ft (1.8-2.6 m). Moderate. 3. 28.47-27.91" (964-945 mb). 111-130 mph (178-209 km/hr). 9-12 ft (2.7-3.9 m). Extensive. 4. 27.88-27.17" (944-920 mb). 131-155 mph (210-249 km/hr). 13-18 ft (4-5.5 m). Extreme. Super Typhoon 5. >150 mph (241 km/hr) <27.17" (920 mb). >155 mph (249 km/hr). Catastrophic >18 ft (5.5 m). Catastrophic. Figure 4 shows the total amount of rainfall which is near-real time Multisatellite Precipitation Analysis (MPA) at the NASA Goddard Space Flight Center for the period 8-13 September 2003. The southern coast of Korea received upwards of 12 inches of rainfall and all of the rest of South Korea received over 4 inches. Tropical cyclone symbols mark the positions of Meami every 6 hours.. Figure 4. Total rainfall of Typhoon Maemi from 9/8/2003 to 9/13/2003. For the analysis focused on the Lower Nakdong River located in the area of the southeastern Korea near Pusan city, the precipitation data from Yangsan. 106.
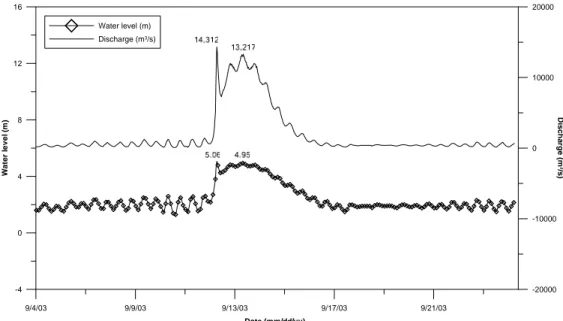
(5) Typhoon Maemi and Impacts on Lower Nakdong River, South Korea. gauging station, and the water level and discharge data from Gupo bridge which was damaged by Typhoon Maemi were used. 160. 130 mm. Rainfall (mm). 120. 114 mm. 80. Sept 19 10:00. 40 Sept 12 12:00. 0 9/10/03. 9/15/03. 9/19/03. 9/23/03. 9/27/03. Date (mm/dd/yy). Figure 5. Mass rainfall curve at Yangsan gauging station (Source: Korea Water Resources Corporation, KOWACO). 16. 20000 Water level (m) Discharge (m3/s). 12. 8. 0. 4. Discharge (m3/s). Water level (m). 10000. -10000 0. -4. -20000 9/4/03. 9/9/03. 9/13/03. 9/17/03. 9/21/03. Date (mm/dd/yy). Figure 6. A water stage and discharge graph at Gupo bridge (Source: KOWAKO). The Nakdong River has a basin area of 23,326 km2 and the estuary barrage is lacated at the end of the river to reduce salt-water intrusion in the estuary and. 107.
(6) Ji and Julien. prevent a large flood due to high tides. The channel of Nakdong River was designed to convey a design flood of 18,300 cubic meters per second. Figure 5 show the mass rainfall curve at the Yangsan station and Figure 6 is the water level hydrograph during the passage of Typhoon Maemi with discharge data. During Typhoon Maemi, the water level significantly exceeded normal levels due to the strong westerly winds. The water level recorded at Gupo bridge reached maximum 5.06m on September 12, and the discharge of the Nakdong River peaked on September 14 at a value around 13,000 cubic meters per second. That is, the flood level exceeded the warning stage of 4m and the stage of 5 m corresponds to 70% of the project flood for the Nakdong River.. 3. Flood Damages According to the Korean research note, about 18,000 buildings were either destroyed or damaged by the strong winds (of up to 120 mph, or close to 200 km/h) and more than 110 people were killed in Korea by the impact of Typhoon Maemi. The typhoon also inflicted damages on heavy-duty shipping cranes and caused power outages for 1.5 million households. According to historical wind database figures (1950-2003), Typhoon Maemi made landfall from the southwest just like 60 percent of all previously recorded typhoons. At that moment, its sustained wind speed indicated a category 2 storm - the same level as Typhoon Sara in 1959. Both typhoons hit the southern city of Pusan and its surroundings.. Figure 7. Flood damages of Pusan of left, [AP] and Wah Yeon Beach on Geoje Island of right, [photo by Paul J. Riley]. In Figure 7, the left is the aerial view which shows a flooded rice field area after Typhoon Maemi hit Pusan on Saturday, Sept. 13, 2003 and the right shows the flood damages of Wah Yeon Beach on Geoje Island taken on Sept. 15. Figure 8 shows another damage that the ferry-shaped hotel is toppled over sideway after Typhoon Maemi hit Pusan Port, Pusan, Saturday, Sept. 13, 2003.. 108.
(7) Typhoon Maemi and Impacts on Lower Nakdong River, South Korea. Figure 8. Damages of ferry-shaped hotel after Typhoon Maemi hit Pusan Port [AP]. One of the typical damage is the bridge collapse and it is shown in Figure 9. At this time, September 14, the 1.06 km-long Gupo bridge partially collapsed with the loss of 19th pier. It was due to high velocities in the river and bridge scour around the piers. The discharge of the Nakdong River peaked on September 14 at a value around 13,000 cubic meters per second.. Figure 9. Gupo bridge failure after Typhoon Maemi [Yonhap]. 4. Summary and Conclusions The Typhoon Maemi caused extensive damage including a bridge failure on the Nakdong River of South Korea. The data and information examined include satellite maps, rainfall intensity patterns, wind speed, etc. Typhoon Maemi caused extensive damage over the large area with extremely flash hydrograph of over 400mm of local precipitation and a severe storm surge. The water level recorded at Gupo bridge in Lower Nakdong River reached maximum 5.06m on September 12, and the discharge of the Nakdong River peaked on September 14 at a value around 13,000 cubic meters per second. Around 18,000 buildings were either destroyed or damaged by the strong winds and more than 110 people were killed in Korea. Gupo bridge on the Lower Nakdong River partially collapsed with the loss of 19th pier due to high velocities in the river and bridge pier scour. It is important ensure flood. 109.
(8) Ji and Julien. conveyance capability during floods and limit possible bed elevation changes. These conditions affect the stability of the bridges located near the Nakdong River Estuary Barrage.. Reference website Korea Meteorological Administration (KMA), http://www.kma.go.kr Korea Water Resources Corporation (KOWACO), http://www.kowaco.or.kr Typhoon Research Center (TRC), http://www.typhoon.or.kr. 110.
(9)
Figure
+3
![Figure 7. Flood damages of Pusan of left, [AP] and Wah Yeon Beach on Geoje Island of right, [photo by Paul J](https://thumb-eu.123doks.com/thumbv2/5dokorg/4341014.98763/6.918.187.745.651.841/figure-flood-damages-pusan-yeon-beach-geoje-island.webp)
![Figure 8. Damages of ferry-shaped hotel after Typhoon Maemi hit Pusan Port [AP]](https://thumb-eu.123doks.com/thumbv2/5dokorg/4341014.98763/7.918.185.747.170.352/figure-damages-ferry-shaped-hotel-typhoon-maemi-pusan.webp)
Related documents
Resultatet visade att återhämtning till viss del sker på arbetsplatsen, där trivsel och socialt stöd var två komponenter av betydelse!. Studien bidrar med en större förståelse
A Free Trade Agreement (FTA) between the European Union (EU) and the Republic of Korea (hereafter referred as South Korea) has been under negotiation for several years. Discussions
“The Jeonju Int'l Sori Festival is an international music festival that showcases various traditional music from the world and present Korean traditional music including Pansori
Under resultatdiskussionen diskuterar vi elevernas tillit till de vuxna i skolan, elevernas trygghet i skolans gemensamma utrymmen, vikten av att inkludera elever i
The effects of social cleavage structures on party support patterns in Japan, South Korea and the United Kingdom was measured in two different ways.. Firstly, a simple
For example, one study in Caucasian youth reported that G allele carriers who experienced high levels of social stress showed higher levels of antisocial behavior, whereas in
The chastity of women, lack of sexual education, illegalization of abortion, lack of information about welfare support available and a long history of international adoption
literature study, not a lot of research has been published concerning guidance for SMEs on how to conduct culture-related design studies effectively, what the preferences of
