Title: The accuracy of tibial nutrient foramen vs. midshaft measurement location for sex determination
Authors: Ashley Dafoe1,2, David Hunt1
Affiliations: 1National Museum of Natural History, Smithsonian Institution, 2University of Wyoming
Introduction
The use of the human postcranial skeleton for sex determination has been under ongoing review and re-assessments to increase the accuracy of these methods. For many years,
morphological traits of the pelvis were considered the best indicators of sex followed by cranial morphology (Christensen et al., 2014). However, as the field of forensic anthropology continues to grow, researchers have begun searching for new ways to sex the human skeleton when the skull and pelvis are highly fragmented, incomplete, or missing.
To understand the statistical utility of both nutrient foramen and midshaft based
measurements on the tibia, this research proposed two questions. First, is intra-person variation in the location nutrient foramen great enough to cause significant mismatching of tibias when discriminant analyses of left tibiae are applied to right tibiae? Second, in light of changes in the Forensic Databank tibial measurements (Langley et al., 2016, Moore-Jansen and Jantz, 1990), is there an advantage to using measurements collected at the midshaft in addition to, or in place of, measurements collected at the level of the nutrient foramen for sex determination?
Background
Nutrient foramina form when the nutrient artery penetrates the cartilage model during ossification. Bone growth will radiate from this location of penetration which will become the nutrient foramen (White and Folkens 2005, pg 46). The nutrient foramen of the tibia is the largest nutrient foramen in the body and is most often located on the posterior proximal
diaphysis of the tibia. The nutrient artery supplies the muscles of the lower leg before entering the tibia via the nutrient foramen to supply nutrients to the bone. These nutrients are necessary for growth, development, maintenance, and repair (Kizilkanat et al., 2006).
Christensen, Passalacqua and Bartelink state that “bones that are subjected to greater mechanical loading and stress (especially the femur and tibia) tend to increase in cortical area. Where these loading and stress differences are greater between males and females, the bones may be more sexually dimorphic in terms of cortical area and/or the size of muscle attachments” (Christensen et al., 2014 pp 205). For this reason, several investigations have sought to determine sex from the femur (Harrington and Wescott 2015, Dibennardo and Taylor 1982, Black 1978, Robinson and Bidmos 2011, Steyn and Işcan 1997) and tibia (González-Reimers et al., 2000, Šlaus and Tomičić 2014, Šlaus et al., 2013, Işcan et al., 1994). Most of these analyses use ANOVA tests or discriminate function analyses to create a “sexing standard”. In investigations of the tibia, many of the discriminant function analyses include measurements of diameter taken at the level of the nutrient foramen.
New methods attempt to sex the skeleton using skeletal elements that are better
preserved, less subject to taphonomic processes, or have fragments which are easily identified. According to Lyman, “it has long been known by observant natural historians that bones of greater density – typically measured as a ratio of mass to volume – tend to survive the ravages of time better than skeletal parts of lesser density (Pokines and Symes 2013). Further, taphonomic processes are not the only damaging factors that can inhibit measurement of the tibia, either at the nutrient foramen or the midshaft. Pathological conditions and fractures also have the potential to impede measurement.
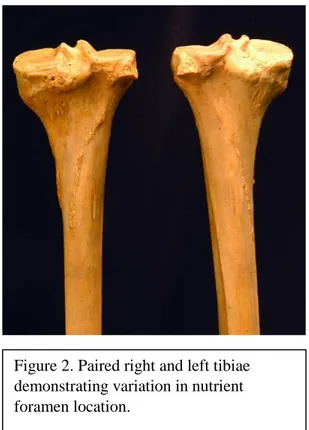
The nutrient foramen of the tibia is easily identifiable even in fragmented remains. Interestingly however, it is well known that the location of the nutrient foramen varies from person to person and can be located in different areas of the bone from the right to left tibia in the same individual (Figures 1& 2) (Singh et al., 2015). This has led some osteometric standards to adopt several midshaft based measurements in place of, or in addition to, the existing nutrient foramen based measurements (Langley et al., 2016 and Moore-Jansen and Jantz, 1990).
Methods
Measurements of the tibia were collected from a sample of 400 individuals from the Robert Terry Anatomical Skeletal Collection. This randomly selected sample consisted of 100 White females, 100 White males, 100 Black females, and 100 Black males. Individuals with severe pathologies, injuries, or wear on the tibia that would greatly impact measurement were
Figure 2. Paired right and left tibiae demonstrating variation in nutrient foramen location.
Figure 1. Paired right and left tibiae demonstrating lack of variation in nutrient foramen location.
replaced by the next numerical individual who fell into the same sex and geographic population category.
The usability of the Robert Terry Anatomical Skeletal Collection in studies relating to modern population has been questioned (DiMichele and Hunt 2016). However, this investigation did not seek to create a discriminant function that could be applied to modern population. Rather, we sought to understand the relationship between midshaft and nutrient foramen based
measurements of the tibia. While this relationship may have changed since the Robert Terry Anatomical Skeletal Collection began, we do not believe that change could be significant enough to remove the relevance of this study to modern populations.
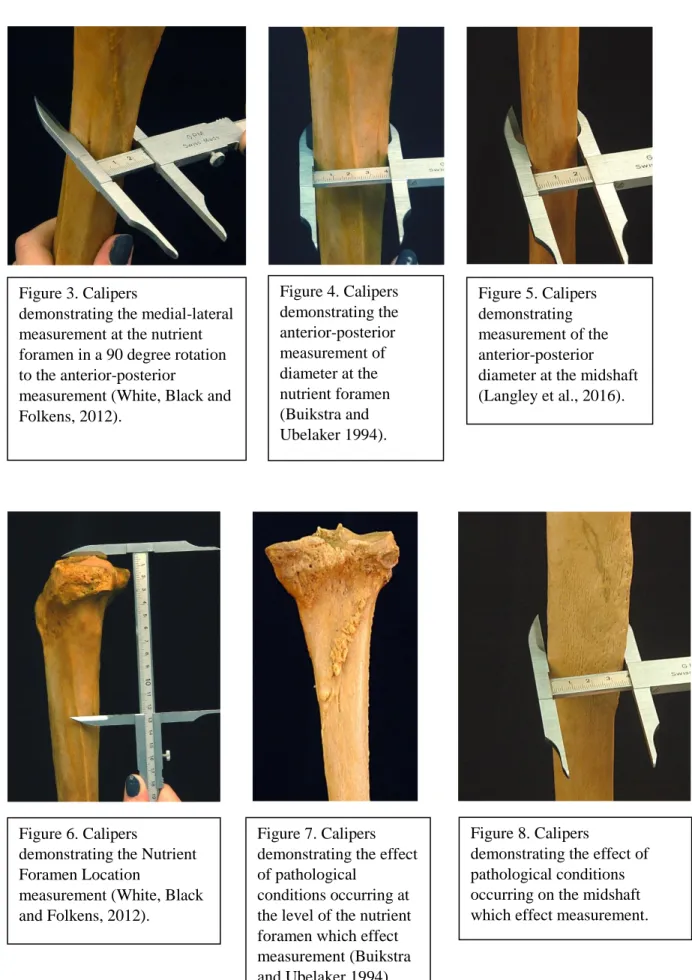
Measurements of the tibia were taken using an osteometric board, sliding calipers and cloth measuring tape according to the standards osteometric protocols (Buikstra and Ubelaker, 1994, Langley et al., 2016, Moore-Jansen and Jantz 1990) (Figures 3-8). Because of
discrepancies in the aforementioned standards, medial-lateral diameter at the level of the nutrient foramen was collected both in a 90 degree rotation from the anterior posterior measurement (Moore-Jansen and Jantz, 1990) and from the interosseous crest (Buikstra and Ubelaker, 1994). Twelve of tibiae in this sample had two nutrient foramina. This is not abnormal since other studies also identify double foramina. Kizilkant and colleagues report two individuals in a sample of 100 with double nutrient foramina (2006). Descriptions of all measurements collected are found in Table 1.
The data set was randomly divided into a testing set and a training set, each consisting of 200 individuals with 50 from each demographic. Several different discriminant function analyses were run in the statistical programming environment R (Table 2). The discriminant functions (LDA) derived from the training set were applied to the testing set.
Andrew and colleagues critique the reproducibility of discriminant function analyses stating that “datasets underlying published papers are unavailable, incorrect, or poorly curated” and then further stating that even accessible and well curated data “must also be accompanied by accurate labels and identifiers” (Andrew et al., 2015). While it is important to acknowledge these concerns, data collected using the Robert J. Terry Anatomical Skeletal Collection is collected by David Hunt and then published online on the following site
(http://anthropology.si.edu/cm/terry.htm). While the labels used are standardized, the methods used for data collection cannot be guaranteed to be identical. For that reason, this research project collected all new data using the same standards throughout data collection.
Initial tests of ancestry differences proved to show no significant differences. Preliminary tests were also done based on age group to address concerns voiced by Ruff and Hayes who express concern for the “age related changes in bone geometry” stating that “there was a significant negative trend in femoral and tibial length with age” (1988, pp 888). However, our preliminary tests showed no significant differences. Therefore, in further analysis, ancestry groups were pooled as well as age demographics.
Figure 3. Calipers
demonstrating the medial-lateral measurement at the nutrient foramen in a 90 degree rotation to the anterior-posterior
measurement (White, Black and Folkens, 2012). Figure 4. Calipers demonstrating the anterior-posterior measurement of diameter at the nutrient foramen (Buikstra and Ubelaker 1994). Figure 5. Calipers demonstrating measurement of the anterior-posterior diameter at the midshaft (Langley et al., 2016).
Figure 6. Calipers
demonstrating the Nutrient Foramen Location
measurement (White, Black and Folkens, 2012).
Figure 7. Calipers demonstrating the effect of pathological
conditions occurring at the level of the nutrient foramen which effect measurement (Buikstra and Ubelaker 1994).
Figure 8. Calipers
demonstrating the effect of pathological conditions occurring on the midshaft which effect measurement.
Table 1.
Measurement Description
Maximum Length Distance from the medial malleolus to the lateral articular surface using an osteometric board
Maximum Proximal Breadth Widest __ of the proximal end of the tibia, found using an osteometric board
Maximum Distal Breadth Widest point of the distal end of the tibia, found using an osteometric board
Anterior-Posterior Diameter at the Nutrient Foramen
Maximum diameter in the anterior-posterior direction, found using sliding calipers
Medial-Lateral Diameter at the Nutrient Foramen
Taken at a 90 degree angle to the Anterior-Posterior Diameter at the Nutrient Foramen, using sliding calipers Maximum Medial-Lateral
Diameter at the Nutrient Foramen
the max distance from the interosseous crest to the opposite side found using sliding calipers
Nutrient Foramen Location Distance from the inferior border of the nutrient foramen to the highest point on the nearest intercondylar
eminence, found using sliding calipers
Nutrient Foramen Circumference Found using a cloth tape following the contours of the bone
Minimum Diameter at the Midshaft
Found using sliding calipers Maximum Diameter at the
Midshaft
Found using sliding calipers
Midshaft Circumference Found using a cloth tape following the contours of the bone
Results
As seen in Table 2, there is no significant difference in accuracy between a discriminant function created with only lefts and applied only to lefts and the same function applied to lefts and rights. The maximum difference in accuracy between only lefts and lefts and rights is 1.5%. This difference is not statistically significant. These data show that there is not enough intra-person variation in nutrient foramen location between right and left to cause significant
mismatching.
The statistical analyses showed that breadth measurements of the proximal and distal epiphyses were consistently good predictors with loading values higher than in all input combinations (Table 2). Of the two medial-lateral measurements collected at the level of the nutrient foramen (Table 2) Maximum Medial-Lateral Diameter at the Nutrient Foramen was a slightly better predictor of sex than Medial-Lateral Diameter at the Nutrient Foramen (Table 2). Of the measurements taken at the midshaft, Minimum Diameter and Circumference were both considered good predictors with relatively high R-values (Table 2). In the combined analysis outlined in Data Set #4 (Table 2) medial-lateral diameter at the nutrient foramen, minimum at the midshaft and circumference at the midshaft were the best predictors.
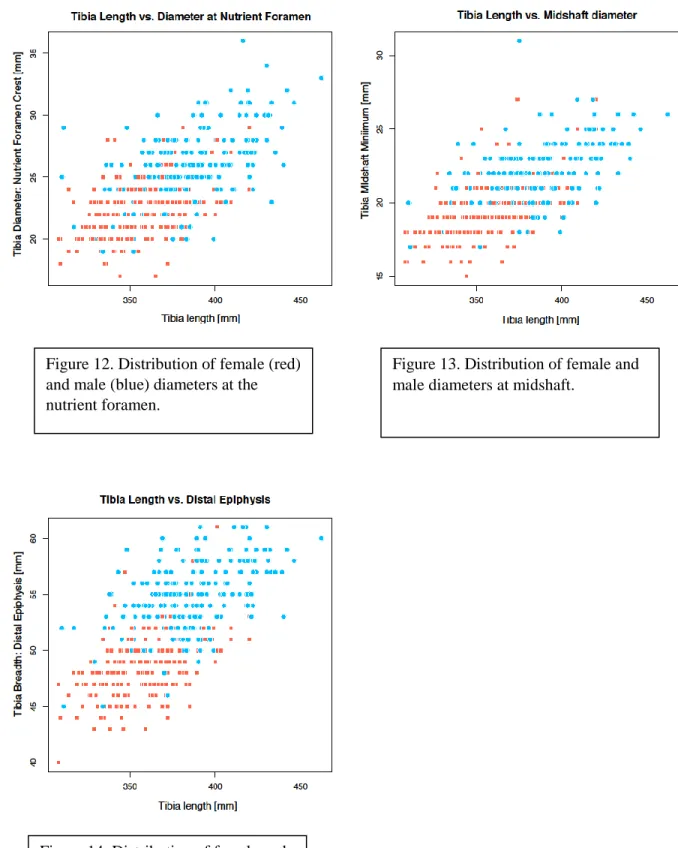
The differences in discrimination between variables is shown in Figures 9-14. The varying levels of separation seen on the scatter plots (Figures 12-14) demonstrates these
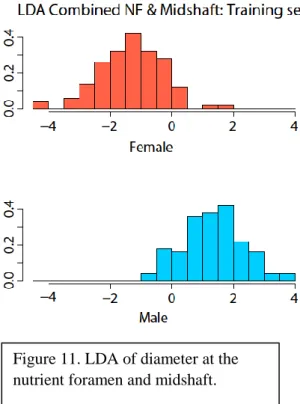
differences in discrimination based on variable input. The histograms (Figures 9-11) demonstrate the error associated with each variable combination. For females, all values falling to the positive side of zero represent individuals who were incorrectly classified based on the discriminant function created from the training set and applied to the testing set. For males, the error is represented by the individuals who fall on the negative side of the zero marker.
These data show that there is no significant statistical advantage of determining sex based on measurements taken at the nutrient foramen compared to those taken at the midshaft (Figures 9-14).
Discussion
The results of this investigation show there is no significant advantage of determining sex based on measurements taken at the nutrient foramen compared to those taken at the midshaft. Sex determination based on tibia osteometrics relies on size sexual dimorphism. The result that nutrient foramen measurements are not more indicative of sex than midshaft measurements shows that the tibia is sexually dimorphic not only in the proximal portion, partially resulting from muscle attachments, but continues to be sexually dimorphic in size in to the midshaft where muscle attachments have less influence. Further, there is not significant amounts of intra-person variation in nutrient foramen location to cause concern about mismatching right and left tibiae. Since this study shows an overall difference in the size of the bone, not just the morphological ratio, even if the nutrient foramina are asymmetrical (Henderson 1978) the statistical ability to determine sex will not be effected.
Although there is no statistical difference in accuracy of sex determination between the two measurements there is a case to be made that factors of inter-/intra- observer error and “field applicability” can greatly affect the applicability of an osteometric standard. Many factors, both internal and external, have the potential to impact the tibia and therefore impact the tibia metrics.
Table 2. Mi d sha ft C ir cu m fer enc e 0.1463 Mi n im um D iam et er at t he m id sha ft -0.1395 Ma xi m u m Diam et er at t he Mi d sha ft 0.0045 N ut ri ent Fora m en C ir cu m -fer enc e (Lef t) 0.0690 Nut ri ent Fora m en C ir cu m -fer enc e (Lef t) 0.0824 Mi d sha ft C ir cu m -fer enc e 0.1539 Nut ri ent Fora m en C ir cu m -fer enc e (Lef t) 0.0453 90 Degr ee Me di al -Lat er al D iam et er at t he N ut ri ent Fora m en (Lef t) -0.0667 Cres t Me di al -Lat er al D iam et er at t he N ut ri ent Fora m en -0.1101 Mi n im um D iam et er at t he M id sha ft -0.1877 Cres t Me di al -Lat er al D iam et er at t he N ut ri ent Fora m en (Lef t) 0.1032 A nt er ior -Post er ior D iam et er (Lef t) 0.0234 Ant er ior -Post er ior D iam et er (Lef t) 0.0159 Ma xi m u m Diam et er at t he Mi d sha ft 0.0109 Ant er ior -Post er ior D iam et er (Lef t) -0.0459 Ma xi m u m D is ta l B rea d th (Lef t) 0.1346 Ma xi m u m D is ta l B rea d th (Lef t) 0.1326 Ma xi m u m D is ta l B rea d th (Lef t) 0.1215 Ma xi m u m D is ta l B rea d th (Lef t) 0.1179 Ma xi m u m Proxi m al B rea d th (Lef t) 0.1242 Ma xi m u m Proxi m al B rea d th (Lef t) 0.1306 Ma xi m u m Proxi m al B rea d th (Lef t) 0.1131 Ma xi m u m Proxi m al B rea d th (Lef t) 0.1167 Ma xi m u m Lengt h (Lef t) -0.0118 Ma xi m u m Lengt h (Lef t) -0.0120 Ma xi m u m Lengt h (Lef t) -0.0147 Ma xi m u m Lengt h (Lef t) -0.0151 V ar ia bl e R -V al ue V ar ia bl e R -V al ue V ar ia bl e R -V al ue V ar ia bl e R -V al ue D at a Set #1 D at a Set #2 D at a Set #3 D at a Set #4
Figure 9. Linear Discriminant Analysis (LDA) of diameter at the nutrient foramen.
Figure 10. LDA of diameter at the midshaft.
Figure 11. LDA of diameter at the nutrient foramen and midshaft.
Figure 12. Distribution of female (red) and male (blue) diameters at the nutrient foramen.
Figure 13. Distribution of female and male diameters at midshaft.
Figure 14. Distribution of female and male distal epiphysis breadths.
Consider a case involving fragmented remains. When the maximum length measurement cannot be collected, the midshaft location cannot be determined. Therefore, measurements taken at the level of the nutrient foramen would have more utility. Potential fractures to the tibia are outlined by Wedel and Galloway (2014) and are summarized in Table 3. These fractures can have further impacts in cases of combined fracture, excessive healing, or related
disease/infection. The nutrient foramen is a point of discontinuity in the cortical bone which creates a point of weakness (Rawson and Robinson 2015). This weakness increases the
likelihood of longitudinal stress fractures (Kizilkanat et al. 2006).The nutrient foramen itself has slight asymmetry which effects the way that stress is deferred around the bone. However, the nutrient foramen is reinforced with extra cortical bone which may assist with fracture resistance (Gotzen et al., 2003).
Of course, individuals with osteoporotic bone or other weakening diseases are at greater risk for fracture. Since the weakening of bone is often age associated, older individuals may not be as easily sexed using these techniques due to impacted measurement sites. Surgery and amputation are other external factors which can impact tibial metrics.
Internal factors which can impact or inhibit collection of tibial metrics. Several internal factors largely effect the ends of the bones, therefore effecting the proximal and distal
measurements. These factors include arthritis and muscle attachments. Largely impacting the diaphysis of the bone are osteomyelitis and periostitis. This is by no means an exhaustive list.
Table 3.
Region Possible Breakage Types & Casues Measurements Effected Proximal Epiphysis Ligament pull or avulsion above the
nutrient foramen
Proximal Breadth AP proximal, length Abduction while under compression,
transects the articular surface
Proximal Breadth AP proximal
Tibial Tuberosity Avulsion, usually induced by jumping Nutrient Foramen and AP proximal
Shaft Crush, butterfly, oblique, transverse, spiral; generally occur at areas with the lowest cross sectional geometry.
Midshaft Distal Length
Medial Malleolus Pilon fractures (Type 1, 2, or 3) Distal Breadth Length
Conclusions
Further analysis on the inter-observer error found with each landmark will contribute to our understanding of the utility and accuracy of these two metric standards. It is also well known that there are population differences in size and morphological characteristics of the skeleton. Thus an inter-population evaluation or error which utilizes the same discriminant function analysis on multiple populations will contribute to the understanding of the global utility of these two standards.
Literature Cited
Andrew, Rose L., Arianne Albert, Sebastien Renaut, Diana Rennison, Dan Bock, and Tim Vines 2015 Assessing the reproducibility of discriminant function analyses. PeerJ:1-22. Black, Thomas K.
1978 A New Method for Assessing the Sex of Fragmentary Skeletal Remains: Femoral Shaft Circumference. American Journal of Physical Anthropology 48:227-232.
Buikstra, J.E. and D.H. Ubelaker
1994 Standards for Data Collection from Human Skeletal Remains. Arkansas Archaeological Survey Research Series #44.
Christensen, Angi M., Nicholas V. Passalacqua, and Eric J. Bartelink
2014 Forensic Anthropology. Kidlington, Oxford: Academic Press. Dibennardo, Robert and James Taylor
1982 Classification and Misclassification in Sexing the Black Femur by Discriminant Function Analysis. American Journal of Physical Anthropology 58:144-151.
DiMichele, Daniel and David Hunt
2016 Robert J. Terry Anatomical Skeletal Collection Postcranial Osteometric Database. http://anthropology.si.edu/cm/terry/Terry_PC_Osteometric_DB_Intro.pdf
González-Reimers, E., J. Velasco-Vázquez, M. Arnay-de-la-Rosa, and F. Santolaria-Fernández 2000 Sex determination by discriminant function and of the right tibia in the
prehispanic population of the Canary Islands. Forensic Science International 108:165-172.
Götzen, Nils, Alan R. Cross, Peter G. Ifju, Andrew J. Rapoff
2003 Understanding Stress concentration about a nutrient foramen. Journal of Biomechanics 36:1511-1521.
Harrington, Katherine I. and Daniel J. Wescott
2015 Size and Shape Differences in the Distal Femur and Proximal Tibia between Normal Weight and Obese American Whites. Journal of Forensic Sciences 60:32-38. Henderson, R.G.
1978 The position of the nutrient foramen in the growing tibia and femur of the rat. Journal of Anatomy 125(3):593-599.
Işcan, Yasar Mehmet, Mineo Yoshino and Susumu Kato
1994 Sex Determination from the Tibia: Standards for Contemporary Japan. Journal of Forensic Sciences 39(3):785-792.
Kizilkanat, Emine, Neslihan Boyan, Esin T. Ozsahin, Roger Soames, and Ozkan Oguz. 2006 Location, number and clinical significance of nutrient foramina in human long bones. Annals of Anatomy 189:87-95.
Langley, Natalie R., Lee Meadows Jantz, Stephen D. Ousley, Richard L. Jantz, and George Milner
2016 Data Collection Procedures for Forensic Skeletal Material 2.0. Forensic
Anthropology Center, Department of Anthropology, University of Tennessee. Knoxville, TN.
Moore-Jansen, Peer and Richard L. Jantz
1990 Data Collection Procedures for Forensic Skeletal Material. Forensic
Anthropology Center, Department of Anthropology, University of Tennessee. Knoxville, TN.
Pokines, James T. and Stevens A. Symes
2013 Manual of Forensic Taphonomy. CRC Press. Rawson, Charles and Joseph Robinson
2015 Rare anterior nutrient foramen of the tibia in an adolescent with shin pain. Radiology Case Reports 10(2):1-4.
Robinson, Meredith Stacy and Mubarak Ariyo Bidmos
2011 An assessment of the accuracy of discriminant function equations for sex
determination of the femur and tibia from a South African population. Forensic Science International 206:212.e1–212.e5.
Ruff, Christopher B. and Wilson C. Hayes
1988 Sex Differences in Age-Related Remodeling of the Femur and Tibia. Journal of Orthopaedic Research 6:886-896.
Singh, Narinder, Rachna Magotra, Arban Kumar, and Ashwani Kumar Sharma
2015 Morphological and Morphometric Study of Tibial Nutrient Foramen. Journal of Evolution of Medical and Dental Sciences 4(37):6398-6401.
Šlaus, Mario and Željko Tomičić
2004 Discriminant function sexing of fragmentary and complete tibiae from medieval Croatian sites. Forensic Science Journal 147:147-152.
Šlaus, Mario, Željka Bedić, Davor Strinović, and Venrana Petrovečki
2013 Sex determination by discriminant function analysis of the tibia for contemporary Croats. Forensic Science International 226:302-304.
Steyn, Maryna and M. Yasar Işcan
1997 Sex Determination from the femur and tibia in South African whites. Forensic Science International 90:111-119.
Wedel, Viki L. and Alison Galloway
2014 Broken Bones: Anthropological Analysis of Blunt Force Trauma, Second Edition. Charles C Thomas. Springfield, Illinois.
White, Tim D., Michael Black and Pieter Folkens
White, Tim D. and Peter A. Folkens