ABSTRACT
The Bureau of Reclamation (Reclamation)is the largest wholesale supplier of water in the United States and serves more than 31 million people in the 17 contiguous Western States, providing more than 9.3 trillion
gallons of water each year. Accurate, timely hydrometeorological information is essential for efficient water management. The National Weather Service (NWS) , in partnership with other agencies, has installed a network of around 160 radar systems
throughout the United States and at selected overseas sites, known as the NEXt generation weather RADar
(NEXRAD) system. The NEXRAD system provides
precipitation information that is readily available to the general public (TV weather, Internet). Great potential exists for agencies such as Reclamation to apply enhanced NEXRAD precipitation products for improving the efficiency of water resource operations and reducing risk of loss from extreme precipitation events. Reclamation's initial work to make operational use of NEXRAD rainfall estimates was the development of an automated information system to assist water users. The result, called the Agricultural WAter Resources Decision Support (AWARDS) system, provides easy, timely access to rainfall and daily crop water use estimates for improving the efficiency of water management and irrigation scheduling. An Early Warning System (EWS) component will provide enhanced public safety to populations at risk downstream from darn structures.
Civil Engineer, Bureau of Reclamation, Denver Federal Center, P.O. Box 25007, D-8550, Denver, CO 80225-0007
Meteorologist, Bureau of Reclamation, Denver Federal Center, P.O. Box 25007, D-8510, Denver, CO 80225-0007
INTRODUCTION
The AWARDS system is based on modern remote sensing, communication, computer, and Internet technologies. The current AWARDS system uses NEXt generation weather RADar (NEXRAD) and automated surface weather station near real-time data, available from remote computers, to automatically prepare rainfall image and
evapotranspiration (ET) chart products for Internet access. Reservoir operators, water managers, and on-farm water users access the AWARDS system products via the Internet to make their operational decisions. Various Reclamation and other users can benefit from near real-time rainfall or snowfall estimates
customized for their particular area of interest. Agricultural water districts can conserve water, and
individual irrigators can improve their on-farm
operations, when NEXRAD rainfall estimates are coupled with evapotranspiration models to provide better estimates of water need. NEXRAD can be used to
provide improved rainfall estimates over watersheds draining into reservoirs with flash flood potential. Because NEXRAD provides continuous spatial and temporal coverage of most of the 17 Western States (mountain blockage is a problem for some areas), many water managers can benefit from radar-estimated
precipitation used as input to practical rainfall-runoff models. Such models are often linked to water resource operation models and decision support systems.
AWARDS SYSTEM
The purpose of the AWARDS system is to improve the efficiency of water management and irrigation
scheduling by providing guidance on when and where to deliver water and how much to apply. The current
AWARDS system works as summarized below and shown in
figure 1.
NEXRAD Doppler radar systems measure equivalent
reflectivity factor (Ze) data as input to the Precipitation Processing System(PPS. The PPS produces the Hourly Digital Precipitation (HDP) array product for each radar system, which is identified as Level III, Stage I.
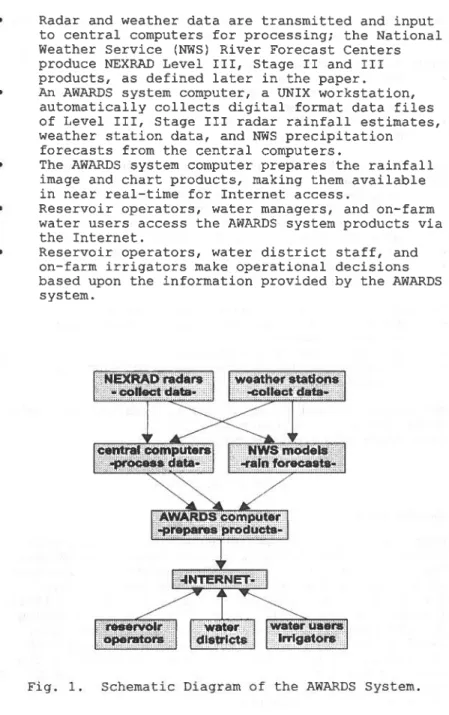
Radar and weather data are transmitted and input to central computers for processing; the National Weather Service (NWS) River Forecast Centers produce NEXRAD Level III, Stage II and III products, as defined later in the paper. • An AWARDS system computer, a UNIX workstation,
automatically collects digital format data files of Level III, Stage III radar rainfall estimates, weather station data, and NWS precipitation forecasts from the central computers.
• The AWARDS system computer prepares the rainfall image and chart products, making them available in near real-time for Internet access.
Reservoir operators, water managers, and on-farm water users access the AWARDS system products via the Internet.
• Reservoir operators, water district staff, and on-farm irrigators make operational decisions based upon the information provided by the AWARDS system.
The AWARDS system automatically integrates I-hour and 24-hour NEXRAD rainfall estimates
with 24-hour surface weather station data: mean temperature
mean relative humidity mean wind speed
point rainfall accumulation total solar radiation
and uses the NEXRAD radar rainfall estimates and surface weather station data with:
crop evapotranspiration (ET) equations local terrain and soil information effective rainfall estimation procedures local daily maximum and minimum normals quantitative precipitation forecasts watershed/reservoir systems
irrigation water distribution systems to provide the water managers and users with:
NEXRAD rainfall and watershed rainfall water volume estimates
effective rainfall estimates
ET estimates for determining crop water use requirements
The above information is available from Reclamation's NEXRAD Web page (Internet site) at
http://www.usbr.gov/rsmg/nexrad.
DATA ACQUISITION NEXRAP 1&U
NEXRAD precipitation estimates are derived products produced by the NWS Radar Product Generators (RPGs). The radar reflectivity data are converted to rainfall rates using a Z-R relationship, and precipitation accumulations are then calculated (Crum et al., 1993; Klazura and Imy, 1993). Level I data are the analog signals from the Radar Data Acquisition (RDA) site, Level II data are the digital base data output from the RDA signal processor, and Level III data are the base and derived products/algorithm output produced by the NWS NEXRAD RPGs. Following are descriptions of the Level III HDP products.
~~: Stage I precipitation processing, also referred to as the NEXRAD Precipitation Processing Subsystem (PPS), runs on the NEXRAD computers (RPGs) located at the NWS local Weather Forecast Offices. The PPS generates the Hourly Digital Precipitation
(HDP) accumulation product that uses the Hydrologic Rainfall Analysis Project (HRAP) grid cells, sized at about 4- by 4-kilometer(km~
~~: Stage II precipitation processing creates hourly precipitation estimates (HDP) using Stage I output in combination with rain gage data. Rain gage data are used to adjust the radar data, using an objective analysis procedure, to create a multi-sensor hourly precipitation estimated accumulation analysis. At present, the Stage I output data are passed to the NWS River Forecast Centers (RFC) for follow-up Stage
II and Stage III precipitation processing.
~~: Stage III processing mosaics (merges) the Stage II analyses from individual radars, using tools that allow the forecaster to analyze and edit the individual multi-sensor analysis to create an HDP product for the entire RFC's area of responsibility. These data are generated into Network Common Data Format (NetCDF) or xmrg (binary file format) files. The digital hourly NEXRAD precipitation estimates are automatically collected into the AWARDS computer via File Transfer Protocol (FTP) from the RFCs within 45-minutes of the next hour. Once a full 24 hours are
accumulated, computer programs produce 24-hour summaries and make them available on the Internet site maps (images).
Quantitative Precipitation Forecast (QPF)values for the current 24-hour period are derived from algorithms run at the NWS Weather Forecast Offices, then ported to the RFC, where hydrometeorologists create composite products in NetCDF, similar to the Stage III product. Weather D.a.U
Automated weather stations in operational and
developing AWARDS areas transmit surface weather data via radio signal, phone line, cellular phone, or satellite to local computer systems. These data are then automatically collected from the sources, via
FTP, into the AWARDS computer. In some cases, 5-minute data are acquired; in others, only full 24-hour accumulations are available. These data are normally accessible in the early morning, allowing sufficient time to prepare ET charts for the Internet site maps.
Mapping Il.a.ta
Various Geographic Information System(GIS) data resources are used, such as watershed, hydrologic, political boundary, irrigation district conveyance system, and other features, for developing the base maps for the AWARDS system. Digitizing these features
from maps is required when no GIS sources are
available. These data are transferred to longitude-latitude coordinates for input to a graphics program available from the National center for Atmospheric Research, called NCAR Graphics. The HRAP grid cells are plotted and overlaid with the NEXRAD preCipitation estimates and weather station rain gage measurements. Lastly, the crop water use and weather data are integrated into the maps via pop-up charts.
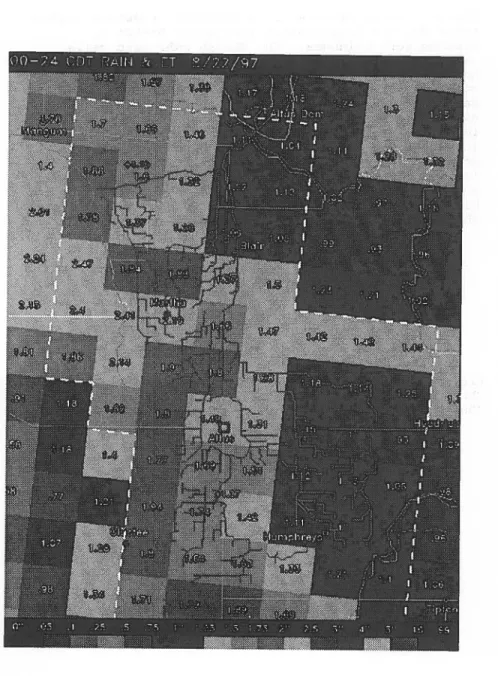
Fig. 2. Example of interactive image showing the 24-hour NEXRAD STAGE III rainfall estimates.
Figure 2 is an example of an interactive AWARDS system image for the Lugert-Altus Irrigation District,
southwestern Oklahoma. The NEXRAD HRAP grid cells (about 4- by 4-km) in figure 2 show the estimated 24-hour (midnight to midnight local time) average
rainfall (in) for each cell. These Level III, Stage III data are available via FTP from the Arkansas-Red Basin River Forecast Center. Also shown(at + signs) are the locations of two Oklahoma Mesonet weather stations
(Crawford et al.,1992). The irrigators can click a computer mouse on the HRAP grid cells within the dashed line boundary for pop-up estimated Crop Water Use (ET) charts and can click on the weather stations for pop-up Daily Weather charts. Examples of these two types of charts are shown in figures 3 and 4.
JU.TUS. OK - Mesonet Weather - 1997
Aug Aug Aug Aug Aug Aug Aug
16 11 18 19 20 21 22
Max. Temp. (F) 94.4 94.8 92.5 94.1 93.9 92.7 88.0
Min. Temp. (E") 75.0 75.2 73.0 72.1 70.2 70.9 67.1
Avg. lUnd (Hi/Hr) 8.7 4.2 3.4 3.1 4.5 4.7 7.8 ReI. Hum. ( ' ) 69.1 69.9 78.8 80.6 78.2 75.2 82.9
Rain (In) 00.0 0.00 0.27 0.11 0.00 0.00 1.27
Solar Rad. (Lang1eys) 572 577 467 548 527 573 441
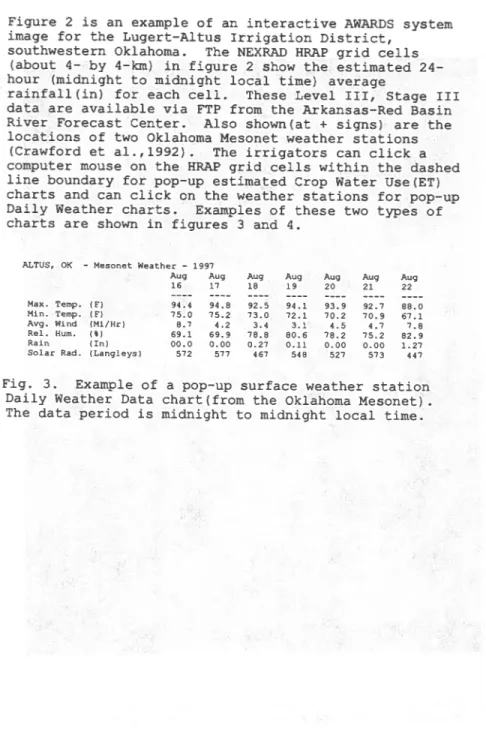
Fig. 3. Example of a pop-up surface weather station Daily Weather Data chart(from the Oklahoma Mesonet). The data period is midnight to midnight local time.
I
I ALTUS, OK MESONET SITE - ESTIMATED CROP ~TER USE - AUGUST 23, 1997 I
I I DAILY I FORE-I I I
I I CROP ~TER USE-(IN) I CAST I I I I 7 I 14 I I CROP START I PENMAN ET - AUG I AUG I COVER I TERM I SUM I DAY I DAY I I DATEI---I---I DATE I DATE I ET I USEI USE I
I I 19 20 21 22 I 23 I I I I I I 1---1---1---1---1---1---1----1---1 I COTTON 501 I 0.21 0.18 0.15 0.12 I 0.13 I 801 11001 I 14.7 I 1.51 3.1 I 1---1---1---1---1---1---1----1---1 I COTTON 507 I 0.230.22 0.19 0.16 I 0.17 I 805 11001 I 14.4 I 1.71 3.4 I 1---1---1---1---1---1---1----1---1 I COTTON 514 I 0.26 0.25 0.23 0.21 I 0.21 I 810 11001 I 14.1 I 1.91 3.6 I 1---1---1---1---1---1---1----1---1 I COTTON 521 I 0.29 0.30 0.28 0.26 I 0.27 I 815 11001 I 13.1 I 2.11 3.8 I 1---1---1---1---1---1---1----1---1 I COTTON 528 I 0.29 0.30 0.30 0.29 I 0.29 I 820 11001 I 11.8 I 2.11 3.8 I I NEXRAD HRS AVAIL I 24 24 24 24 I QPF I I TOTAL RAIN I 0.04 0.04 0.001.62 I 0.00 I I EFFECTIVE RAIN I 0.04 0.04 0.00 1.46 I 0.00 I
NEXRAD MONTHLY TOTAL RAIN: MAY 4.13 JUNE 5.87 JULY 1.38 AUGUST 5.18
(164x321
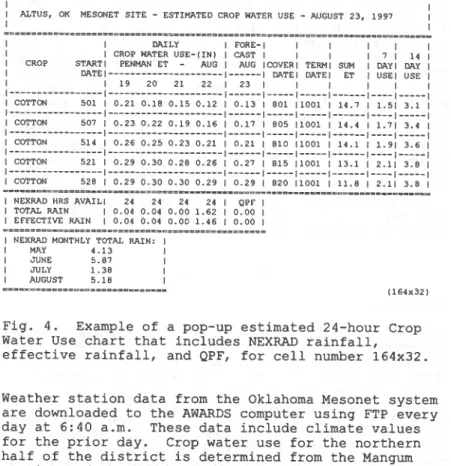
Fig. 4. Example of a pop-up estimated 24-hour Crop Water Use chart that includes NEXRAD rainfall, effective rainfall, and QPF, for cell number 164x32.
Weather station data from the Oklahoma Mesonet system are downloaded to the AWARDS computer using FTP every day at 6:40 a.m. These data include climate values for the prior day. Crop water use for the northern half of the district is determined from the Mangum station and the southern half from the Altus station. If necessary, an averaging algorithm could be
implemented to better establish the ET for each cell as calculated by the two weather stations. Averaging was not used in the Lugert-Altus Irrigation District because minor variations exist in the weather data between the stations.
The primary crop in the Lugert-Altus Irrigation District is cotton, which was planted during the month of May in 1997. The daily crop water use is calculated for each of the five planting date ranges using the Penman-Monteith combination reference ET method (ASCE,1990). A crop curve based on Growing Degree Days is implemented as suggested by researchers
Service. In this example, the quantities, in inches, are shown for the past 4 days, August 19 through 22. A forecasted ET for August 23 is estimated by
averaging the past 3 days use. Data from the National centers for Environmental Prediction (NCEP) Early ETA model will be used for improving this forecast value and to extend the forecast up to 5 days (development in progress). The cover and terminate dates are shown for reference, and the summation of ET since planting and for the past 7 and 14 days is presented. The NEXRAD total daily rainfall quantities for the specified number of hours of data availability and an estimate of the effective rainfall are also presented. Further work will enhance the effective rainfall quantities using soil, slope, and vegetation data for each specific 4- by-4 km cell. NEXRAD rainfall totals for this cell are also displayed.
OTHER DEVELOPMENTS
~ Mexico
In addition to implementation in southwestern Oklahoma, the AWARDS system is being developed in the Rio Grande River Basin to support the Upper Rio Grande Water Operations Model (URGWOM). The URGWOM is a multi-agency surface water modeling effort capable of simulating water storage and delivery operations for the Rio Grande from its headwaters and San Juan-Chama Diversion to Fort Quitman, Texas. This numerical computer model will be used in flood control
operations, water accounting, and evaluating water operation alternatives. Results from the AWARDS system will be ported to an ET toolbox component of
URGWOM for estimating consumptive use demands on a
daily basis for both agricultural and riparian lands.
Two irrigation districts, Middle Rio Grande
Conservancy District (MRGCD) and Elephant Butte Irrigation District (EBID), are assisting with installation of weather stations and defining conveyance and delivery systems. Reclamation and district GIS data are used to define map features.
NEXRAD precipitation quantities are mapped in the URGWOM study area using Level III Stage III data from
radar sites located near Albuquerque and Alamogordo,
available to the AWARDS computer via FTP from the Western Gulf River Forecast Center. Cooperative efforts with governments and universities in both states allow acquisition of daily weather station data and vegetation indexes. The weather station values are transmitted via phone lines and cellular phone to computers at the New Mexico Climate Center at the New Mexico State University (NMSU) and then ported via FTP to the AWARDS computer. The daily crop curves used for determining ET in this AWARDS system were developed by NMSU staff (King, 1998), and crop phenology data were generated by staff at the MRGCD and EBID.
The Biodiversity Assessment Group research facility at NMSU has an agreement with the White Sands Missile Range to receive daily images from Advanced Very High Resolution Radiometer satellites. These data are corrected for atmospheric effects, referenced to vegetation indexes, and processed to calculate acreage of both riparian and agricultural vegetation in each 4- by 4-km cell. The riparian growth includes Cottonwood, Russian Olive, and Salt Cedar trees, and Salt Grass and other species.
In addition to the ET toolbox effort, weather station charts and cell-by-cell crop water use charts for the specific acreage (agricultural and riparian) are mapped with the NEXRAD rainfall estimates and
displayed on an Internet site. This 4- by 4-km grid map provides a near real-time decision support tool
for water managers and users within the Basin. Oregon
In southwestern Oregon, near Medford, NEXRAD precipitation quantities from the Northwest River Forecast Center are similarly mapped on an Internet site for the Rogue River Valley watersheds. An important element of this program will be an early warning component, which will be implemented to provide increased awareness of flood danger, as discussed later in the paper.
Mapped data for this project were acquired from the Rogue Valley Council of Governments, United States Geological Survey, and Reclamation GIS sources.
For each HRAP cell within the boundaries of the three irrigation districts in the area, crop water use
charts from Reclamation's Agricultural Meteorology (AgriMet) program are transferred, via FTP, to the
AWARDS computer and displayed on the maps. AgriMet weather station values are transmitted via a satellite downlink site in Boise, Idaho, and are then also
transferred to the AWARDS computer. Weather station data from other organizations will be accessed in the future. The AgriMet program uses the Kimberly-Penman method for calculating reference evapotranspiration
for crops grown in Reclamation's Pacific Northwest Region.
EARLY WARNING SYSTEM (EWS) COMPONENT
Similar to the AWARDS system application, use of near real-time « 1 hour) NEXRAD data to estimate rainfall
over watersheds should enhance existing reservoir and darn EWS. The EWS designs consist of the following elements: (1) a method for detecting flash flood events; (2) a decision making process; (3) a means for communicating warnings between operating personnel and local public safety officials; and (4) a method for local public safety officials to effectively
communicate the warnings to the public and carry out a successful evacuation of the threatened population at risk (Fisher, 1993). NEXRAD should be able to
pinpoint the cores of heavy convective storms.
The HDP data are available about 4S minutes past each sampled hour. Such data should, in most cases, provide alerts before the runoff is measured by a stream gage. However, Reclamation is working on a NEXRAD
precipitation accumulation alogrithrn to improve the temporal resolution (Hartzell et al., 1998). A source for these data is a NEXRAD Information Dissemination Service, that provides nearly instantaneous
reflectivity data at a spacial resolution of 1 degree by 1 kilometer. The increased accuracy, reliability, and alert lead time gained by incorporating these
NEXRAD rainfall estimates can provide enhanced public
safety to populations downstream from darn structures, reducing the risk of loss of property and life.
SUMMARY
The AWARDS system demonstrates a methodology that integrates NEXt generation weather RADar (NEXRAD) Level III, Stage III rainfall estimates with modern computer, communication, and Internet technologies for improved water resources management.
• Daily crop water use estimates for improving the
efficiency of on-farm water management are easily available for the crops grown in each 4- by 4-km area.
Water delivery system managers, in near real-time, can observe hourly precipitation quantities for improved operations.
Determination of evapotranspiration (ET) for the riparian zone and mapping at these 4- by 4-km resolutions provides an additional decision support tool for river system management.
Porting consumptive use data to the multi-agency Upper Rio Grande Water Operations Model system via an ET toolbox component contributes daily estimates of ET for both agricultural and riparian lands.
Reclamation is designing an Early Warning System to provide enhanced public safety to populations at risk downstream from dam structures during potential flash-flood events using the
technologies available through the AWARDS system.
REFERENCES
American Society of Civil Engineers, 1990, Manual 70,
Evapotranspiration and Irrigation Water Requirements.
Crawford, K.C., F. Brock, R. Elliot, G. Cuperus, S.
Stadler, H. Johnson, and C. Doswell III, 1992: The
Oklahoma Mesonet: A 21st century project. Preprints, Eight International Conference On Interactive
Information and Processing Systems for Meteorology, Oceanography, and Hydrology, Atlanta, GA, American
Crum, T.D., Alberty, R.L., and Burgess, D.W., 1993: Recording, Archiving, and Using WSR-88D Data.
Bulletin American Meteorological Society, 74, pp. 645-653.
Fisher, D.B., 1993: Reclamation's design process of Early Warning Systems for dam safety. Hydraulic Engineering '93, Vol. 1. ASCE, 690-695.
Hartzell, C.L., Super, A.B., Fisher, D.B., Brower, L.A., 1998: Nexrad-Enhanced Early Warning Systems, Preprints, Special symposium on Hydrology, American Meteorological Society, Phoenix, AZ, January 11-16,
1998, pp. 109-112.
King, P., 1998: New Mexico State University, personal communications.
Klazura, G.E. and Imy, D.A., 1993: A Description of the Initial Set of Analysis Products Available from the NEXRAD WSR-88D System. Bulletin American
Meteorological Society, 74, pp. 1293-1311.
New, Leon, 1997: Texas Agricultural Extension Service, The Texas A&M University, personal communications.