Accepted Manuscript
Observations of temperature stability of γ-zirconium hydride by high-resolution neutron powder diffraction
Zhiyang Wang, Axel Steuwer, Nanxi Liu, Tuerdi Maimaitiyili, Maxim Avdeev, Jakob Blomqvist, Christina Bjerkén, Caroline Curfs, Justin A. Kimpton, John E. Daniels
PII: S0925-8388(15)31743-6 DOI: 10.1016/j.jallcom.2015.11.187 Reference: JALCOM 36042
To appear in: Journal of Alloys and Compounds
Received Date: 29 September 2015 Revised Date: 24 November 2015 Accepted Date: 25 November 2015
Please cite this article as: Z. Wang, A. Steuwer, N. Liu, T. Maimaitiyili, M. Avdeev, J. Blomqvist, C. Bjerkén, C. Curfs, J.A. Kimpton, J.E. Daniels, Observations of temperature stability of γ-zirconium hydride by high-resolution neutron powder diffraction, Journal of Alloys and Compounds (2015), doi: 10.1016/j.jallcom.2015.11.187.
This is a PDF file of an unedited manuscript that has been accepted for publication. As a service to our customers we are providing this early version of the manuscript. The manuscript will undergo copyediting, typesetting, and review of the resulting proof before it is published in its final form. Please note that during the production process errors may be discovered which could affect the content, and all legal disclaimers that apply to the journal pertain.
M
AN
US
CR
IP
T
AC
CE
PT
ED
Graphic AbstractM
AN
US
CR
IP
T
AC
CE
PT
ED
Observations of temperature stability of γγγγ-zirconium hydride by high-resolution neutron
1
powder diffraction
2
Zhiyang Wang a,b,*, Axel Steuwer c, Nanxi Liu a, Tuerdi Maimaitiyili d, Maxim Avdeev e, 3
Jakob Blomqvist d, Christina Bjerkén d, Caroline Curfs f, Justin A. Kimpton b, John E. Daniels 4
a
5
a
School of Materials Science and Engineering, UNSW Australia, Sydney, New South Wales 6
2052, Australia 7
b
Australian Synchrotron, 800 Blackburn Road, Clayton, Victoria 3168, Australia 8
c
Nelson Mandela Metropolitain University, Gardham Av., 6031 Port Elizabeth, South Africa 9
d
Materials Science and Applied Mathematics, Malmö University, Östra Varvsgatan 11 A, 10
Malmö, Skane 20506, Sweden 11
e
The Bragg Institute, Australian Nuclear Science and Technology Organisation, Lucas 12
Heights, New South Wales 2234, Australia 13
f
European Synchrotron Radiation Facility, 71 Avenue des Martyrs, 38000 Grenoble, France 14
* Corresponding author. E-mail: zhiyang.wang@unsw.edu.au; Tel.: +61 03 85405397 15
16
Abstract: The phase evolution in a zirconium–50 deuterium (Zr–50D, at.%) alloy system
17
during thermal cycling has been investigated using in situ high-resolution neutron powder 18
diffraction. The results showed that the peritectoid reaction α-Zr + δ-ZrD → γ-ZrD previously 19
suggested to occur at high temperatures does not take place in the system. Slow cooling, from 20
high temperatures (≥520 K) to room temperature at a rate of 5 K min–1, promoted the γ-21
hydride formation rather than fast cooling as reported earlier. In contrast to the observation 22
that the δ-hydride present in the system remained at temperatures up to 740 K, the produced γ 23
phase transformed to δ-hydride in the temperature range of 370 K to 559 K, with the 24
transformation completing at approximately 559 K. It is confirmed that the formation of the γ-25
M
AN
US
CR
IP
T
AC
CE
PT
ED
hydride was reproducible with slow cooling, and a diffusion-controlled sluggish δ- to γ-1
hydride transformation is suggested to be responsible for the favorable development of γ-2
hydride during slow cooling. 3
Keywords: Metal hydrides; Phase transitions; Neutron diffraction; Zirconium hydride;
4
Zirconium; Nuclear materials 5
6
1. Introduction
7
The formation of embrittling zirconium hydrides has been recognized as one of the most 8
important reasons for the ductility degradation and failure in zirconium alloys, which are 9
extensively used in the nuclear industry as structural and fuel cladding materials. The 10
presence of hydrides in the zirconium alloy matrix has been shown to induce a crack initiation 11
and propagation process called delayed hydride cracking (DHC) [1], significantly reducing 12
the useable lifetime of the component. The hydride formation is facilitated essentially due to 13
the strong affinity of zirconium and its alloy with hydrogen and the low solubility of 14
hydrogen in the hexagonal α-Zr phase (less than 10 wt. ppm at room temperature [2]). 15
Current knowledge suggests that there are four phases of hydrides (ζ, γ, δ and ε) in the 16
Zr–H system. Normally, the δ- and ε-hydrides are reported as stable phases, while the other 17
two are metastable. The crystal structures and common compositions of these different 18
hydride phases as reported in the literature [3-6] are summarized in Figure 1. A brief review 19
of the crystallography of the δ-, γ- and ε-hydrides has been provided by Steuwer et al. [7]. The 20
ζ-hydride (Zr2H) is a more recently identified metastable phase with a trigonal structure
21
(P3m1) that is fully coherent with the hexagonal α-Zr [8]. The difference between the 22
reported stable δ-hydride and metastable γ-hydride is the degree of ordering of the hydrogen 23
atoms at tetrahedral sites [7]. The δ phase is reported to have a disordered face-centred cubic 24
structure (Fm3m) with the hydrogen atoms randomly occupying part of the eight available 25
M
AN
US
CR
IP
T
AC
CE
PT
ED
tetrahedral (0.25, 0.25, 0.25) sites (see Fig. 1). This is the most commonly observed hydride 1
phase which is often reported to form after slow cooling (e.g., furnace cooling [9, 10]) and 2
have a typical non-stoichiometric composition of ~ZrH1.66 [6]. The γ-hydride (ZrH1.0) has
3
been identified to be a tetragonal (P42/n) phase with the ordered arrangements of hydrogen
4
atoms at the tetrahedral interstitial sites. This phase is mostly observed in the samples after 5
rapid quenching [11, 12], but some other investigations judged that the γ-hydride can also 6
appear in the slow cooling regimes dependent on the alloy compositions and hydrogen 7
contents of the samples [13-15]. Here, it is worth mentioning the oddness, from a 8
thermodynamical point of view, as to why an ordered structure of γ-hydride would form 9
during rapid quenching which would essentially freeze the highly mobile H atoms in their 10
random positions while slow cooling favours δ-hydride. Additionally, there is another 11
orthorhombic structure (Cccm) reported for the γ phase based on neutron diffraction 12
measurements of deuterided zirconium samples [16]. However, no full pattern Rietveld 13
refinement of γ-hydride has been reported to the best of our knowledge to discriminate the 14
exact crystal structure of this phase. Furthermore, Mishra and Bashkin et al. [17, 18] argued 15
that the γ-hydride is actually an equilibrium phase produced via a peritectoid α + δ → γ 16
reaction at high temperatures, although this argument is possibly in violation of the Gibbs 17
phase rule for the binary system. Root and co-workers [19-21] indicate by neutron diffraction 18
that a reversible δ ⇌ γ phase transformation occurred in a Zr–2.5Nb (wt.%) alloy at ~453 K. 19
They suggested that γ-hydride is stable at room temperature as implied by the observation of 20
continuous formation of γ-hydride during room-temperature aging. Some first-principles 21
simulations also concluded that γ-hydride is the most stable phase, while δ-hydride is 22
thermodynamically less stable than the other hydride phases [22, 23]. 23
To summarize, despite decades of research, the formation, stability and exact structure of 24
hydride phases (especially the γ phase) are still not completely resolved. Further 25
M
AN
US
CR
IP
T
AC
CE
PT
ED
investigations are essential to improve the understanding of these issues, not only due to the 1
technical importance of the hydride-induced embrittlement in zirconium alloys, but also to the 2
fundamental interests in the phase transformation behaviors of stable and metastable hydrides. 3
Towards that end, this study presents in situ high-resolution neutron diffraction measurements 4
performed on the deuterided zirconium powders during thermal cycling. The data clearly 5
revealed that the previously reported [17, 18] peritectoid α + δ → γ reaction does not occur in 6
the material system investigated. The formation of γ-hydride in the system was found to be 7
promoted by slow cooling rather than rapid cooling. A plausible explanation qualitatively 8
consistent with the diffraction data was proposed to understand this behavior. The δ-hydride 9
was shown to be stable at temperatures up to 740 K while the γ-hydride gradually transformed 10
to δ-hydride during heating. In parallel with the present work, a synchrotron X-ray diffraction 11
study during in situ hydrogen loading by Maimaitiyili et al. [24] confirms the hydride 12
formation process outlined here. 13
14
15
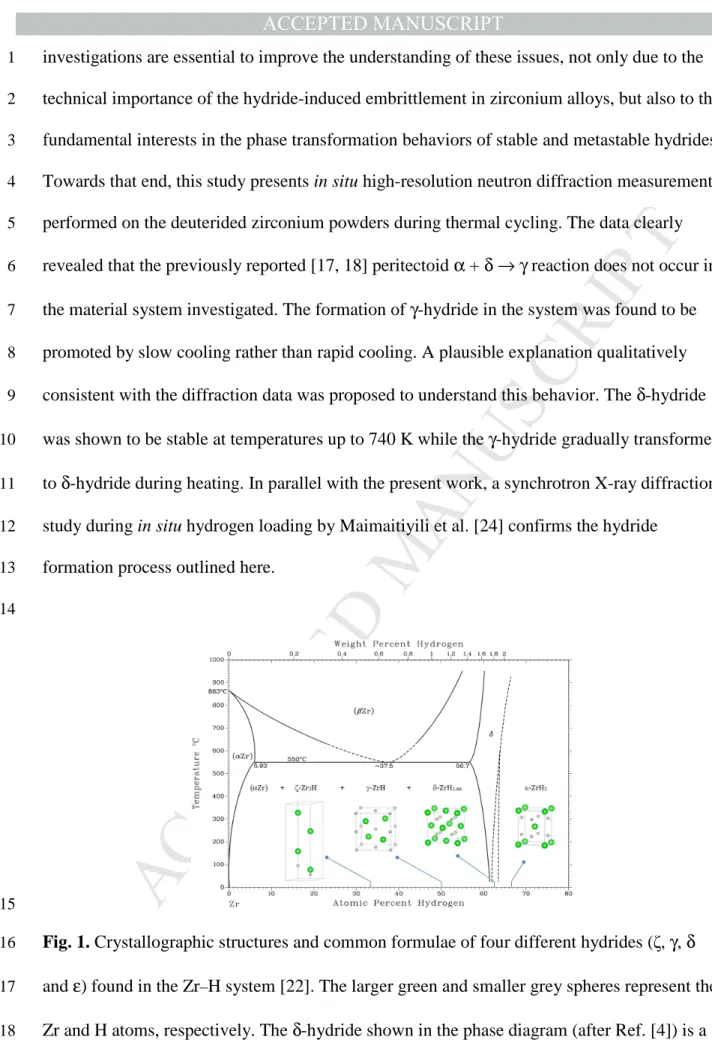
Fig. 1. Crystallographic structures and common formulae of four different hydrides (ζ, γ, δ
16
and ε) found in the Zr–H system [22]. The larger green and smaller grey spheres represent the 17
Zr and H atoms, respectively. The δ-hydride shown in the phase diagram (after Ref. [4]) is a 18
non-stoichiometric phase which was reported to have a typical H/Zr ratio of ~1.66 and a 19
M
AN
US
CR
IP
T
AC
CE
PT
ED
disordered face-centred cubic structure with the hydrogen atoms partially occupying the eight 1
available tetrahedral sites at random. The γ-hydride (ZrH1.0) was identified to have a
2
tetragonal structure with the ordered arrangements of hydrogen atoms at the tetrahedral 3 interstitial sites. 4 5 2. Experimental 6
Commercial-grade zirconium powders (99.2% purity) were charged with gaseous 7
deuterium using a high pressure furnace. A temperature of 573 K and pressure of 1.9 bar were 8
applied for a period of 10 h which resulted in a final atomic ratio of Zr to D of approximately 9
50:50 (uncertainty within 3%). The selection of this composition for the present study is to 10
check the existence of a peritectoid reaction α-Zr + δ-ZrD →γ-ZrD, which was proposed 11
previously to occur at 50 at.% hydrogen and at high temperatures (~528 K [17], or 559 K 12
[18]). The prepared deuterated zirconium samples are preferred for the neutron diffraction 13
studies compared with the counterparts with hydrogen charging because of the higher 14
coherent scattering amplitude of deuterium [25]. Additionally, it is commonly accepted that 15
the H-D replacement only marginally affects the diffusion rates and mobility of D in the bulk 16
zirconium sample [26]. 17
In situ temperature-dependent neutron diffraction experiments were carried out using the 18
high-resolution powder diffractometer Echidna [27] at the OPAL research reactor of the 19
Australian Nuclear Science and Technology Organisation. The deuterated powder was loaded 20
into an 8 mm diameter vanadium can which was then sealed with copper gasket. The can was 21
placed inside a cryofurnace for temperature cycling between room temperature (290 K) and 22
763 K. The thermal cycle profile used is shown in Fig. 2. Neutron wavelengths (λ) of 2.4395 23
and 1.6215 Å were used for the data collection in the 2θ range of 5 – 165° with 2θ step-size of 24
0.05° at specific soaking temperatures. Note that during thermal cycling, heat treatments 25
M
AN
US
CR
IP
T
AC
CE
PT
ED
using two different cooling rates of 30 K min–1 and 5 K min–1 were conducted to determine 1
the effect of cooling rate on the formation of γ-ZrD phase. Additionally, high-resolution 2
synchrotron X-ray diffraction measurements were performed on the as-deuterided powders at 3
room temperature at the beamline ID31 of the European Radiation Synchrotron Facility in 4
Grenoble, France. An X-ray beam of wavelength λ = 0.306589(92) Å (energy 40.44 keV) was 5
used for the experiments with the powder samples packed in glass capillaries. The collected 6
neutron and X-ray diffraction data were analyzed using the Rietveld refinement program 7
TOPAS (Version 4.2) [28]. The peak profile was modelled using a pseudo-Voigt peak shape 8
function and the background of the diffraction pattern was fitted by a linear interpolation 9
between selected background data points. The zero point error, scale factor, lattice parameters 10
and isotropic atomic displacement parameters were refined. For the site occupancy of the D 11
atom in the deuteride phases (δ, ε and γ) potentially formed in the sample, this parameter was 12
refined for the δ- and ε-deuteride phases but was fixed to be 1.0 for the stoichiometric γ-13
deuteride (ZrD1.0) phase as evidenced in previous works [4, 5]. For simplicity the
14
stoichiometry of hydride phases were not specified in most cases hereinafter unless necessary. 15
The D atoms occupy the special positions in the unit cells of the deuteride phases in the 16
reported structural models [5] and their atomic positions were constrained to the 17
corresponding special values. 18
M
AN
US
CR
IP
T
AC
CE
PT
ED
1Fig. 2. Thermal profile used in the neutron diffraction experiments. The figure numbers were
2
included to show which diffraction data were presented in this work at a specific temperature. 3
4
3. Results and discussion
5
The initial as-deuterided sample was investigated using high-resolution synchrotron X-6
ray and neutron diffraction at room temperature. The cubic (Fm3m) δ-ZrD and tetragonal 7
(I4/mmm) ε-ZrD phases as well as the hexagonal (P63/mmc) α-Zr phase were identified in the
8
initial sample based on the measured diffraction data (Fig. 3, black data points), while the 9
tetragonal γ-ZrD phase was not detected. A combined Rietveld refinement using the X-ray 10
and neutron diffraction data was performed with the structural models of the phases observed 11
and the results of the fit are shown in Figure 3. The inset in Fig. 3a shows a detailed fit of the 12
X-ray diffraction pattern at a higher 2
θ
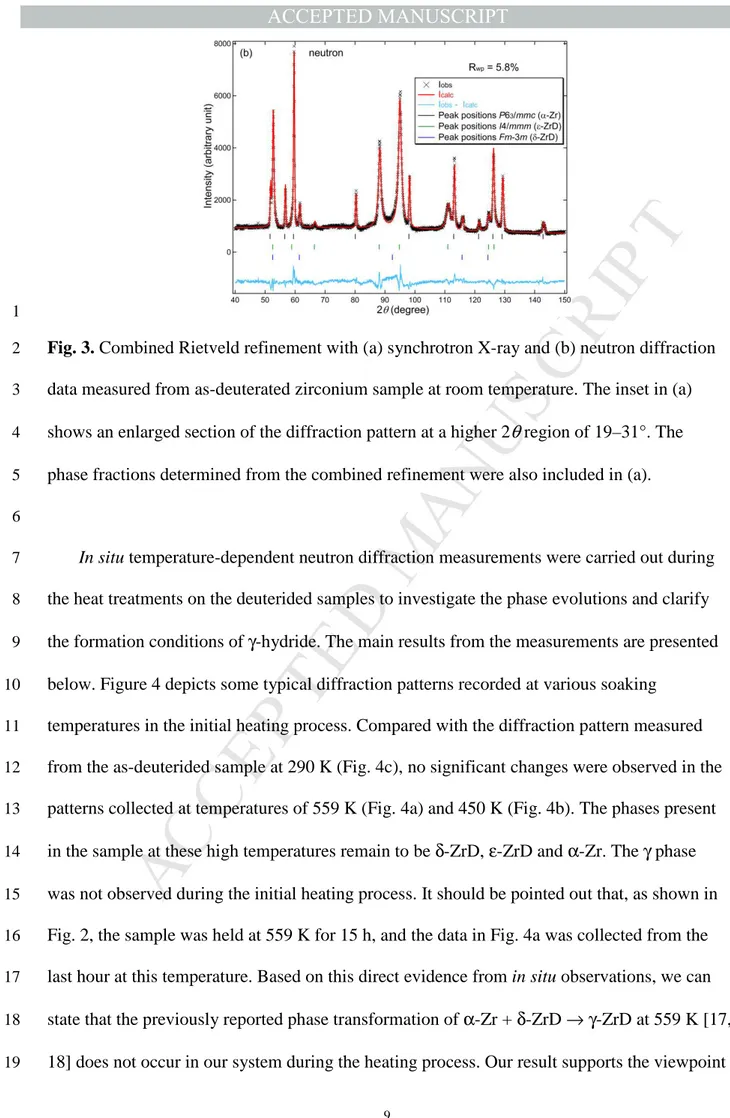
region (19–31°). The phase quantification from the 13combined refinement indicated that the δ-ZrD phase is a minor phase in the initial sample 14
with a fraction of 11.5(4) wt.%, and the majority are the α-Zr (46.5(2) wt.%) and ε-ZrD 15
(42.0(2) wt.%) phases. The lattice parameters for the observed phases from the combined 16
refinement are (i) α-Zr: a = 3.23503(1) Å, c = 5.15215(1) Å; (ii) ε-ZrD: a = 3.51213(19) Å, c 17
= 4.45543(11) Å; and (iii) δ-ZrD: a = 4.78051(5) Å, in line with the reported literature values 18
[5]. Additionally, the refinement showed a fully occupied D site (i.e., occupancy of 1.0) in the 19
M
AN
US
CR
IP
T
AC
CE
PT
ED
ε phase, suggesting that the observed ε-deuteride is a stoichiometric phase (ZrD2.0). This
1
result confirms the previous reports that the ε phase is a hydrogen-rich phase which tends to 2
form in the Zr–H system at very high hydrogen concentrations [5, 15, 29]. For the δ phase in 3
the as-deuterided sample, the D site occupancy was determined to be 0.65, corresponding to a 4
composition of δ-ZrD1.3. Here, the errors of the determined D site occupancies for the ε and δ
5
phases are very small (≤1%) and have negligible effect on the reported hydride 6
stoichiometries. Furthermore, although the D atoms cannot be distinguished by X-rays, it is 7
confirmed that the combined refinement with X-ray and neutron data as performed here does 8
not affect the accuracy of the reported occupancy factors through the comparison of the 9
results of D site occupancies from the combined refinement and the individual analysis only 10
using the neutron data. The result of the δ-hydride stoichiometry, however, is not consistent 11
with the earlier findings from the X-ray powder diffraction analysis of the zirconium hydrides 12
with the known compositions, showing a typical δ phase composition of ~ZrH1.66 [6]. The
13
different δ phase compositions observed might be attributed to the discrepancy in the phase 14
constitutions and hydrogen concentrations of the samples used in the different experiments, 15
which affects the hydrogen partition between the phases, and the site occupancy within them. 16
17
M
AN
US
CR
IP
T
AC
CE
PT
ED
1Fig. 3. Combined Rietveld refinement with (a) synchrotron X-ray and (b) neutron diffraction
2
data measured from as-deuterated zirconium sample at room temperature. The inset in (a) 3
shows an enlarged section of the diffraction pattern at a higher 2
θ
region of 19–31°. The 4phase fractions determined from the combined refinement were also included in (a). 5
6
In situ temperature-dependent neutron diffraction measurements were carried out during 7
the heat treatments on the deuterided samples to investigate the phase evolutions and clarify 8
the formation conditions of γ-hydride. The main results from the measurements are presented 9
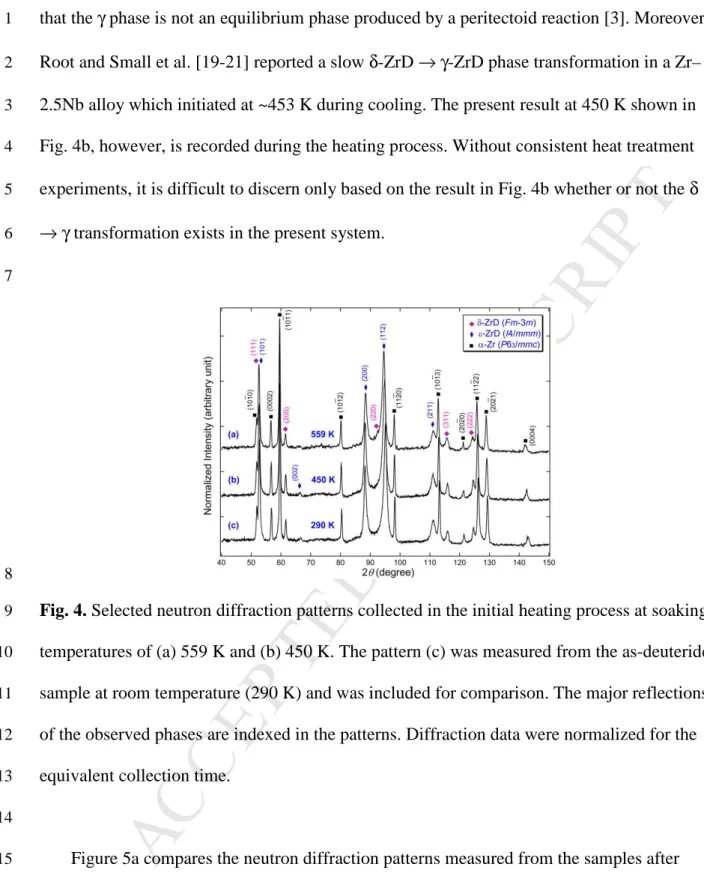
below. Figure 4 depicts some typical diffraction patterns recorded at various soaking 10
temperatures in the initial heating process. Compared with the diffraction pattern measured 11
from the as-deuterided sample at 290 K (Fig. 4c), no significant changes were observed in the 12
patterns collected at temperatures of 559 K (Fig. 4a) and 450 K (Fig. 4b). The phases present 13
in the sample at these high temperatures remain to be δ-ZrD, ε-ZrD and α-Zr. The γ phase 14
was not observed during the initial heating process. It should be pointed out that, as shown in 15
Fig. 2, the sample was held at 559 K for 15 h, and the data in Fig. 4a was collected from the 16
last hour at this temperature. Based on this direct evidence from in situ observations, we can 17
state that the previously reported phase transformation of α-Zr + δ-ZrD → γ-ZrD at 559 K [17, 18
18] does not occur in our system during the heating process. Our result supports the viewpoint 19
M
AN
US
CR
IP
T
AC
CE
PT
ED
that the γ phase is not an equilibrium phase produced by a peritectoid reaction [3]. Moreover, 1
Root and Small et al. [19-21] reported a slow δ-ZrD → γ-ZrD phase transformation in a Zr– 2
2.5Nb alloy which initiated at ~453 K during cooling. The present result at 450 K shown in 3
Fig. 4b, however, is recorded during the heating process. Without consistent heat treatment 4
experiments, it is difficult to discern only based on the result in Fig. 4b whether or not the δ 5
→ γ transformation exists in the present system. 6
7
8
Fig. 4. Selected neutron diffraction patterns collected in the initial heating process at soaking
9
temperatures of (a) 559 K and (b) 450 K. The pattern (c) was measured from the as-deuterided 10
sample at room temperature (290 K) and was included for comparison. The major reflections 11
of the observed phases are indexed in the patterns. Diffraction data were normalized for the 12
equivalent collection time. 13
14
Figure 5a compares the neutron diffraction patterns measured from the samples after 15
cooling from high temperatures to room temperature at different cooling rates. The diffraction 16
data were collected at λ = 2.4395 Å for a high angular resolution to facilitate hydride phase 17
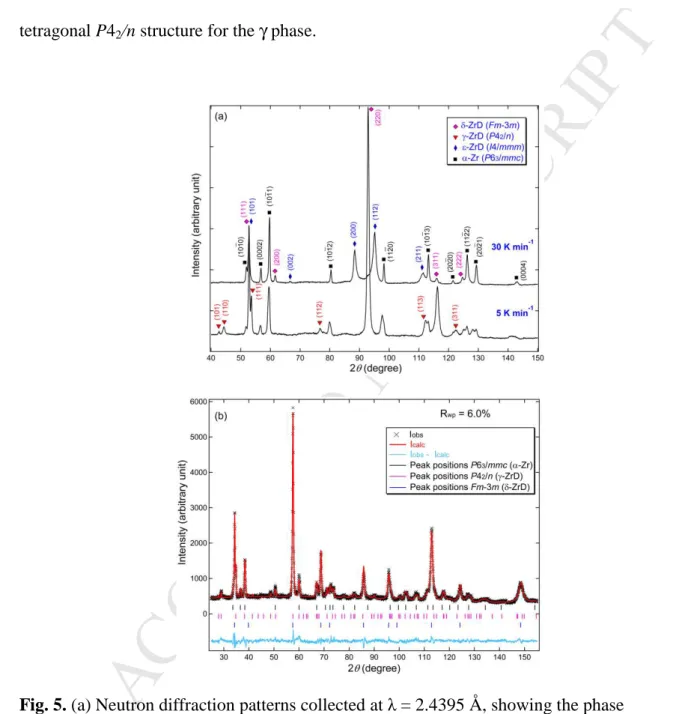
identification. When the sample was first cooled to room temperature from 559 K at a rate of 18
30 K min–1, only the α, δ and ε phases were observed whereas the expected formation of γ 19
M
AN
US
CR
IP
T
AC
CE
PT
ED
phase under this fast cooling condition was not found. In the subsequent experiment, the 1
sample was heated up to a higher temperature of 763 K to investigate whether a higher 2
temperature would facilitate the phase change and the formation of γ phase. After slowly 3
cooling to room temperature from 763 K at 5 K min–1, in addition to the α and δ phases which 4
showed some strong reflections, the γ phase was clearly detected in the sample. The 5
production method of γ phase discovered here appears to be opposite to what has been 6
reported in literature, i.e., slow cooling promotes the γ phase formation, not fast cooling. It 7
should be clarified that, although at the starting high temperatures the sample composes of α, 8
δ and ε phases in the fast cooling experiment, while in the subsequent slow cooling 9
experiment the sample consists of only α and δ phases, this conclusion is not affected by the 10
difference in the phase constitution. This is because at the starting high temperature (559 K) 11
in the fast cooling experiment the sample actually contains two phase regions of (α + δ) and (δ 12
+ ε) based on the Zr–H binary phase diagram [5], and the coexistence of the two phase 13
regions in this material would not affect the phase transformation behavior of each region 14
during fast cooling. This observation gives weight to an argument that in the present material 15
the γ phase forms by a diffusion-controlled transformation, rather than a displacive or 16
martensitic type transformation which was generally reported in dilute Zr–H alloys [13]. 17
Additionally, after slow cooling the ε-ZrD phase was found to disappear completely (Fig. 5a), 18
suggesting that ε is thermodynamically unstable and readily decomposes during slow cooling. 19
The metastable ζ-Zr2H phase, which was reported to form under both fast and slow cooling
20
conditions [8, 30], was not observed in the present experiment. 21
Figure 5b shows the Rietveld refinement of the sample after slow cooling to room 22
temperature using the neutron diffraction data collected at λ = 1.6215 Å for a high Q-range. A 23
good fit (Rwp = 6.0%) was obtained with the three-phase structural models of P63/mmc (α-Zr),
24
P42/n (γ-ZrD) and Fm3m (δ-ZrD). The refined lattice parameters for the tetragonal γ phase
M
AN
US
CR
IP
T
AC
CE
PT
ED
are a = 4.5833(5) Å and c = 4.9449(13) Å. Apart from the tetragonal P42/n structure, another
1
orthorhombic Cccm structure [16] was reported for γ-ZrD. We attempted to model the 2
measured diffraction pattern with the Cccm space group for γ-ZrD and found this model does 3
not fit well (Rwp = 7.8%), showing noticeable misfits of some reflections. This confirms the
4
tetragonal P42/n structure for the γ phase.
5 6
7
8
Fig. 5. (a) Neutron diffraction patterns collected at λ = 2.4395 Å, showing the phase
9
constitution in the deuterided samples after cooling from high temperatures to room 10
temperature at different cooling rates of 30 and 5 K min–1. (b) Rietveld refinement of the 11
neutron diffraction pattern measured at λ = 1.6215 Å from the sample cooled to room 12
temperature at a slow rate of 5 K min–1. 13
M
AN
US
CR
IP
T
AC
CE
PT
ED
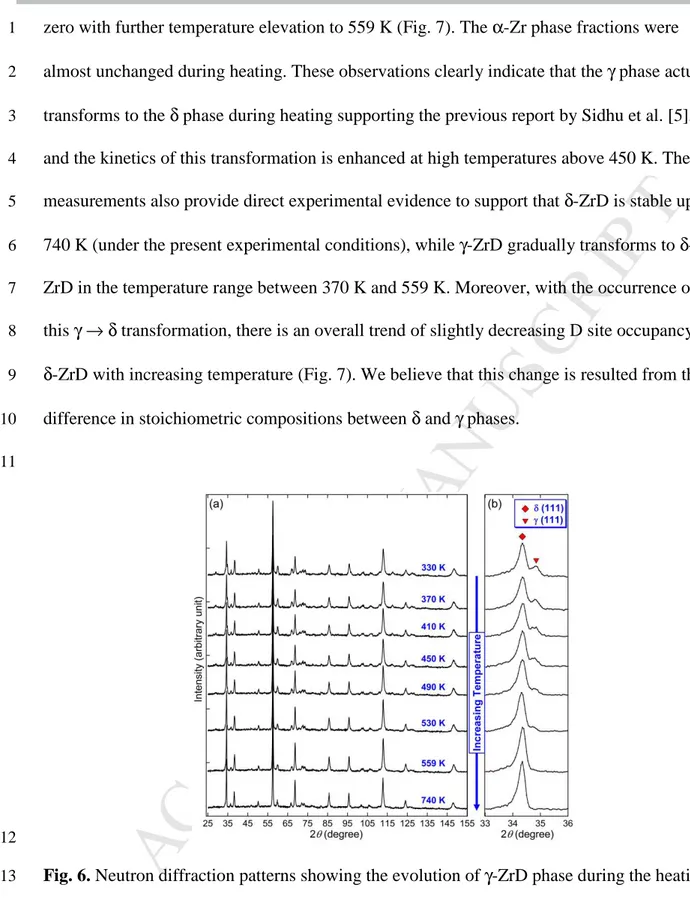
After the production of γ-ZrD with slow cooling, the sample was incrementally heated up 1
from 290 to 740 K to investigate the hydride phase evolutions during heating. Figure 6 shows 2
the measured diffraction patterns at various soaking temperatures. Each pattern was collected 3
for a soaking period of 2 h at specific temperatures. The δ phase was present throughout the 4
heating process, as evidenced by the observation of their strong reflections including the 111 5
peak at 2
θ
of approximately 34.3° and 220 at approximately 57.5° (Fig. 6a). To track the 6evolution of γ phase, the enlarged sections of the patterns near the δ-/γ-111 reflections are 7
shown in Fig. 6b. The intensities of γ-111 reflections were found to decrease gradually with 8
increasing the soaking temperature to 530 K and vanish with further soaking at 559 K, 9
indicating that γ-ZrD disappeared completely at this temperature. On the other hand, the 10
intensities of δ-111 reflections appeared to increase with increasing the soaking temperature. 11
Furthermore, it is noteworthy that the ε-ZrD phase which was present in the initial heating 12
stage (Fig. 4) and decomposed after slow cooling (Fig. 5a) has not returned in this heating 13
process. To follow the phase evolutions during this process, quantitative phase analysis was 14
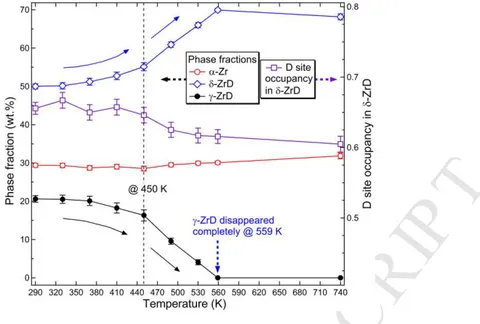
performed by the Rietveld method using the collected neutron data and the result is shown in 15
Figure 7. It reveals that, before the high-temperature treatments, δ-ZrD was the predominant 16
phase in the system at 290 K with a fraction of 50.0(6) wt.%, and the contents of the 17
remaining α-Zr and γ-ZrD phases were 29.4(3) wt.% and 20.6(7) wt.%, respectively. The 18
relative fraction of δ phase increased significantly as compared with the as-deuterided state, 19
presumably attributed to the decomposition of ε phase during slow cooling. With increasing 20
soaking temperature, the δ phase content first gradually increased in the range of 290 K to 450 21
K and then rapidly rose with further elevating temperature to 559 K. In contrast, the γ phase 22
content displays an inverse variation trend with increasing temperature, i.e., first slowly 23
decreasing with increasing temperature from 290 to 450 K and then quickly diminishing to 24
M
AN
US
CR
IP
T
AC
CE
PT
ED
zero with further temperature elevation to 559 K (Fig. 7). The α-Zr phase fractions were 1
almost unchanged during heating. These observations clearly indicate that the γ phase actually 2
transforms to the δ phase during heating supporting the previous report by Sidhu et al. [5], 3
and the kinetics of this transformation is enhanced at high temperatures above 450 K. The 4
measurements also provide direct experimental evidence to support that δ-ZrD is stable up to 5
740 K (under the present experimental conditions), while γ-ZrD gradually transforms to δ-6
ZrD in the temperature range between 370 K and 559 K. Moreover, with the occurrence of 7
this γ → δ transformation, there is an overall trend of slightly decreasing D site occupancy in 8
δ-ZrD with increasing temperature (Fig. 7). We believe that this change is resulted from the 9
difference in stoichiometric compositions between δ and γ phases. 10
11
12
Fig. 6. Neutron diffraction patterns showing the evolution of γ-ZrD phase during the heating 13
process. Note that γ-ZrD disappeared completely at 559 K while δ-ZrD phase was present at 14
high temperatures up to 740 K. 15
16 17
M
AN
US
CR
IP
T
AC
CE
PT
ED
1Fig. 7. Phase fractions of α-Zr, δ-ZrD and γ-ZrD and the D site occupancy in δ-ZrD as a 2
function of soaking temperature determined by the Rietveld refinement analysis of neutron 3
diffraction data. The dash line indicates the observed temperature (450 K) above which the 4
rate of γ- to δ-hydride phase transformation increases during heating. 5
6
Following the thermal treatment experiment with the observation of γ → δ transformation, 7
we repeated the slow cooling measurements three times to clarify whether or not the γ-ZrD is 8
reproducible during slow cooling. For this purpose, as shown in Fig. 2, the sample was first 9
cooled step-wise from 740 to 520 K with the diffraction patterns recorded at each temperature 10
step to understand the starting high temperatures at which the γ phase was not present during 11
cooling. The continuous slow cooling experiments in the last stage of in situ observations 12
were then conducted at a rate of 5 K min–1 with different starting temperatures of 520, 540 13
and 580 K. The neutron diffraction measurements revealed that only δ-ZrD and α-Zr were 14
present at these starting high temperatures. All the slow cooling experiments led to a 15
consistent observation that γ-ZrD reappeared after slow cooling to 290 K, as demonstrated in 16
a representative refinement in Figure 8 of the sample cooled from 520 K, verifying that γ-ZrD 17
is reproducible with slow cooling in the present system. Table 1 summarizes the Rietveld 18
M
AN
US
CR
IP
T
AC
CE
PT
ED
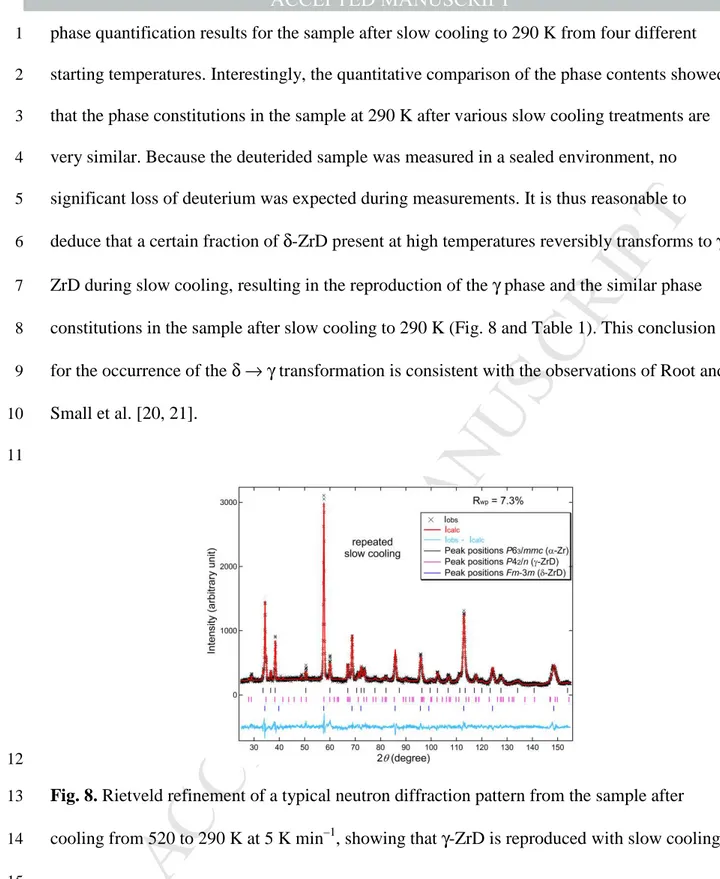
phase quantification results for the sample after slow cooling to 290 K from four different 1
starting temperatures. Interestingly, the quantitative comparison of the phase contents showed 2
that the phase constitutions in the sample at 290 K after various slow cooling treatments are 3
very similar. Because the deuterided sample was measured in a sealed environment, no 4
significant loss of deuterium was expected during measurements. It is thus reasonable to 5
deduce that a certain fraction of δ-ZrD present at high temperatures reversibly transforms to γ-6
ZrD during slow cooling, resulting in the reproduction of the γ phase and the similar phase 7
constitutions in the sample after slow cooling to 290 K (Fig. 8 and Table 1). This conclusion 8
for the occurrence of the δ → γ transformation is consistent with the observations of Root and 9
Small et al. [20, 21]. 10
11
12
Fig. 8. Rietveld refinement of a typical neutron diffraction pattern from the sample after
13
cooling from 520 to 290 K at 5 K min–1, showing that γ-ZrD is reproduced with slow cooling. 14
15
Table 1 Phase fractions of α-Zr, δ-ZrD and γ-ZrD in the sample after slowly cooling to 290 K
16
at 5 K min–1 from various elevated temperatures, determined by the Rietveld quantitative 17
phase analysis. 18
M
AN
US
CR
IP
T
AC
CE
PT
ED
1 α-Zr δ-ZrD γ-ZrD 763 K 29.4(3) 50.0(6) 20.6(7) 520 K 30.1(6) 51.6(6) 18.3(8) 540 K 30.8(6) 53.5(6) 15.7(7) 580 K 29.9(6) 50.7(8) 19.4(8) 2 3In light of the knowledge of the existence of the δ → γ transformation in the present 4
system derived from these in situ diffraction measurements, it is considered that the opposite 5
formation conditions of γ-hydride observed in the present and previous works can be 6
rationalized in the following: 7
(1) In the dilute Zr–H alloy system, the γ-hydride was mostly observed in previous 8
investigations after rapid cooling of the sample from the α-Zr phase field [11, 12]. It has been 9
often suggested the γ-hydride forms in this case by a displacive or martensitic α → γ 10
transformation which involves the displacive motion of zirconium atoms and the cooperative 11
movement of hydrogen atoms by rapid diffusion [13]. 12
(2) In the present hydrogen-rich Zr–H system with large phase fraction of δ-hydride, it is 13
confirmed the γ-hydride forms through a δ → γ transformation during slow cooling. Cassidy 14
and Wayman [31] revealed in a crystallographic study of the δ → γ transformation that 15
hydrogen atoms diffuse prior to the transformation, due to the different bulk compositions of 16
δ and γ phases. They suggested that relative to the very rapid diffusion of interstitial hydrogen 17
atoms in the metallic α-Zr phase, the hydrogen diffusivity in the δ-hydride phase is 18
considerably slower [17]. Root et al. [21] also pointed out that the dissociation of hydrogen 19 Phase fractions (wt.%) Starting temperatures in slow cooling
M
AN
US
CR
IP
T
AC
CE
PT
ED
atoms from the δ-hydride crystal lattice is the rate-limiting step of the δ → γ transformation. 1
This provides evidence that the δ → γ transformation is sluggish or diffusion-limited and thus 2
this transformation and the resultant formation of γ-hydride are favored by slow cooling. 3
Additionally, the δ → γ transformation was found to be incomplete after slow cooling 4
(Table 1), probably related to the slow migration process of hydrogen away from the δ -5
hydride in order to achieve a lower concentration of hydrogen to allow the formation of the γ -6
hydride phase. Furthermore, it should be mentioned that during slow cooling, the migration of 7
hydrogen atoms from the δ-hydride unit cell occurs simultaneously with a reduction in the 8
solubility of hydrogen in α-Zr. In this case, the released hydrogen atoms from δ-hydride may 9
not react with the surrounding α-Zr but tend to deposit on the surface of existing δ-hydrides 10
[21]. Consequently, the α-Zr phase fractions were nearly unchanged after slow cooling (Table 11 1). 12 13 4. Conclusions 14
The zirconium hydride phase evolution during thermal cycling and the formation 15
conditions of γ-hydride have been studied by in situ high-resolution neutron powder 16
diffraction with the deuterided zirconium samples containing 50 at.% deuterium. It is clarified 17
that the previously proposed peritectoid reaction α-Zr + δ-ZrD → γ-ZrD at high temperatures 18
does not occur in this material. The process method for the development of γ-hydride with the 19
present system was confirmed to be opposite to that reported before, i.e., slow cooling appears 20
to always promote the formation of γ phase, rather than fast cooling, which is consistent with 21
disordered and ordered nature of the δ- and γ- phases, respectively. The Rietveld refinements 22
justify the tetragonal P42/n structure for the γ phase produced upon slow cooling. Further, the
23
γ-hydride was found to gradually transform to δ-hydride during heating and disappeared 24
completely after soaking at 559 K. In contrast, the δ-hydride was stable at higher temperatures 25
M
AN
US
CR
IP
T
AC
CE
PT
ED
up to 740 K. Detailed phase quantification analysis by Rietveld refinements revealed that the 1
γ-hydride phase transforms to the δ phase during heating. A reversible but incomplete 2
transformation of δ- to γ-hydride is suggested to occur in the present system during slow 3
cooling, resulting in the development of γ phase. This δ → γ transformation is considered to 4
be sluggish, due to limits by the migration of hydrogen atoms away from the crystal lattice of 5
δ-hydride in order to attain a lower composition to facilitate the formation of γ phase. This 6
characteristics accounts for the favorable formation of γ-hydride after slow cooling. 7
8
Acknowledgements
9
J.E.D. acknowledges financial support through an Australian Institute of Nuclear Science 10
and Engineering (AINSE) Research Fellowship. The authors acknowledge the provision of 11
neutron beamtime by the Bragg Institute at the Australian Nuclear Science and Technology 12
Organisation (ANSTO) through experimental proposal number P1446, and X-ray beamtime 13
provided by the European Synchrotron Radiation Facility. 14
15
References
16
[1] M. Puls, Metall. Mater. Trans. A, 21 (1990) 2905-2917. 17
[2] J.J. Kearns, J. Nucl. Mater., 22 (1967) 292-303. 18
[3] D.O. Northwood, U. Kosasih, Int. Mater. Rev., 28 (1983) 92-121. 19
[4] E. Zuzek, J. Abriata, A. San-Martin, F. Manchester, J. Phase Equilib., 11 (1990) 385-395. 20
[5] S.S. Sidhu, N.S.S. Murthy, F.P. Campos, D.D. Zauberis, Nonstoichiometric Compounds, 21
American Chemical Society, 1963, pp. 87-98. 22
[6] K.G. Barraclough, C.J. Beevers, J. Nucl. Mater., 34 (1970) 125-134. 23
[7] A. Steuwer, J.R. Santisteban, M. Preuss, M.J. Peel, T. Buslaps, M. Harada, Acta Mater., 24
57 (2009) 145-152. 25
[8] Z. Zhao, J.P. Morniroli, A. Legris, A. Ambard, Y. Khin, L. Legras, M. Blat-Yrieix, J. 26
Microsc., 232 (2008) 410-421. 27
M
AN
US
CR
IP
T
AC
CE
PT
ED
[9] Z. Wang, U. Garbe, H. Li, Y. Wang, A.J. Studer, G. Sun, R.P. Harrison, X. Liao, M.A. 1
Vicente Alvarez, J.R. Santisteban, C. Kong, J. Appl. Crystallogr., 47 (2014) 303-315. 2
[10] Z. Wang, U. Garbe, H. Li, R.P. Harrison, K. Toppler, A.J. Studer, T. Palmer, G. 3
Planchenault, J. Nucl. Mater., 436 (2013) 84-92. 4
[11] C.E. Ells, J. Nucl. Mater., 28 (1968) 129-151. 5
[12] I.F. Ferguson, J.E. Bailey, B.J. Gill, J. Appl. Crystallogr., 6 (1973) 351-354. 6
[13] G.C. Weatherly, Acta Metall., 29 (1981) 501-512. 7
[14] L. Lanzani, M. Ruch, J. Nucl. Mater., 324 (2004) 165-176. 8
[15] R.S. Daum, Y.S. Chu, A.T. Motta, J. Nucl. Mater., 392 (2009) 453-463. 9
[16] A.I. Kolesnikov, A.M. Balagurov, I.O. Bashkin, A.V. Belushkin, E.G. Ponyatovsky, M. 10
Prager, J. Phys.: Condens. Matter, 6 (1994) 8977-8988. 11
[17] S. Mishra, K.S. Sivaramakrihnan, M.K. Asundi, J. Nucl. Mater., 45 (1972) 235-244. 12
[18] I.O. Bashkin, V.Y. Malyshev, M.M. Myshlyaev, Sov. Phys. Solid State, 34 (1992) 1182-13
1184. 14
[19] J.H. Root, R.W.L. Fong, J. Nucl. Mater., 232 (1996) 75-85. 15
[20] W.M. Small, J.H. Root, D. Khatamian, J. Nucl. Mater., 256 (1998) 102-107. 16
[21] J.H. Root, W.M. Small, D. Khatamian, O.T. Woo, Acta Mater., 51 (2003) 2041-2053. 17
[22] S.C. Lumley, R.W. Grimes, S.T. Murphy, P.A. Burr, A. Chroneos, P.R. Chard-Tuckey, 18
M.R. Wenman, Acta Mater., 79 (2014) 351-362. 19
[23] W. Zhu, R. Wang, G. Shu, P. Wu, H. Xiao, J. Phys. Chem. C, 114 (2010) 22361-22368. 20
[24] T. Maimaitiyili, J. Blomqvist, A. Steuwer, C. Bjerkén, et al., submitted. 21
[25] V.F. Sears, Neutron News, 3 (1992) 26-37. 22
[26] E.A. Gulbransen, K.F. Andrew, J. Electrochem. Soc., 101 (1954) 560-566. 23
[27] K.-D. Liss, B. Hunter, M. Hagen, T. Noakes, S. Kennedy, Physica B, 385–386, Part 2 24
(2006) 1010-1012. 25
[28] A.A. Coelho, TOPAS, Bruker AXS, 2008. 26
[29] Z. Wang, U. Garbe, H. Li, A.J. Studer, R.P. Harrison, M.D. Callaghan, Y. Wang, X. Liao, 27
Scripta Mater., 67 (2012) 752-755. 28
[30] Z. Zhao, M. Blat-Yrieix, J.P. Morniroli, A. Legris, L. Thuinet, Y. Kihn, A. Ambard, L. 29
Legras, J. ASTM Int., 5 (2008) 1-20. 30
[31] M.P. Cassidy, C.M. Wayman, Metall. Mater. Trans. A, 11 (1980) 47-56. 31
32
Figure captions
M
AN
US
CR
IP
T
AC
CE
PT
ED
Fig. 1. Crystallographic structures and common formulae of four different hydrides (ζ, γ, δ
1
and ε) found in the Zr–H system [22]. The larger green and smaller grey spheres represent the 2
Zr and H atoms, respectively. The δ-hydride shown in the phase diagram (after Ref. [4]) is a 3
non-stoichiometric phase which was reported to have a typical H/Zr ratio of ~1.66 and a 4
disordered CaF2-protype structure with the hydrogen atoms partially occupying the eight
5
available tetrahedral sites at random. The γ-hydride (ZrH1.0) was identified to have a
6
tetragonal structure with the ordered arrangements of hydrogen atoms at the tetrahedral 7
interstitial sites. 8
Fig. 2. Thermal profile used in the neutron diffraction experiments. The figure numbers were
9
included to show which diffraction data were presented in this work at a specific temperature. 10
Fig. 3. Combined Rietveld refinement with (a) synchrotron X-ray and (b) neutron diffraction
11
data measured from as-deuterated zirconium sample at room temperature. The inset in (a) 12
shows an enlarged section of the diffraction pattern at a higher 2
θ
region of 19–31°. The 13phase fractions determined from the combined refinement were also included in (a). 14
Fig. 4. Selected neutron diffraction patterns collected in the initial heating process at soaking
15
temperatures of (a) 559 K and (b) 450 K. The pattern (c) was measured from the as-deuterided 16
sample at room temperature (290 K) and was included for comparison. The major reflections 17
of the observed phases are indexed in the patterns. Diffraction data were normalized for the 18
equivalent collection time. 19
Fig. 5. (a) Neutron diffraction patterns collected at λ = 2.4395 Å, showing the phase
20
constitution in the deuterided samples after cooling from high temperatures to room 21
temperature at different cooling rates of 30 and 5 K min–1. (b) Rietveld refinement of the 22
neutron diffraction pattern measured at λ = 1.6215 Å from the sample cooled to room 23
temperature at a slow rate of 5 K min–1. 24
M
AN
US
CR
IP
T
AC
CE
PT
ED
Fig. 6. Neutron diffraction patterns showing the evolution of γ-ZrD phase during the heating
1
process. Note that γ-ZrD disappeared completely at 559 K while δ-ZrD phase was present at 2
high temperatures up to 740 K. 3
Fig. 7. Phase fractions of α-Zr, δ-ZrD and γ-ZrD and the D site occupancy in δ-ZrD as a
4
function of soaking temperature determined by the Rietveld refinement analysis of neutron 5
diffraction data. The dash line indicates the observed temperature (450 K) above which the 6
rate of γ- to δ-hydride phase transformation increases during heating. 7
Fig. 8. Rietveld refinement of a typical neutron diffraction pattern from the sample after
8
cooling from 520 to 290 K at 5 K min–1, showing that γ-ZrD is reproduced with slow cooling. 9
10
List of Table
11
Table 1 Phase fractions of α-Zr, δ-ZrD and γ-ZrD in the sample after slowly cooling to 290 K
12
at 5 K min–1 from various elevated temperatures, determined by the Rietveld quantitative 13
phase analysis. 14
M
AN
US
CR
IP
T
AC
CE
PT
ED
Highlights• The zirconium hydride phase evolution during thermal cycling was studied. • Slow cooling was found to promote the γ-hydride formation, not fast quenching. • We suggest a possible explanation for the observed γ-hydride formation.
• The produced γ-hydride was unstable and transformed to δ-hydride during heating. • The δ-hydride was stable at high temperatures up to 740 K.