As-cast AZ91D Magnesium Alloy
Properties- Effect of Microstructure
and Temperature
Hoda Dini
Department of Materials and Manufacturing
SCHOOL OF ENGINEERING, JÖNKÖPING UNIVERSITY Jönköping, Sweden 2015
As-cast AZ91D Magnesium Alloy Properties-
Effect of Microstructure and Temperature
Hoda Dini
Department of Materials and Manufacturing School of Engineering, Jönköping University SE-551 11 Jönköping, Sweden
hoda.dini@ju.se
Copyright © Hoda.Dini
Research Series from the School of Engineering, Jönköping University Department of Materials and Manufacturing
Dissertation Series No 10, 2015 ISBN 978-91-87289-11-8
Published and Distributed by
School of Engineering, Jönköping University Department of Materials and Manufacturing SE-551 11 Jönköping, Sweden
Printed in Sweden by Ineko AB
“The journey of a thousand miles begins with one step.”
-Rumi
To my parents,
who had given me dreams to look forward to
ABSTRACT
Magnesium and magnesium alloys are used in a wide variety of structural applications including automotive, aerospace, hand tools and electronic industries thanks to their light weight, high specific strength, adequate corrosion resistance and good castability. Al and Zn are the primary alloying elements in commercial Mg alloys and commonly used in automotive industries. AZ91 is one of the most popular Mg alloys containing 9% Al and 1% Zn. Hence, lots of research have been done during last decades on AZ91D. However, the existing data concerning mechanical properties and microstructural features showed large scatter and is even contradictory.
This work focused on the correlation between the microstructure and the mechanical properties of as-cast AZ91 alloy. An exhaustive characterization of the grain size, secondary dendrite arm spacing (SDAS) distribution, and fraction of Mg17Al12 using optical and electron
backscattered diffraction (EBSD) was performed. These microstructural parameters were correlated to offset yield point (Rp0.2), fracture strength and elongation to fracture.
It was understood that the intermetallic phase, Mg17Al12, plays an important role in determining
the mechanical and physical properties of the alloy at temperature range from room temperature up to 190oC. It was realized that by increasing the Mg
17Al12 content above 11% a
network of intermetallic may form. During deformation this rigid network should break before any plastic deformation happen. Hence, increase in Mg17Al12 content resulted in an increase in
offset yield point. The presence of this network was supported by study of thermal expansion behaviour of the alloy containing different amount of Mg17Al12.
A physically-based model was adapted and validated in order to predict the flow stress behaviour of as-cast AZ91D at room temperature up to 190ºC for various microstructures. The model was based on dislocation glide and climb in a single-phase (matrix) material containing reinforcing particles. The temperature dependant variables of the model were quite well correlated to the underlying physics of the material.
Keywords: Magnesium alloys, As-cast, AZ91D, Mechanical properties, Microstructural scale effect, Physical modelling
ACKNOWLEDGEMENTS
I praise God, the almighty for providing me this opportunity and granting me the capability to proceed successfully.
I would like to express my deep sense of respect and gratitude to Prof. Anders Jarfors, my main supervisor, for his invaluable and fruitful constructive suggestions and guidance that have enabled me to overcome all the problems and difficulties while carrying out the present work. He stayed along with me and motivated constantly and stimulated me to the fullest extent. I feel fortunate for his support and involvement and this is virtually impossible to express them in words
I also express my gratitude to Assistant Prof. Nils-Erik Andesson, my supervisor, for the valuable comments and advices and for continuous support during this study. Thanks for all the time has dedicated for me within his busy schedule and thanks to his patience in answering my stupid questions.
I like to thank Dr. Ehsan Ghassemali for his help regarding EBSD experiments and his nice suggestions and advices.
I am thankful to Associate Prof Ales Svoboda for helping me with the modelling parts. I wish to thank Toni Bogdanoff, Lars Johansson and Esbjörn Ollas for helping me with the experimental work. I thank Jörgen Bloom for his great assistance with experiments carried out at Husqvarna AB.
The industrial partner Husqvarna AB and Pär Guth are acknowledged for providing necessary data and materials.
The KK-stiftelsen (The Knowledge Foundation) is acknowledged for the financial support under CompCast project (Dnr 20100280).
My warmest thanks to my colleagues and friends at Jönköping University. My doctoral studies become more joyful with you through all of lunches, fikas and parties that we had.
Heartfelt thanks to my parents, brother, sister and my in-laws, who always concern about my progress, for their encouragement and support. Last but not the least, I thank my husband, Reza, life with his love is much more delightful to live.
Hoda Dini Jönköping 2015
SUPPLEMENTS
The following supplements constitute the basis of this thesis:Supplement I H. Dini, N. Andersson, A.E.W .Jarfors; Effects of Microstructure on Deformation Behaviour of AZ91D Cast Alloy. TMS 2014, 143rd ANNUAL MEETING & EXHIBITION February 16-20, San Diego, CA, USA.
Dini was the main author. Andersson and Jarfors contributed with supervision and advice on method of analysis.
Supplement II H. Dini, N. Andersson, E. Ghassemali, A.E.W. Jarfors; Microstructural Scale Effects on Thermal Expansion Behaviour of Cast AZ91D. Magnesium Technology 2015, 361-365. TMS 2015. March 15th-19th, Orlando, FL, USA.
Dini was the main author. Andersson and Jarfors contributed with supervision and advice on method of analysis. Ghassemali helped with the EBSD results.
Supplement III H. Dini, N. Andersson, A.E.W. Jarfors; Effect of Mg17Al12 content on
mechanical properties of AZ91D cast alloy, submitted to the Scripta Materialia.
Dini was the main author. Andersson and Jarfors contributed with supervision and advice on method of analysis.
Supplement IV H. Dini, A. Svoboda, N. Andersson, E. Ghassemali, L. Lindgren, A.E.W.
Jarfors; Dislocation Density Model for Flow Stress of AZ91D Magnesium Alloy-Effect of Temperature and Microstructure, submitted to the International Journal of Plasticity.
Dini was the main author. Svoboda and Lindegren contributed in adaption and optimization of the model. Ghassemali helped with the EBSD results. Andersson and Jarfors contributed with supervision and advice on method of analysis.
The following supplement is not included in this thesis:
Supplement V M. Zamani, H. Dini, A. Svoboda, L. Lindgren, S. Seifeddine, N. Andersson,
A.E.W. Jarfors; A Dislocation Density Based Model for as-cast Al-Si based Cast Alloys during High Temperature Deformation – The Microstructural Effects, submitted to the journal of Mechanics of Materials.
Zamani was the main author. Dini, Svoboda and Lindegren contributed in development and optimization of the model. Seifeddine, Andersson and Jarfors contributed with supervision and advice on method of analysis.
TABLE OF CONTENTS
CHAPTER 1: 1INTRODUCTION ... 3
1.1 MAGNESIUM ALLOYS ... 3
1.2 MG-AL BASED ALLOYS ... 4
1.3 DEFORMATION MECHANISMS OF MAGNESIUM ALLOYS ... 6
1.4 MECHANICAL PROPERTIES OF MG-AL ALLOYS ... 8
1.5 DEFORMATION MODELLING OF MAGNESIUM ALLOYS ... 9
CHAPTER 2: RESEARCH APPROACH ... 15
2.1 PURPOSE AND AIM ... 15
2.2 RESEARCH DESIGN ... 15
2.3 MATERIAL AND EXPERIMENTAL PROCEDURE ... 18
CHAPTER 3: SUMMARY OF RESULTS AND DISCUSSION ... 21
3.1 MICROSTRUCTURE CHARACHTERIZATION ... 21
3.2 MECHANICAL CHARACTERIZATION ... 24
3.3 COEFFICIENT OF THERMAL EXPANSION ... 31
3.4 PHYSICAL MODELLING OF AZ91D FLOW CURVES ... 35
CHAPTER 4: CONCLUSIONS ... 45
CHAPTER 5: FUTURE WORK ... 47
REFERENCES...… ... 49
CHAPTER 1
INTRODUCTION
CHAPTER INTRODUCTION
The background of present study with special focus on AZ91D alloy is described. General microstructural features and mechanical properties of the alloy are presented. A constitutive model based on the evolution of immobile dislocation which has been used for describing plastic flow of the alloy is introduced.
1.1 MAGNESIUM ALLOYS
Magnesium alloys have the lowest density (<1.8 g/cm3) of all the structural metals. Increasing their use in automobile and aircraft parts would increase energy efficiency by weight saving [1]. Magnesium is also the 8th most abundant element on the Earth, is easy to machine and is potentially recyclable [2]. The poor creep properties above 120oC is the main challenge with
utilizing more Mg alloys in automotive stems [3]. Enhancing the creep resistance of magnesium alloys has therefore been the subject of various researches with the focus on influence of alloy composition with a view of improving creep resistance [4-6]. The most widely alloying element is aluminium, which is relatively not expensive, has a low density and strong strengthening effect on magnesium. Hence, most commercial Mg alloys are based on Mg-Al system, with small addition of other alloying elements, such as Zn, Mn, Si and rare earth to reach certain application requirements.
Although wrought magnesium alloys have higher mechanical strength than as-cast Mg alloys, they exhibit higher mechanical anisotropy which is detrimental to forming processes. Moreover, the processing of wrought Mg alloys into their final shape is more complex [7] Hence, currently, Mg components are mostly produced by casting [8, 9] since this is the most cost-efficient process. However, poor mechanical performance of as-cast Mg alloys is the main concern in their application. The poor mechanical behaviour is mainly due to the presence of porosity and microstructural inhomogeneities such as variation in grain size and phase distribution [10-15] Hence, various attempt has been carried out to relate microstructure to mechanical performance in Mg casting both by experimental [11-17] and modelling [11, 18-21] approaches. However, despite all of the studies in this area, a large scatter in data has been observed which means that a significant effort is still required to establish a quantitative relations between the microstructure and mechanical properties of magnesium alloys.
In conclusion, further works are required in order to i) understand the clear correlation between the microstructural feature and mechanical behaviour of Mg alloys and accordingly have a modelling tool to predict these behaviour ii) optimize manufacturing technique and thus improve the quality of magnesium cast parts.
1.2 MG-AL BASED ALLOYS
Aluminium is alloyed with magnesium to increase strength, castability and corrosion resistance. A maximum solid solubility of aluminium in magnesium is 12.7 wt% at 437oC (Figure 1) and then its solubility decreases to around 2% at room temperature. Hence, after a precipitation hardening treatment, an incoherent, coarse precipitates of the equilibrium Mg17Al12 phase will
formed [22].
In order to improve fluidity and room temperature strength Zink is often added to Mg-Al alloys. Zinc also assists to reduce the corrosive effect of iron and nickel. However, addition of Zn in concentration higher than 1.0-1.5% to magnesium alloys containing 7 to 10% Al leads to hot cracking effect [22].
Manganese is another element that always alloyed with both Mg-Al and Mg-Al-Zn alloys in order to reduce impurities from iron and other heavy metal and turn them to Al-Mn-Fe intermetallic compounds. These intermetallic may settle down during alloy production. The concentration of Mn strongly depends upon Al concentration in the Mg-Al-Zn alloy because solubility of Mn in liquid magnesium sharply decreases with increasing Al content [22].
Figure 1. Mg-Al phase diagram after reference [23].
AZ91D (9% Al and 1% Zn) is one of the most common alloy in the Mg-Al-Zn alloying system. The microstructure and phase transformation tacking place during solidification of AZ91D
alloy is studied in depth trough the literatures [24-26]. It has been revealed that microstructure of all as-cast AZ91D constituents of hypoeutectic Mg-Al solid solution, eutectic Mg-Al supersaturated solid solution, and Mg17Al12 phase. These phases are obtained from
non-equilibrium solidification conditions.
Under equilibrium conditions, AZ91D alloy should solidify with the formation of only hypoeutectic Mg-Al solid solution (Figure 1). However, the slow diffusion of aluminium under non- equilibrium solidification conditions leads to the formation of eutectic Mg17Al12 phase and
Al-rich eutectic Mg-Al solid solution [27].
Under non-equilibrium solidification it is assumed that at the interface of the liquid/solid each phase has the chemical composition identified from the equilibrium phase diagram, but diffusion is not allowed in the solid, but in the liquid composition is uniform due to convection [28].
In addition, The morphology of eutectic structure formed under non-equilibrium cooling conditions is different from typical eutectic morphology formed under eutectic solidification [29]. Here, a divorced eutectic structure is formed instead of the typical lamellar eutectic morphology [30].
In rapid solidification, the eutectic phase of Mg17Al12 can form as a separate large particles with
different shapes around the primary Mg-Al solid solution. It was indicated that the aluminium content of the Mg-Al solid solution can vary from 3-4% in the bulk to more than 10% in the vicinity Mg17Al12 phase. In ingot casting due to slow cooling rate discontinuous precipitation
can also take place in solid state. However, no discontinuities precipitation occurs in die casting due to high cooling rate [28]. The microstructure of die cast AZ91D alloy consists of hypoeutectic Mg-Al solid solution grains along with eutectic Mg17Al12 particles surrounded by
islands of eutectic Mg-Al supersaturated solid solution [28, 31, 32]. Figure 2 shows the solidification sequences of AZ91D alloy with ingot casting and die casting.
Figure 2. Solidification sequences of AZ alloys after reference [31].
The solidification sequences of ingot casting AZ91D alloys will be described as follows: Solidification of hypoeutectic magnesium solid solution from molten liquids starts at 595oC and
followed by the formation of the first Mg-Al solid solution crystals having about 1.5% Al. As the alloy cools down, crystals of hypoeutectic Mg-Al solid solution increases in size, with each layer of atoms added to the crystal surface being richer in aluminium than the preceding layer. When temperature of 470oC is reached (at which freezing would be complete according to the
equilibrium diagram) the crystals have about 1.5% Al at the centre, but approximately 9% at the surface. Thus, the average composition is somewhere between 1.5 and 9% Al, although freezing is not yet complete. Further cooling increases the size of hypoeutectic Mg-solid solution crystals and the chemical composition of the outside of the crystals reaches about 12% Al when the temperature reaches the eutectic temperature about 437oC. At this temperature
the growth of hypoeutectic Mg-solid solution is terminated and grains exhibit rich and Al-poor regions [22]. Hence, the growth of Mg-Al solid solution is completed at 437oC and liquid
reaches eutectic temperature solidifying as two phases: eutectic Mg-Al solid solution and Mg17Al12 intermetallic. Depending on the subsequence cooling rate in the solid state, the
eutectic Mg-solid solution can experience a discontinuous decomposition with formation of Mg17Al12 intermetallic in lamellar form due to decreasing aluminium solubility in magnesium-
aluminium solid solution or remains as supersaturated solid solution at room temperature due to slow diffusion rate of aluminium in magnesium. Accordingly, cooling rate has effect on grain size, secondary dendrite arm spacing (SDAS) and the fraction of Mg17Al12. Figure 3 shows the
typical microstructure of AZ91D.
Figure 3. Microstructure of AZ91D.
1.3 DEFORMATION MECHANISMS OF MAGNESIUM ALLOYS
According to von Mises criterion [9] more than 5 independent slip systems are needed for metals to deform uniformly and without failure at grain boundaries. Magnesium alloys have a hexagonal closed pack (HCP) structure. Therefore, only a limited number of slip systems are available to accommodate plastic deformation. At room temperature, magnesium alloys have four independent slip systems, and the remaining deformation is accommodated by twinning. However, at elevated temperatures additional slip systems become active, providing sufficient independent systems and hence ductility at elevated temperatures will be improved.
Mg17Al12
Primary
α
Role of Slip in Deformation
Figure 4 shows the slip planes (basal, prism and pyramidal) in magnesium alloys [9, 33]. Slip occurs when the resolved shear stress on the slip plane reaches the critical value for that particular system. The critical resolved shear stress (CRSS) for non-basal slip system is much greater than basal slip system at room temperature. Hence, magnesium can be deformed easily within their basal planes at room temperature. Only two independent slip systems exist along slip direction 〈112̅0〉 , see Table 1. The pyramidal 〈𝑎〉 slip produces identical shape change as produced by combined basal slip and prismatic 〈𝑎〉 slip, the resulting number of independent slip systems from all three deformation modes are still 4 [9] and thus cannot accommodate deformation along 〈𝑐〉 direction to fulfil criterion stated by von Mises. Therefore, some other non-basal slip systems having a component in c-direction (Table 1) should be activated [34] or the deformation should occur by twinning [33].
Figure 4.Unit Cell and slip planes in Mg after reference [33].
At elevated temperature above 200oC, the critical resolved shear stress for non-basal system
rapidly decreases, and secondary slip systems {11̅00}〈112̅0〉 prismatic and {11̅01}〈1120〉 pyramidal (see Table1) become active. The larger burger vectors of (𝑐 + 𝑎) and small pyramidal plane distance at room temperature makes the activation of pyramidal slip system quite difficult but increasing the temperature will ease the activation process of pyramidal slip system [34]. These additional slip planes explain the increasing ductility at elevated temperature. Table 1. Independent dislocation systems in HCP metals [33].
Direction Plane Notation independent modes Number of
〈𝑎〉 Basal {0002}〈112̅0〉 2 〈𝑎〉 Prismatic {11̅00}〈112̅0〉 2 〈𝑎〉 Pyramidal, 1st order {11̅01}〈112̅0〉 4 〈𝑎〉 + 〈𝑐〉 Pyramidal, 2nd order {101̅1}〈112̅3̅〉 4 〈𝑎〉 + 〈𝑐〉 Pyramidal, 2nd order {21̅1̅1}〈112̅3̅〉 4 〈𝑎〉 + 〈𝑐〉 Pyramidal, 2nd order {112̅2}〈112̅3̅〉 4 Deformation by Twinning
Twinning is an important deformation mechanism in HCP (hexagonal close packed) materials at room temperature. Twinning is a deformation mechanism where a portion of the original crystal will take up a new orientation under shearing and produce a mirror image of the parent
crystal [35]. However, it is more dominant in wrought alloys with presence of texture in microstructure or mainly under compression flow stress. Hence, twinning is not a major deformation mechanism in as-cast AZ91D under conditions of practical interest of this study.
1.4 MECHANICAL PROPERTIES OF MG-AL ALLOYS
As mentioned earlier, the microstructure of as-cast Mg-Al in initial state is consist of solid solution and Mg17Al12 phases. The Mg17Al12 phases precipitates at grain boundaries during
deformation in the form of fine precipitates which are known to increase the strength by suppressing basal slip [36] These precipitated Mg17Al12 phases are perpendicular to the basal plan
[37] (main slip system of α-magnesium matrix) and make the dislocations movement more difficult and hence increases the strength of the alloy [38].
The main challenge in application of Mg-Al–based alloys is the poor mechanical properties at high-temperature and particularly creep resistance at temperature above 120oC. It is indicated
by literatures [6, 32, 39-41] that the low creep resistance of Mg-Al–based alloys is attributed to
the poor thermal stability ofMg17Al12 phase. Zhu et al.[16] reported that Mg17Al12 precipitates tend
to coarsen at elevated temperatures, thus losing their strengthening effect. Discontinuous precipitation can result to grain boundary sliding at elevated temperature. The Mg17Al12 phase at
grain boundaries may decompose at elevated temperatures which will increase the content of aluminium in these regions. Consequently, the failure will happen in these regions [38]. Moreover, it is reported that at the interface of Mg17Al12/magnesium matrix micro cracks may nucleate due to
not compatible bcc structure of Mg17Al12 and hcp structure of matrix. This leads to a limited ductility
of the alloy [38]. However, it is reported that temperatures lower than 120oC are not high enough
to soften Mg17Al12 particles or to weaken solid-solution hardening and hence the contribution
of grain-boundary sliding is not noticeable [42, 43].
Regev et al [44-46] indicated that for pressure die cast alloys (with grain size of 15 µm) and ingot cast alloys (with grain size of 300 µm) at the temperature range from 70oC to 200oC, low stress
creep deformation is dominated by grain boundary sliding. However, at higher stress levels (
3
10 E
), dislocation climb becomes the governing creep mechanism. The deformation behavior of the AZ91D at stress levels higher than what is required for creep with a relatively low temperature has not been extensively studied. At this condition, the diffusivity is limited and the main deformation mechanism is dislocation glide [47].
Moreover, changing the grain size influences the deformation map of the material [47]. Although the mechanical behaviour of Mg-Al produced by die casting has been extensively investigated and discussed [44, 45, 48-50], some studies [44, 49-53] have shown that alloys of similar composition produced with different cooling rates or different technologies can exhibit a quite different behaviour due in particular to microstructural features such as volume fraction, distribution and coarseness of the Mg17Al12 , α- grain sizes and Al content in solid solution.
However, to the best knowledge of author, the correlation between microstructural features and mechanical behaviour has not been clearly established for the AZ91 cast alloy. This knowledge is essential for selecting manufacturing techniques. Moreover, detailed description of material behaviour in a wide range of temperature and strain rate is crucial for simulation of deformation process. For this particular purpose, using physically-based models capable of correlating microstructural features to the mechanical response is preferred [54]. The physically-based model which has been used for describing plastic flow of AZ91D alloy is introduced in following section.
1.5 DEFORMATION MODELLING OF MAGNESIUM ALLOYS
Constitutive models adequately representing the deformation behaviour of engineering materials under combination of thermal and mechanical loading are crucial for obtaining accurate results in simulations of manufacturing and service. The constitutive models are mathematical description of physical phenomena and hence, different modelling approaches exist.
Commonly, the deformation behaviour of metals is represented by an empirical relationship, mostly in terms of the power law of strain and strain rate [55-57]. The empirical relations are usually lacking in predictive capabilities beyond the derived range of experimental conditions at which they were curve-fitted. Models which are related to the underlying physics of the deformation are therefore preferable. The advantage of using physically-based models is an expected larger domain of validity since these models have predicting capability outside the range of experimental data used for calibration, provided that the deformation mechanisms included in the models are describing the dominating deformation behaviour correctly [58]. The physical model which will be presented in following section includes a coupled set of evolution equations for the internal state variables, dislocation density and vacancy concentration. The concept of the dislocation density is the amount (length) of dislocations for a representative volume element divided by its volume. The model considers two different densities, a mobile and an immobile dislocation density. Change in density of immobile dislocation is related to slip system and the thermally activated annihilation by the climb of the dislocations. The immobilization rate of mobile dislocations is a function of microstructure, strain rate and temperature. The recovery process occurs with climb [59] and glide of dislocations [60]. The diffusion of vacancies, which usually takes place at elevated temperature, is a dominant factor in the recovery process of dislocations. The high concentration of vacancies near grain boundaries enhances creep controlled by dislocation glide and climb processes [61]. These internal state variables are used instead of accumulated effective plastic strain, commonly used in phenomenological models. The concept of the dislocation density is the amount (length) of dislocations for a representative volume element divided by its volume. The model considers two different densities, a mobile and an immobile dislocation density.
Modelling of flow stress
The flow stress is consist of two part, i) a component due to long-range barriers, 𝜎𝐺, that cannot be assisted by thermal energy and ii) a component due to short-range barriers, 𝜎∗, which is thermally activated. Hence, the flow stress in Eq.1 is defined as the combination of components of resistance to the motion of dislocations [62-64].
y G (1)
Long range flow stress contribution is related to the interaction of immobile dislocations in substructure and it can be written as [62]:
i G m
Gb
where m is the Taylor orientation factor and 𝛼 is a proportionality factor and 𝜌𝑖 is the immobile dislocation density. The shear modulus,G, can be computed from the Young’s modulus E and Poisson ratio
as,) 1 ( 2 E G
(3)The short-range term in Eq.1 is the thermally activated flow stress component. It is the stress needed for a dislocation to pass short-range obstacles and to move it through the lattice. The total transient time taken by a dislocation to move over a distance between two obstacles consists of a waiting time and a travel time. The moving dislocation has the waiting time in front of an obstacle before it manages to pass the obstacle and then moves to the next one. The travel time is small compared to the waiting time and is assumed to be negligible. The waiting time is the inverse of the frequency of the successful jumps to overcome the obstacles. This frequency is related to the probability, defined by the Boltzmann law of energy distribution, that the dislocation has an energy that exceeds the needed activation energy to overcome the obstacles. The waiting time and thereby the average velocity is assumed to depend on the Gibbs free-energy of activation G for cutting or by-passing of obstacles [65],
and on the temperature T. The average velocity is defined as:
kT G exp a
(4)where is the mean free path, υa is the attempt frequency,G is the activation energy, k is
the Boltzmann constant and T is the temperature in Kelvin. The dislocation density and velocity is related to plastic strain rate via the Orowan equation [66]:
m b
m
p
(5)where is the average velocity of mobile dislocations having a density ,m. The Eq.5 relations
can be written as:
kT G m b a m p exp (6)
The motion of dislocations is facilitated by thermal energy. If the stress is insufficient to drive a dislocation pass a barrier having activation energyG, the probability that a dislocation will
jump over the barrier increases with increased temperature. Different shapes of barrier energy distribution results in different constitutive equations. A generalized equation for these shapes was proposed by Kocks et al [67] with two parameters, p and q, and is given by:
q p ath 1 F G (7)
Here, F is the total free energy required for a dislocation to overcome the lattice resistance or
obstacles. The quantity σath is the athermal flow strength that must be exceeded in order to
move dislocations across the lattice without the aid of thermal energy. The exponents 0 < p ≤
1 and 0 < q ≤ 2 are related to the shape of energy barriers. The pre-exponential term in Eq.6,
which is approximated following Frost and Ashby [65] to be constant, is expressed as
m b a m ref (8)
where ref is the reference strain rate. Combining (6) with (7) and (8) yields to:
q p ath ref p 1 kT F exp (9)
Here, ΔF = Δf0Gb3is the activation energy necessary to overcome lattice resistance in the absence
of any external force and σath = τ0G is the shear strength in the absence of thermal energy. Some
guidelines regarding of Δf0 and τ0 are given in Table 2 [65]. Here, L is the mean spacing of the
obstacles, precipitates or solutes.
Table 2. Activation energy factor and shear strength of different obstacles [65].
Obstacle Strength 𝜟𝒇𝟎 𝝉𝟎 Example
Strong 2 >𝑏 𝐿 Strong precipitates Medium 0.2-1.0 ≈𝑏 𝐿 Weak precipitates Weak <0.2 ≪𝑏 𝐿 Lattice Resistance,
Accordingly, the short-range stress component in Eq.1 as a function of the effective plastic strain rate, can be derived as [67-69]:
p 1 q 1 pl ref 3 0 0 ln Gb f kT 1 G (10)
Evolution of immobile dislocation density
The equation for the flow stress in Eq.1 requires evolution equations for internal state variables which are the dislocation density and the vacancy concentration. The mobile dislocation density is assumed to be much smaller than the immobile one [70, 71]. The evolution of the immobile dislocation density is expressed in two terms of hardening (+) and recovery (-) [72]:
) ( i ) ( i i (11)
Hardening Process:
Mobile dislocations move over a mean free path Λ before they are immobilized or annihilated. The immobile dislocation density is assumed to increase proportional to the plastic strain rate, which is related to the density of mobile dislocations, shown in Eq.5, and inversely to the mean free path: p ) ( i 1 b m (12)
where m is the Taylor orientation factor. The mean free path can be related to SDAS (2) in cast alloys and also dislocation subcell or subgrain diameter (s) as
s 1 1 1 2
(13)The effect of grain size on flow stress known as Petch-Hall relation, is accounted via this term. The formation and evolution of subcells is related to the immobile dislocation density by the parameter Kc [73]: i c 1 K s (14) Recovery Processes:
The dislocation density may be reduced by different processes. Recovery, remobilization and/or annihilation of dislocations are proportional to the current dislocation density and controlled by dislocation climb and glide.Recovery by dislocation glide is described as [67, 74]:
p i ) ( glide , i (15)
where 𝛺 is a recovery function dependents on temperature. This model accommodates only the dynamic recovery due to the strain rate. Static recovery controlled by diffusion climb is assumed to be [75]:
2
eq 2 i 3 eq ) ( b lim c , i kT Gb c c D c 2 (16)where c and ceq are current and equilibrium vacancy concentrations respectively and cγ is a
material coefficient related to the stacking-fault energy. The dislocation density decreases towards an equilibrium value ofeq. The self-diffusion coefficient is given according to Reed-Hill and Abbaschian [76]:
kT Q 0 v kT Q Q k S S a 2 v v vf vm vf vm e D e e a D (17)
where ΔSvm is the increase in entropy due to motion of vacancy, ΔSvf is the increase in entropy when forming a vacancy, Qvm is the energy barrier for vacancy motion and Qvf is the activation energy for vacancy formation.
Evolution of excess vacancy concentration
Calculation of the vacancy concentration is required for the solution of Eq.16. The generation and motion of vacancies are coupled with the recovery of dislocations and diffuse solute atoms. The model presented here is only concerned with mono-vacancies. When a crystal is retained a sufficient time at a given temperature, an equilibrium level of vacancies is reached. Deforming the material or changing the temperature generates the excess vacancies. The effect of excess vacancies on the diffusion can be written as [77]:
eq
v v 2 2 vm p 0 2 j vf y eq v v ex v c c g 1 s 1 D b b 4 c Q b c c c
(18)The stress y in Eq.18 is equal to the flow stress during a plastic deformation, the factor
p y
is the fraction of the mechanical work needed for the vacancy formation, vf
Q is the
activation energy for forming a vacancy, 0 is the atomic volume and cj is the concentration
of thermal jogs. The parameter describes the neutralisation effect by vacancy emitting and absorbing jogs, eq
v
c is the equilibrium concentration of vacancies at a given temperature, cv is
the non-equilibrium vacancy concentration and Dvm is the vacancy migration. The equilibrium
concentration of vacancies at a given temperature is [76, 78]:
kT Q exp k S exp cveq vf vf (19)
The rate of change in the vacancy equilibrium concentration is related only to the temperature change T kT Q c cveq veq vf 2 (20) Details of the model for vacancies and diffusion are to be found in Militzer et al [77] and Lindgren et al [72].
Stress-Update and Optimization of the model
The radial return operator for the integration of constitutive equations is used for updating the flow stress. are commonly used [79, 80]. The computation of the increment of effective plastic strain, which fulfils the consistency condition, requires calculation of the yield stress and hardening modulus for the current iteration of the plastic strain and internal state variables. The evolution of the internal state variables is governed by the coupled differential equations. The rate of total change in immobile dislocation density is derived by (21) and the rate of change in vacancy concentration is derived by (22):
2
eq 2 i 3 eq v v v p i i kT Gb c c D c 2 1 b m (21)
T T Q c c c g 1 s 1 D b b 4 c Q c 0 p vm 2 2 v veq veq vf2 2 j * G vf 0 v
(22)Once the dislocation density and vacancy concentration are known, the hardening modulus and the flow stress can be evaluated. During the increment iteration the plastic strain rate is assumed constant. The hardening modulus in the incremental form is given by:
pl * pl v v i pl i i G pl y c c d d H (23)
The parameters for the model can be obtained by using an in-house Matlab based toolbox. And then, a physical based model for the evolution of flow stress of alloy depending on temperature range, strains and strain rates should be developed. One set of experiments should be used for model calibration and another more complex set of tests for its validation.
CHAPTER 2
RESEARCH APPROACH
CHAPTER INTRODUCTION
This chapter describes the research methodology used in this thesis. The purpose and aim of the work are first described. It is then followed by description of material used and experimental procedure.
2.1 PURPOSE AND AIM
This work constitutes an attempt to correlate the microstructural features (e.g. SDAS, grain size and intermetallic phases) and the mechanical behaviour of as-cast AZ91D alloys at temperatures from room temperature up to 190ºC. It is then followed by adaption and optimization of a physically based model which enables prediction of the flow stress behaviour of the alloy covering different microstructures. As a benefit, the optimized parameter of the model can be employed in FEMs simulation of the behaviour of cast components at different working temperatures.
2.2 RESEARCH DESIGN Research approach
The research approach applied in this thesis is the traditional positivist research design suggested by Williamson [81]. It is schematically illustrated in Figure 5. The positivist approach represents the traditional approach to natural sciences; it is often related to experimental research designs and quantitative data and is a rather linear and fixed research design [81]. In this thesis the approach starts with a definition of the topic of interest. The literature review of the research area was performed. And that, together with a work on the theory behind mechanical behaviour and microstructural features of magnesium alloys formed the basis for a more detailed definition of the research problem and the research questions and a definition of the desirable physical modelling process. Now, a hypothesis is created and research is performed to collect data, which is analysed and interpreted to see if the hypothesis is supported. This leads to a framing of general laws. In this work, to analyses the method and the effects of its parameters, different sets of numerical experiments were then defined, performed and evaluated. Eventually, the conclusion of the result thus made.
First step in information gathering process is to plan the search. Then, the search is performed and all results of possible relevance to the problem are retrieved and evaluated. If a record is
still considered relevant after the evaluation, it is saved and managed. Based on the results of the search, the search plan may need to be modified and some or all of the steps of the search process repeated. If no new relevant records are retrieved, the search process may be considered completed. In the analysis of the problem, the topic of interest was defined as ‘’correlation between mechanical properties and microstructural features of AZ91D’’. The scope of the literature review was divided into three parts; the first part concerns itself with manufacturing technique and microstructural features which then provide important contributions to the mechanical behaviour in as-cast AZ91D. The third part compares different modelling methods used for modelling of the mechanical behaviour of AZ91D alloys. The information resources used were online databases (mainly ScienceDirect1, Scopus2 and SpringerLink3, but also e.g. journal specific websites and e-books) and library resources (books and journals).
Figure 5. Schematic illustration of the research approach for present work. Research questions
The industrial partner of this project is Husqvarna AB and the studied component is crank case of Husqvarna chainsaw. The crank case is being made of AZ91D and the in service temperature of this component is from RT to 190oC. In order to have a sustainable optimization design of
cast component the closed chain of design (Figure 6) need to be fulfilled. In present work, part of this chain has been defined as study scope. The first step is manufacturing technique followed by microstructure and mechanical characterization. The focus will be then on the correlation between the microstructural features and the mechanical behaviour of the alloy. The logic of current research activities (mechanical performance during use) and future work (mechanical performance in process and alloy development) are presented in Figure 7. Several research questions have been raised and answered fulfilling each step. The main research questions are listed below and subsequently are addressed in the indicated supplements:
Research question 1: (Supplement I & III)
What is the effect of microstructure (size, morphology and distribution of different phases) on mechanical behaviour of as-cast AZ91D alloy?
Research question 2: (Supplement II)
What is the correlation between microstructural features and thermal expansion of the alloy?
Research question 3: (Supplement IV)
Is it possible to extend a dislocation density based model to predict the flow stress of as-cast AZ91D at temperature range from RT to 190oC?
Define the Topic of interest and gather information
Define the gap in knowledge and research questions Experimental design Results Conclusion • As-cast AZ91D Magnesium Alloy Properties- Effect of Microstructure and Temperature • Manufacturing technique and microstructure characterization • Correlation between microstructure and properties of AZ91D. • Physical model to
predict the flow stress behavior of AZ91D
• Validating the
experimental set up
• Design of the table
of experiments • Performing the tests • Data collecting • Evaluation • Analysis • Validation of the results • Discussion of the results and deriving conclusions
Research question 4: (Supplement IV)
Does the model have sufficient validity for different as-cast microstructures?
Figure 6- The closed chain of design optimization sustainability.
2.3 MATERIAL AND EXPERIMENTAL PROCEDURE Materials
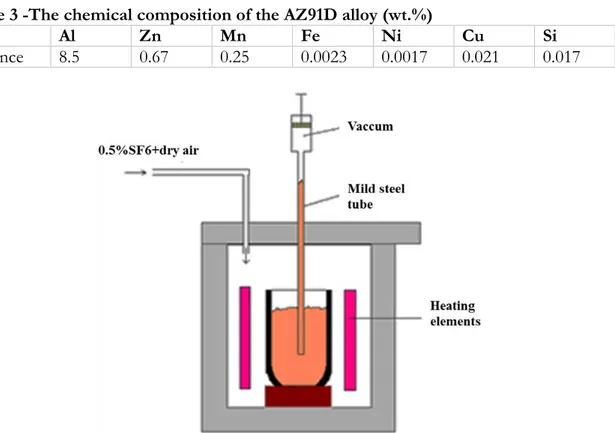
Commercial ingots of AZ91D alloy with composition shown in Table 3 was used as the base alloy. To minimize the amount of oxides films and inclusions during casting ingots were melted in mild steel crucibles under vacuum filling process and gas protection of dry air with 0.5 % SF6, see Figure 8. The melt was sucked up to the mild steel rods of 1000 mm long. The solidified
rods then were cut into 170 mm long bars and re-melted in Bridgman furnace under protective gas (0.5% SF6 in dry air). The melt was kept for 25 minutes at 650°C to fully melt. The cooling rate of the specimen could controlled by drawing rate of the furnace. In this study, to generate different microstructures commonly found in slow cooled sand cast materials up to rapidly cooled high pressure die cast materials, furnace pull-rates from 0.3 mm/s to 6 mm/s were used. The schematic of Bridgman furnace device used in experiments is shown in Figure 9.
Table 3 -The chemical composition of the AZ91D alloy (wt.%)
Mg Al Zn Mn Fe Ni Cu Si
Balance 8.5 0.67 0.25 0.0023 0.0017 0.021 0.017
Figure 9. The schematic of Bridgman furnace device used in experiments.
Mechanical testing
Tensile bars were prepared according to ASTM B577 [82] and tested from room temperature (RT) up to 190oC, with strain rates ranging from 10-4 up to 10-1 1/s. A ZWICK-ROLL™ Z100
Laser extensometer was used to measure strain. The geometry of the test specimen is shown in Figure 10. The tensile test schedule is shown in Table 4 together with the results. To facilitate an effective optimization the number of data point were reduced using a specially devised MATLABTM code.
Figure 10- The geometry of the tensile test specimen [82]. Microstructure characterization
Samples were prepared following standard procedures for microstructural characterization [83]. Sectioned samples were etched at room temperature using 10 ml HF (48%) for 1-2s to etch the Mg17Al12 phase [84]. It should mentioned that all optical characterization collected from at least
five images per sample for assuring the internal validity.
The SDAS was quantified by identifying and measuring small groups of well-defined secondary dendritic arms on the optical micrographs. The value of SDAS was then practically determined using SDAS=L/n, where L is the length of the line drawn from edge to edge of the measured arms, and n is the number of dendritic arms. The mean values of SDAS for each sample are the average of more than 50 dendrite arms.
To assess actual grain size and subcell size of samples before and after deformation EBSD technique was employed with scanning step size of 0.8 µm. Low angle grain boundaries (LAGBs) having misorientations between 2 o and 15 o were depicted as white lines, and high
Protection gas Furnace moving upward Heating zone Water inlet Water outlet Cooling zone Heating element Water outlet Water inlet
angle grain boundaries (HAGBs) with misorientations greater than 15 o as black lines. In order
to minimize errors in measurement, misorientations below 2o were not considered. Grain size
on an image was measured with "Planimetric" method described by ASTM E112 [85] where the grain size determined by calculating the number of grains per unit area. The kernel average misorientation (KAM) maps were retrieved directly from EBSD data.
The area fraction of phases was measured using Olympus Stream Motion v. 1.8, based on image contrast. Following ASM specialty handbook of magnesium and magnesium alloys [86], the shape factor of Mg17Al12 were obtained from 4πA/p2 relation, where A and p are area and
perimeter of particles in a cross-section, respectively. A perfect globule is characterized by a shape factor of 1.
Coefficient of thermal expansion
The coefficients of thermal expansion (CTE) of AZ91D was determined following of DIN 51045-1 [87] standard. A NETZSCH 402PC dilatometer at 5K/min heating rate and with 1.2 min-1 Ar gas flow was employed. Displacement of the 12 mm long AZ91 samples as a function
of temperature (50oC to 190oC) was measured using an alumina probe. CTE was then calculated
from the displacement data.
Differential scanning calorimetric
Disk shaped samples having 42.1 mg weight were prepared for differential scanning calorimetric (DSC) measurements with five times temperature cycle from RT to 190oC. Heating
rate was 5 K/min. and cycles included static or dynamic temperature steps in order to achieve desired temperature. The measurements were carried out with NETZSCH 404 C calorimeter and following DIN 51007:1994-06 [88].
CHAPTER 3
SUMMARY OF RESULTS
AND DISCUSSION
CHAPTER INTRODUCTION
In this chapter, the main results of the appended supplements are summarized and discussed. The supplements address the research questions to various degrees.
3.1 MICROSTRUCTURE CHARACHTERIZATION
The gradient solidification set-up was utilized to manufacture samples having desirable microstructure. Analysis of EBSD orientation mapping of all samples revealed the random orientation of the grains suggesting that the sample manufacturing did not result in any texture and grains have no preferred directionality. Hence, the assumption of manufacturing samples with isotropic microstructure confirmed.
The typical EBSD maps for two different solidification speed before deformation is shown in Figure 11. LAGBs between 2o and 15o were depicted as white lines, HAGBs > 15o as black
lines. It should be mentioned that the possible twin boundaries are resulted from mechanical polishing. Grain sizes of all samples obtained from different solidification speed are presented in Table 4.
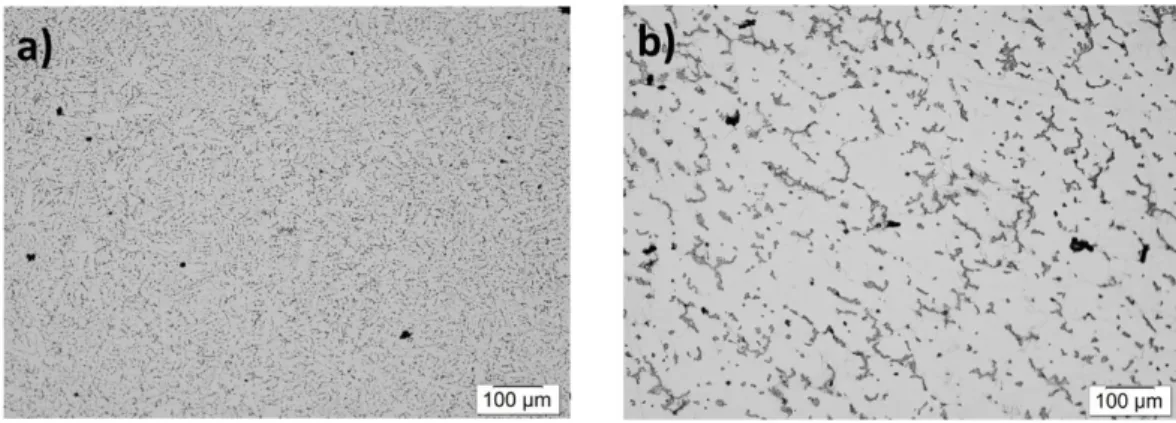
It was clearly understood that increasing in drawing rate assisted to formation of finer SDAS, (see Figure 12 and Table 4) as well as formation of divorced eutectic (Figure 13). This results are in good agreement with literature findings [84, 89].
The observed equiaxed of fine and coarse microstructures of AZ91D (Figure 12-a and b) contain -Mg (white phase) surrounded by Mg17Al12 particles (dark phase). Intermetallic
precipitated in different shapes at grain boundaries as well as inter-dendritic regions. The sizes of the Mg17Al12 particles are measured to be about several micrometres. For high solidification
rate (6 mm/s) the range of microstructural scale for Mg17Al12 ranged from 0.8 µm up to 16.5
µm. For low solidification rate (0.3 mm/s) this range was from 1.3 µm up to 24.2 µm. The shape factor of Mg17Al12 for different solidification speed appeared to be independent of the
solidification rate (almost 0.60 ± 0.2) but area fraction showed a significant variation. This fairly large scatters suggests the possibility of a continuous network of particles at the intragranualar regions. Increasing the solidification speed results to lower area fraction of Mg17Al12
intermetallic. The area fraction of all tested samples are presented in Table 4. In agreement with Nagasekhar et al [90], measuring the connectivity of Mg17Al12 was not possible by optical nor
by Scanning Electron Microscopy (SEM). The Mg17Al12 precipitated along triple junction grain
boundaries and cross-section based analysis cannot capture the degree of their connectivity accurately.
Furthermore, the relationship between grain size and Mg17Al12 fraction was studied. In Figure
14 the Mg17Al12 fraction is plotted versus grain size and it is realized that there is a relation
between the precipitated fraction and grain size. The samples displaying a higher fraction indicates a strong relation. The lower fraction samples also display a strong relation but with a significantly lower slope. The intersection between these two classes occurs around 9% Mg17Al12. The outlier showed a low Mg17Al12 fraction at a large grain size.
Figure 11. IPF maps for illustrating grain orientation. LAGBs between 2o and 15o were
depicted as white lines, HAGBs > 15o as black lines (a) for furnace pulled at 6 mm/s
with grain size of 93 µm ± 4.4 µm and (b) for furnace pulled at 0.3 mm/s with grain size of 254 µm ± 3.7 µm.
Figure 12. Optical micrograph illustrating SDAS (4.2 μm ± 1.2 μm) for samples drawn at 6mm/s, (b) Optical micrograph illustrating SDAS (25.0 µm ± 1.6 µm) for samples drawn at 0.3mm/s (Supplement I).
Figure 13. Illustration of the divorced eutectic and the Mg17Al12 fraction and
morphology. (a) Mg17Al12 fraction of 7.1% ±0.4% with a shape factor of 0.60 ± 0.2 for
samples drawn at 6mm/s, (b) Mg17Al12 fraction of 11% ±0.9% with a shape factor of 0.60
± 0.2 for samples drawn at 0.3mm/s (Supplement I).
Figure 14. Fraction of Mg17Al12 versus grain size (Supplement III).
5 6 7 8 9 10 11 12 13 80 130 180 230 280 330 380 Mg 17 Al 12 fract io n (% ) Grain sizes (μm)
Table 4. Experimental conditions and mechanical results of relevant microstructures obtained from a variety of cooling rates between 0.3mm/s and 6mm/s. The (*) indicating the Runs selected to illustrate the modeling optimization results in Figure 26. The sample numbering is identified as: R(run number): sample replication number (total run replications).
3.2 MECHANICAL CHARACTERIZATION
Examples of typical stress-strain curves are shown in Figure 15 at room temperature and 190oC.
In general there was scatter in the results as previously suggested by literatures [44, 48-50, 91, 92]. Figure 15 illustrates that the finer microstructure has lower yield strength than the coarser structure suggesting that there are other factors determining the yields strength than SDAS. On the other hand, the strain rate dependence at 190oC is as expected where a lower strain rate is
showing less hardening than at a higher strain rate. In summary, Figure 15 illustrates some points i) the offset yield strength (Rp0.2) appears strongly dependent on the Mg17Al12 fraction, ii)
at higher fraction of Mg17Al12 the offset yield strength (Rp0.2) also showed a higher dependence
of strain rate, iii) the hardening appears higher for lower Mg17Al12 fraction and smaller SDAS,
iv) a higher Mg17Al12 fraction appears to reduce the elongation to failure.
In order to understand the significance of the experimental parameters an Analysis of Variance (ANOVA) was made using the DesignExpert™ software. Table 5 shows analysis of variance of the offset yield strength (Rpo.2) for different factors and their interactions. The model in
annotated view is labelled as ‘’significant’’. ‘’F-value’’ column and associated probability
Solidification
rate Test temperate Strain rate
Grain
size SDAS Mg17Al12 Fraction Rp0.2 Rm εf
[mm/s] [oC] [1/s] [μm] [μm] [%] [MPa] [MPa] [%] R16:(8) 6 RT 0.0001 100.5±0.3 4.2± 0.2 8.5±0.4 103.2±4.2 230±6 12±0.2 R8:(8) 6 RT 0.0001 102.4± 0.4 5.4± 0.3 7.1±0.2 100.2±3.6 223±10 10±1.6 R12:(8) 6 RT 0.0001 104.4± 0.5 6.4± 0.5 7.6±0.4 103.4±4.2 219±11 9±0.3 R20:(4) 0.3 RT 0.0001 295.4± 0.6 25.0± 0.6 11.0±0.9 144±2.7 250±9 2±1.1 R2:(4) 0.3 RT 0.03 303.2± 0.5 25.3± 0.4 11.3±0.3 146.8±3.5 209±4 2±1.5 R13:(4) 0.3 RT 0.03 307.8± 0.6 23.7± 0.5 8.9±0.3 107.7±1.8 207±10 4±0.8 R18:(5) 0.3 RT 0.03 287.6± 0.5 15.7± 0.2 10.6±0.2 143.1±2.5 224±12 6±0.9 R14:(8) 6 89 0.06 103.4± 0.2 4.2± 1.2 7.1±0.4 88.1 229 4.3±0.5 R3:(8) 6 89 0.06 95.1± 0.5 4.7± 0.5 7.8±0.7 90.4±3.5 258±4.5 3.5±0.4 R15:(8) 6 89 0.1 98.4± 0.2 4.3± 0.2 6.8±0.5 100.3 253 2.6 R4:(4) 6 89 0.02 103.0± 0.2 4.5± 0.2 6.7±0.5 94.2 245 2.3 R10:(4) 6 89 0.0001 100.3± 0.5 4.2± 0.3 7.1±0.6 104.9 257 4.3 R17:(6) 0.3 120 0.04 304.5± 1.2 24.0± 1.2 11.5±0.6 140.8 191 3.8 R14:(5) 0.3 131 0.1 295.1± 0.4 23.0± 0.4 11.4±0.2 139.8 211 2.6±0.6 R9:(6) 4 133 0.03 142.3±0.3 6.7± 1 9.3±0.6 102.8 241 3.4±0.2 R21:(5) 4 133 0.03 138.6±0.7 6.4± 1 8.4±0.6 92.9±3.5 261±1.3 3.1 R19:(5) 6 190 0.0001 109.2± 0.3 6.3± 0.4 7.1±0.6 70.7±5.3 144±9.7 12±1.3 R22:(6) 6 190 0.0001 112.4± 0.9 7.4± 0.6 7.8±0.4 75.6±4.5 133±6 10±0.6 R5:(6) 6 190 0.1 92.5± 0.4 4.6± 0.6 7.3±0.2 75.9±2.4 203±9.2 2.1±3.2 R11:(10) 6 190 0.06 128.5± 0.7 6.0± 1.9 7.1±0.6 80.3 217 3.9±0.5 R6:(9) 6 190 0.0001 146±0.9 5.2± 0.4 8.3 77.2±2.8 205±11 16±1.3 R23:(9) 0.3 190 0.0001 331.3 22.5 12.3 108.9±3.5 133±3 6.1±1.1 R1:(8) 0.3 190 0.0001 321.6± 0.6 25.2± 1.6 11.9±0.9 105.3±4.3 139±6 3.6±1.4 R24:(8) 0.3 190 0.0001 307.2± 0.2 23.4± 1.6 11.3±0.2 101.9±3.4 157±7 5.4±1.3 R7:(5) 3 190 0.0001 214.6± 0.3 12.5± 1.1 8.8±0.9 75.4±4.3 130±5 8.3±1.6 R16:1(8)* 6 RT 0.0001 94.6 4.2 7.5 112.4 261 7.6 R3:3(8) * 6 89 0.06 94.8 4.2 7.3 103.6 263 9.7 R19:5(5)* 6 133 0.03 110.7 6.4 8.4 107.6 264 12.6 R5:4(6)* 6 190 0.0001 93.4 5.3 7.8 75.3 168 9.8 R7:3(5)* 3 190 0.0001 215.4 12.5 8.8 78.6 132 5.1 Sample No.
(‘’Prob>F’’) shows that there is a very small probability, near 0.81% chance (P=0.0081), that the differences model terms (A, B, D and BD) could occur due to noise. Lack of fit is not significant which is relative to ‘’Pure Error’’. In other words, it appears at this stage the difference between terms of models is significant suggesting that the model is fit. Interesting to note is that temperature (A) and Mg17Al12 fraction (D) are significant. Strain rate (B) is
marginally significant but very close to significance. The interaction between the strain rate and Mg17Al12 fraction (BD) is also marginally significant. Any suitable fit with SDAS (or C) in the
analysis could not be obtained. The analysis confirmed that temperature reduce yield strength as expected. The result of yield strength model is shown in Figure 16. It reveals an interaction between two factors of Mg17Al12 fraction and strain rate which effect on yield strength of
specimens. It is conceived that at high strain rate the effect of Mg17Al12 fraction on yield strength
is more dominant. While, no significant effect was observed at lower Mg17Al12 fraction. Higher
strain rates leads to increased yield strength. It means that higher fraction of Mg17Al12 results in
increased initial strength of the alloy.
Figure 15. Stress–strain curves for specimens deformed at a) Room temperature and b) 190oC and strain rate of 0.0001 1/s (Supplement III).
a)
Table 5. Analysis of variance of the Rp0.2 for different factors and their interactions with
R-squared of 0.90 (Supplement I).
Source Sum of Squares df Mean Square F-value
P-value Prob>
F Significance
Model 7162.69 4 1790.67 6.38 0.0081 Significant
A-Temp 1412.76 1 1412.76 5.04 0.0487 Significant
B-Strain rate 1382.93 1 1382.93 4.93 0.0507 Marginally significant D- Mg17Al12
fraction 4122.91 1 4122.91 14.69 0.0033 Significant BD 1190.40 1 1190.40 4.24 0.0664 Marginally significant
Residual 2805.77 10 280.58
Lack of Fit 822.00 4 205.50 0.62 0.6641 Not significant
Pure Error 1983.77 6 330.63
Cor Total 9968.46 14
Figure 16. Interaction of strain rate and Mg17Al12.fraction on yield strength. Centre line
is the actual trend. Dash lines are confidence intervals (Supplement I)
Furthermore, the average value of offset yield strength (Rp0.2) obtained for tensile tests at room
temperature and 190oC is plotted against area fraction of Mg
17Al12 in Figure 17 a). It was
revealed that the content of Mg17Al12 was strongly contributing to the offset yield strength of
AZ91D, the higher the area fraction of Mg17Al12 the higher the Rpo.2 value. In addition, the linear
regression analysis was carried out in order to quantify the relationship between the Mg17Al12
content andthe Rpo.2 magnitudes. The analysis revealed that there is a different linear slope fit
for Mg17Al12 content below 8.8% and above 11%. When the Mg17Al12 content is ≥11% the Rpo.2
at both RT and 190oCincreases with sharper slope in comparison to lower content of Mg 17Al12.
Jarfors et al [93] suggested that the intermediate connectivity of particles starts at 8% and by 11% particle fraction there is a full connectivity between particles. Hence, one, can conclude
that by increasing the fraction of Mg17Al12 (above 11%), these particles start to impinge on each
other, forming a network like a rigid scaffold. During tensile testing, the plastic deformation can only occur when the entire Mg17Al12 network is deformed. It seems reasonable to assume
that this network should be able to withstand higher loads before it starts to deform, because it is difficult for the continuation of slip and dislocations to move across the Mg17Al12 network
during deformation [94]. Hence, a higher fraction of Mg17Al12 leads to higher interconnectivity
and a more rigid and harder material. Consequently, the offset yield strength of AZ91D alloy is mainly determined by the continuous network of Mg17Al12. The effect of SDAS and grain
size on offset yield point showed no physical meaning. Hence, it is confirmed that there are other parameters that have effect on offset yield point of AZ91D rather than SDAS or grain size, see Figure 18 a).
Furthermore, analysing the elongation to failure, Figure 17 c), showed a clear reduction with an increasing Mg17Al12 fraction which is related to brittle nature of Mg17Al12. Above 10% Mg17Al12
the elongation to failure appears to be in the order of 4% with a fair scatter. Obviously, the SDAS and grain size have inverse relationship with elongation to failure, see Figure 18 c). Once the material starts to yield, it is important that which parameters affect the stress-strain behavior. It was realized that Mg17Al12 content, SDAS and grain size have no obvious effect on
fracture strength, Rm, of the material, see Figure 17 b) and Figure 18 b). However, as it was
expected the temperature decrease the fracture strength. Furthermore, the hardening was defined as: YS F y F
(24)Table 6 shows the ANOVA results for hardening. The model is significant and there is only a 0.02% chance that a "Model F-Value" could occur due to noise. Lack of fit is not significant suggesting that the model is fit. Interesting to note is that only temperature (A) is significant. Surprisingly strain rate is not significant nor is SDAS (C) and Mg17Al12 fraction (D). What stands
out is that the interaction between temperature and strain rate (AB) is marginally significant. In the evaluation Strain rate (B) is kept to keep model hierarchy intact. This suggests, not unexpectedly, that temperature dependent dislocation mobility has a dominant role in the deformation behavior of AZ91D. It should here, again, be noted that there is a fairly large scatter in data and the results should be seen as qualitative.
Figure 17. Variation of a) Rpo.2, b) fracture strength, and c) elongation to fracture with respect to fraction of Mg17Al12 at room temperature and 190oC and linear regression plot
(Supplement III). 100 150 200 250 300 6 7 8 9 10 11 12 13 Rm (MPa) Mg17Al12fraction (%) b) 60 80 100 120 140 160 6 7 8 9 10 11 12 13 Rp0. 2 (MPa) Mg17Al12fraction (%) Room Temperature 190 C a) 0 5 10 15 20 6 8 10 12 14
ε
f (% ) Mg17Al12fraction (%) c)Figure 18. Variation of a) Rpo.2, b) fracture strength and c) elongation to fracture with
respect to fraction of with respect to SDAS and grain size value at room temperature and 190oC (Supplement III).
80 130 180 230 280 330 0 5 10 15 20 0 5 10 15 20 25 30 Grain sizes (μm) εf (% ) SDAS (μm) c) 80 130 180 230 280 330 100 150 200 250 300 0 5 10 15 20 25 30 Grain sizes (μm) Rm (MP a) SDAS (μm) b) 80 130 180 230 280 330 60 80 100 120 140 160 0 5 10 15 20 25 30 Grain sizes (μm) Rp0. 2 (MPa) SDAS (μm)
SDAS @ RT SDAS @ 190 C Grain size @ RT Grain size @ 190 C
Table 6. Analysis of variance of the hardening for different factors and their interactions with R-squared of 0.87 (Supplement I).
Source Sum of
Squares df Mean Square F value P-value Prob> F Model 3.39 3 1.13 16.59 0.0002 Significant A-Temp 0.66 1 0.66 9.65 0.0100 Significant
B-Strain rate 0.11 1 0.11 1.55 0.2393 Hierarchy
AB 0.28 1 0.28 4.12 0.0673 Marginally significant Residual 0.75 11 0.068
Lack of Fit 0.32 5 0.063 0.88 0.5478 Not significant Pure Error 0.43 6 0.072
Cor Total 4.14 14
Figure 19 illustrates the interaction between temperature and strain rate on hardening. It is shown that temperature primarily contributes to softening at low strain rate and at 0.1 1/s the hardening effect is rendered temperature independent. The fact that there was no influence from the Mg17Al12 fraction on the hardening suggests that there is none or little hardening effect
from the Mg17Al12 particles and that there is only effects from glide and climbing as more glide
systems are engaged in the α-phase.
Figure 19. Interaction of temperature and strain rate on hardening. Center line is the actual trend. Dash lines are confidence intervals (Supplement I).
To study more about the effect of SDAS on rate of hardening an apparent toughness index was calculated as Rm*εf and plotted against SDAS, Figure 20. It was realized that hardening rate
in the tensile tests appeared to be higher for smaller SDAS while no such relation could be seen for the ultimate tensile strength. Analyzing the influence of SDAS as apparent toughness showed a strong inverse relation to SDAS. It should also be noted that temperature did not show significant effect and all measured values fall on the same line.
Figure 20. Apparent toughness as function of SDAS at both room temperature and at 190oC (Supplement III).
3.3 COEFFICIENT OF THERMAL EXPANSION
Figure 21 shows the relative elongation of alloy from 323 to 423 K (50oC to 150oC) for five
cycles. It can be seen that the cast alloy with low fraction of intermetallic expanded more than alloy containing higher intermetallic phase fraction.
Figure 21. Relative elongation of AZ91D cast alloy containing different level of intermetallic fraction (Supplement II).
200 700 1200 1700 2200 2700 3200 3700 3 8 13 18 23
![Figure 2. Solidification sequences of AZ alloys after reference [31].](https://thumb-eu.123doks.com/thumbv2/5dokorg/4625786.119478/15.892.220.774.729.1017/figure-solidification-sequences-az-alloys-reference.webp)
![Figure 4.Unit Cell and slip planes in Mg after reference [33].](https://thumb-eu.123doks.com/thumbv2/5dokorg/4625786.119478/17.892.150.806.831.1025/figure-unit-cell-slip-planes-mg-reference.webp)
![Table 2. Activation energy factor and shear strength of different obstacles [65].](https://thumb-eu.123doks.com/thumbv2/5dokorg/4625786.119478/21.892.148.809.549.739/table-activation-energy-factor-shear-strength-different-obstacles.webp)