INTERNATIONAL DESIGN CONFERENCE - DESIGN 2016 Dubrovnik - Croatia, May 16 - 19, 2016.
AN APPROACH TO CAPTURE ENGINEERING
KNOWLEDGE THROUGH VISUAL EVALUATION
OF MASS GENERATED DESIGN PROPOSALS
J. Johansson, R. Stolt and D. RaudbergetKeywords: design knowledge, design evaluation, knowledge sharing, simulation-based design
1. Introduction
The design of a product is the carefully tuned compromise between different requirements such as cost effectiveness, visual appearance, performance, and the available time to market. These requirements depend on the shape, material properties, and manufacturing processes of the product. The product development process can therefore be viewed as a complex optimization loop with several objectives with the overall goal of maximizing the return of investments.
Such optimisation loops, i.e. product development projects, are expensive and time consuming for manufacturing companies and the companies finding the best solutions most efficiently are the winners. During the development projects more knowledge is gained about the product concept and it may turn out that there are previously unknown flaws in the suggested design or that the requirements changed during the project. A recent way of taking care of and reusing that highly valuable knowledge is the Set-based Concurrent Engineering (SBCE) approach [Ward et al. 1995]. In SBCE several solutions are explored simultaneously, which of course multiplies the resources spent on the development project, but with the benefit of having the design space explored more thoroughly. To apply SBCE and still keeping the cost and time at bay, it is crucial to have a quick response time for every design evaluation i.e. the time it takes to evaluate one point in the parameter space (one design proposal). This should ideally be done automatically to keep the evaluation time low, and let the optimisation loop run 24/7, which has been the target for design automation for years.
However, some evaluations are difficult to automate. They may involve judgements which is not easily implemented as computer routines. For instance, it is hard to automatically judge if the production process will produce defects on the products surface. These defects can in some cases be insignificant because their shape, size and location is such that it will not disturb the impression of the product. Yet even a tiny defect is unacceptable in other cases since it would be eye-catching to the customer of the product. This is in line with the saying that it is hard to tell what a good design is until you see it. This paper presents an approach that involves a human operator in automated engineering processes. Humans can quickly inspect and evaluate geometry visually. This ability is frequently used to control the quality of mass produced goods. Besides the common visual inspection of physical objects, virtual computer generated geometry can be inspected as well. It is here proposed to visualize the results from design automation systems in a standardised and mass production like setting enabling the engineers to make quick response in order to render knowledge regarding the product.
There is one major reason to use the visual evaluation approach rather than developing specialized computer routines to automatically do the response. It is often hard to establish quantitative evaluation
criteria that can be weighted into a single measurement relevant to the complex product development optimization loop. The reason is that when exploring new designs it may not be possible to predict in which ways they can fail. Hence, process simulations have to first be made to establish a starting point of judging which variant are within the acceptable realm. Thus, the criteria for the judgements could not have been known beforehand.
1.1 Aim of research
The goal of the research project in which this paper has been written, is to enable manufacturing companies to handle fluctuating and contradicting requirements through SBCE. The paper explores the possibility of capturing the subjective judgements of designers and production specialists based on inspection of virtual models and physical components. By doing so it is assumed that flaws that are difficult to detect using conventional algorithmic procedures may be detected, allowing a larger set of design suggestions to be evaluated and thereby increasing the companies’ capability in pursuing SBCE. The research question may be formulated as:
How should a system for the extraction of tacit knowledge be devised to detect design suggestions that can cause aesthetic or functional flaws that are hard or impossible to detect with conventional methods. 1.2 Research approach
The research presented in this paper, which is in an early phase, is based on the authors’ experience of design automation. The idea to visualize mass generated sets of design proposals to enquiry the design engineers was raised during a project for automation of the development of tool sets for the draw bending of aluminium profiles. The resulting design automation system from that project is described in [Johansson 2011]. It was capable of synthesizing CAD-models of draw bending toolsets and subsequently generating and executing manufacturing simulations (FEM-simulations) of the draw bending process. Even if not reported in that paper the outputs from the system was rendered as pictures to detect wrinkles of tiny features of the profile. Even if the code to automatically detect the wrinkles where developed, as reported in the paper, it was realized that the idea of extracting the tacit knowledge of feasible bends from the engineers through eyesight makes an efficient short cut in the development process of design automation systems. The draw bending system is demonstrated as the first case presented in this paper. The second case presented was identified and initiated to validate the idea from the first case.
2. Related research
This work is based on concepts mainly coming from the field of Knowledge Based Systems (KBS) and Set-based Concurrent Engineering (SBCE). It will be argued in this paper that KBS can be used to enhance the company’s SBCE capability.
2.1 Knowledge based systems
In a broad sense the knowledge repository of KBS is used to solve tasks that are not beforehand known. Thus, they cannot be treated in a fully algorithmic manner. Using humans in the loop for evaluation and decision-making is not common practice within the KBS community in engineering. However with the vast amount of Finite Element Analyses (FEA) being produced today there is a clear need of support on interpreting the simulation results. Most of the research connected to that issue has been devoted to interpolating the FEA results directly using e.g. response surfaces. One example on forged aero engine parts is found in [Yanhui et al. 2010]. Examples of Response Surface Methodology (RSM) applied to FEA is plentiful in literature. However, the authors of this paper have not found any publications were the objective has been to model the response of human operators when interpreting the FEA results for design automation systems.
Modelling of human response is essential in AI where e.g. support services by telephone are being automated by trained neural networks. Another example is facial recognition. Many complex processes rely on visual knowledge and interpretation of images such as the use of maps. Maps have different purposes but one common feature is that they provide contextual overview. One such example is the
subway map, which describes the relationships between different locations rather than a correct representation of their geographical locations.
To get a quick and accurate response from the human, the information has to be presented in such way that it is possible to immediately comprehend it. People are good at interpreting the visual impression and able to quickly spot something that deviates from the expected, an ability which is difficult or even impossible to create in a computer. This is especially true if the expected deviation is not known a priori. However, a human can often instantly determine how much the deviation will compromise the usefulness of what is studied. The response from the human operator is also often of a subjective nature that is difficult to specify and often outside the measurable realm. Examples include the esthetical appearance and the perception of a product’s surface [Rosén et al. 2015].
This is why a graphical representation of information is advocated in this paper as a key enabler of the proposed method. Should the information be presented as figures in data-sheets, the time it takes to interpret will invariably be much longer. For large data-sets it may be impossible. Making large amounts of data directly interpretable has been one of the challenges when making vast simulations and having to interpret all the data being generated to take decisions in the development process. Through the EU financed aerospace project TOICA [TOICA 2015] methods are developed that can visualise different types of data so that it can be interpreted and used to support decisions [Polacsek 2015], [Raudberget et al. 2015].
2.2 The role of knowledge in Set-based Concurrent Engineering
Within the field of Set-based Concurrent Engineering (SBCE), reuse of knowledge is a cornerstone [Sobek et al. 1999]. Failing to reuse knowledge has also been found to hinder the positive effects of SBCE [Raudberget 2010]. One way to represent knowledge is the use of visualisation, often referred to as “visual knowledge”. There is no common definition but it is often used to describe a palette of approaches that aims at displaying complex information in an efficient way for product design and project planning [Kennedy 2008]. Visual knowledge is also recognized as a tool to capture, communicate and document corporate knowledge [Ward 2007]. One type of visual knowledge is trade- off curves, usually graphical representations of the relations between different parameters. Carefully made trade-off curves can be generic, which implies that the results can be reused in following projects. Deriving curves from experiments, human knowledge or from response surfaces leads to the build-up of knowledge of a product. It is also a source of verifying that the knowledge base is accurate since these curves can be verified by experiments. Trade-off curves and similar structured codified information obtained through systematic tests and simulations is also important in the Lean Product Development approach [Kennedy 2008].
2.3 Response surface Methodology
The Response surface Methodology [Whitcomb and Anderson 2005] is applied within the optimization community in order to save computing resources when the evaluation of the objective function is heavy. Multidimensional response surfaces are used for interpolation of a set of data points. In a problem with two variables an interpretation as a surface in space can be done. Creating the response surface is in most cases preceded by a Design of Experiments (DoE). The objective of the DoE is to sample the design space so that the experiments will represents the design space as accurately as possible. There are a number of different methods for distributing the sample points in the design space depending on the objective of the study. When having established the sample points it remains to interpolate the spaces in between with a n-dimensional function and thereby assigning a function value for every point in the design space.
The knowledge repository of a KBS can be used to generate the data sample points for the creation of the response surfaces or trade-off curves. This is well established and can be utilised to automate a number of design processes. It can also be used to distribute the knowledge without having to reveal the knowledge base. One example is in product configurators used in pre-sales [Hvam et al. 2008]. These configurators are used in an environment outside the company and it is imperative that the knowledgebase does not become public since it contains the core knowledge of the company and is probably of high interest to competitors.
Johansson [2014] demonstrate how a KBS can integrate various software in the process of setting up and executing FEA. In order to evaluate the idea of combining automatically generated design/manufacturing solutions by visual inspection that system was extended with new functionalities to generate and present graphical images and 3D models of a vast number of product instances. Also, the system was integrated to an optimisation software package allowing for design of experiences and response surface creation. Another example of the use of KBS in producibility assessment is given in [Stolt et al. 2015]. In this case only a rule base is involved, but it is an example of extensive automated evaluation of producibility in early design stages.
To conclude, there are several aspects that can be addressed by the proposed method
Capturing the subjective values that are difficult to evaluate in a codified algorithmic way. Extending the set of evaluated designs such that a Set-based approach may be supported. Presenting the designs in such way that a human operator quickly can evaluate them.
Including design for manufacturing (DfM) in early stages and for values that are not readily captured in the requirements specification.
In the following it will be shown how these aspects are merged into a “design method”, here referred to as the “Visual Evaluation Approach”
3. The visual evaluation approach and its prerequisites
The approach uses large sets of geometrical data that is generated through KBE systems or other means such as manufacturing data. Design engineers inspect the results visually in order to capture their tacit knowledge regarding the product. One issue is to present the results in a way that makes expert judgments quick and easy but still lets the tacit knowledge of engineering experts’ count. It is suggested here that the output from the evaluations are logged in form of response surfaces, thereby creating re-useable knowledge. The method is based on four main activities:
1. Retrieve geometry 2. Present geometry 3. Assess geometry
4. Generalise results into reusable format
The method is illustrated by two industrial cases, one demonstrating how design knowledge is built up from simulation data and one where knowledge is built from manufacturing data.
In both cases computer generated bitmap images and 3D models are used for the visualisation of the designs to be evaluated.
3.1 Visual evaluation of computer generated geometry
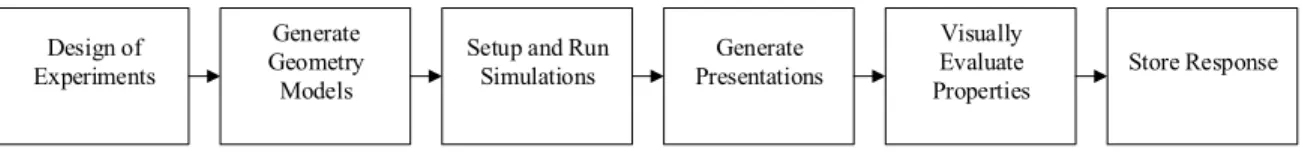
When applying the method to computer-generated geometry it includes the step as shown in Figure 1 starting with design of experiments where it is decided what points in the design space to evaluate. The literature on design of experiments is abundant and is not further explained in this paper. Next step is to generate the geometry requiring some sort of design automation system that is executed to generate the design proposals as specified by the design points from the first step. Depending on scope, the design proposals are subsequently used to simulate certain behaviour. The output is treated so that interesting geometry, from simulations or from CAD-models, is isolated. That geometry is then used to generate lightweight and easy to access presentations. The expert engineers are then exposed to these presentations and their responses are stored as part of one or several response surfaces.
Figure 1. The overall process of setting up and evaluating a vast number of design proposals
Design of Experiments
Generate Geometry
Models
Setup and Run Simulations Generate Presentations Visually Evaluate Properties Store Response
3.2 Visual evaluation of geometry representing manufactured products
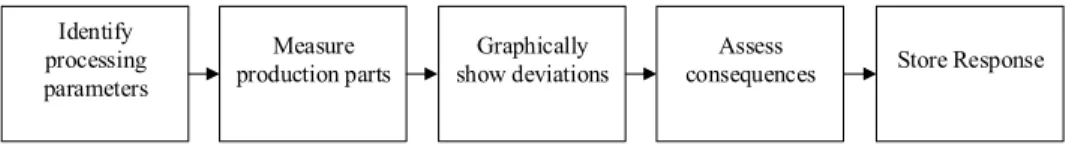
When applying the method to geometry representing manufactured products the process is shown in Figure 2. The process starts with the identification of processing parameter that are expected to have effect on the result. The geometry of the samples are digitized using laser-scanning or similar techniques. The sample models are then used to create the lightweight and easy to access presentations and then proceeds by graphically show the deviation between nominal and actual geometry. The experts manually assess the expected consequences of the deviations. When applied to production samples knowledge about manufacturing is fed back to production engineers allowing them to find safe processing windows for avoiding out of specification parts.
Figure 2. The overall process of evaluating manufactured components
4. Demonstration of the method
The proposed method has been applied to one case targeting computer generated geometry. The second case manufactured components is less elaborate. It is included to find the suitable areas of applications for the proposed method. The two cases are described in the two subsequent sections.
4.1 Visual inspection of draw bending
A design automation system was developed targeting the development of toolsets for draw bending as described by Johansson [2011]. That system is capable of generating FEM-simulation models based on inputs from the engineers (profile section and a bending table). The system first generates a design proposal of the toolset based on stored corporate knowledge (automated spread sheets and math software). The design proposal is then represented as a model generated by the system. The CAD-model is processed to generate a simsulation CAD-model where the draw bending process is simulated. The output files from the FEM-solver are subsequently converted into polygon files which are imported into a photo rendering software that automatically produces a picture and a turntable video clip of the resulting bent aluminium profile.
The draw bending system was setup to run a multitude of times to produce a whole set of pictures and video clips. These outputs were then examined using an in-house developed piece of software. In that software the experts viewed the photos and turntable video clips of the bent profiles to make decisions whether the resulting profiles are bad, good (functional but doesn’t look good), or excellent (functional and looks good too), see Figure 3 and Figure 4. If not sure or if simulation crashed the design point is marked as undetermined. The software for enquiring the experts keeps track of the design parameters used to generate the design proposal and stores the decision from the expert together with these inputs.
Figure 3. How long did the visual evaluation take for you? (It is easy to tell what good design is when you see it)
Identify processing parameters Measure production parts Graphically show deviations Assess
The tube bending system was first applied to circular tubes (because they are well described in literature) and then on rectangular tubes. The set of circular tubes (96 tubes) took 78 hours to complete, but only 3 minutes to examine, and the set of rectangular tubes (81 tubes) took 118 hours to complete, but only 5 minutes to examine. In Figure 3 three circular tubes are shown. The left and centre tubes in that figure have exactly the same dimensions but the left one is bent using a plug insert whereas the centre tube is bent without any section support. The right tube has a thinner wall thickness and is bent without any section support. It is easy to see that the left tube in Figure 3 is functional and visually good. It is also easy to the trained eye of an expert to see that the centre tube is functional even if not visually good. The reason is that even if the inside of the tube is wrinkled, the section has not collapsed, as for the right tube (the outer arc of the tube is not circular anymore).
Figure 4. The user interface used to enquiry the engineers. Top left is a picture of the current tube. Top right is a turntable clip of the current tube. Underneath is a progress bar that
indicates how many tubes has been done. At bottom there are decision buttons
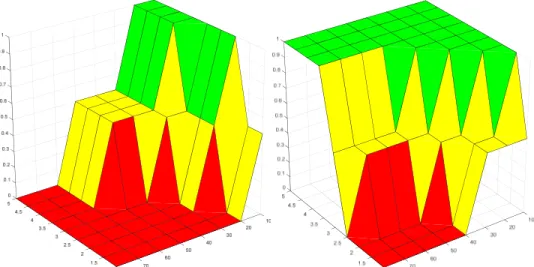
The results were used to map the feasible design space i.e. all parameter values that will render a design that is possible to manufacture. That map is the same as a response surface. Figure 5 show the feasible area for the circular tubes when making empty bending and when applying a plug to support the section. These to pictures are part of the same hyper-surface.
Figure 5. The result for empty bending (left) and when a plug was applied (right). Green means excellent bend, yellow means functional bend and red mean that the design is not feasible. The
4.2 Building re-useable knowledge from manufacturing data
It was observed at an aerospace company involved in the research project, that the manufactured static turbine components sometimes did not fulfil the geometrical tolerance specification at the final inspection. These faulty components needs to be scrapped or re-worked. The reason for ending up outside the specification is assumed to be related to variations in the processing parameters such as the setting of the weld equipment and variation between material batches. The cause – effect relationship is not fully understood, but clearly the feasible processing window somehow got breached.
The decision on what to do with the out of specification components is taken by an expert upon visual inspection of the location and shape of the deviation. In uncertain cases new calculations are made on the measured geometry. This judgement represents a piece of tacit knowledge that should be possible to capture with the proposed approach.
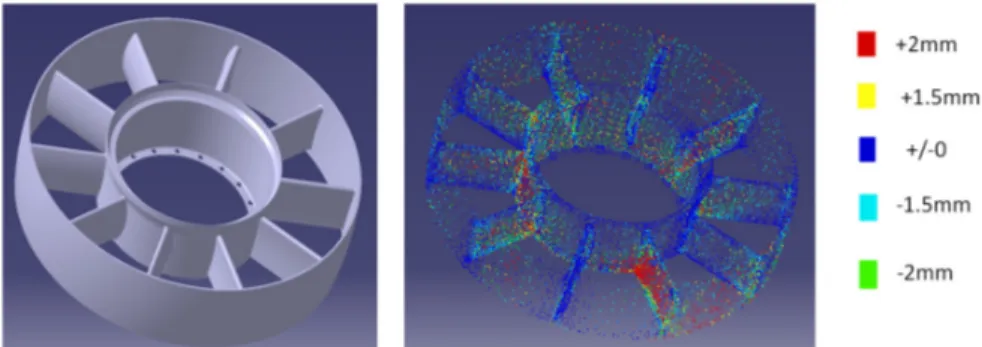
Since the actual components and measurements cannot be shown due to confidentiality reasons, a simplified CAD model and fictitious measurement data was created for illustration purposes. It is shown in Figure 6 below.
For the inspection of the manufactured parts, laser scanning is used. A large number of points on the surfaces of the component relative to fixed references are determined. This allows the comparison to the nominal geometry of the CAD models, revealing all deviations and their locations. To the right in Figure 6, the results of such measurements (fictitious) are show. The colours show the deviations between the CAD-model and the actual component in millimetres.
Figure 6. Deviations between manufactured component and the nominal geometry When deviations exceeding the permissible are detected, an aerodynamics expert optically looks at the deviations-plot and can then make three different decisions. 1) The part can be accepted as is. 2) The part must be scrapped or reworked. 3) New CFD simulations using the actual manufactured surface has to be made to determine the acceptability. In the case 3, new CAD models are generated from the inspection data and are subsequently re-evaluated.
The approach used on this case should involve identifying which combinations of processing data that will give an unacceptable response. Examples of processing data include material weld method and assembly sequence. Vast processing data repositories are available, since traceability is central in the aerospace industry.
The response surface should include the identified processing parameters and the response of the expert. Thus, it should be possible to predict which combinations of processing parameters that previously has led to faulty components, so that these combinations may be avoided.
5. Discussion
Both cases are based on the assumption that a limited number of parameters has a direct effect on the outcome from the design automation system or production. The objective in the first case is to limit the design space so that parameter combinations leading to bad results are avoided. In the second case the objective is finding combinations of processing parameters that should be avoided. This is similar to placing constraints on the “design space” so that safe processing windows can be identified. In both cases the method can be applied without having to a priori specify the desired result.
The aerospace company already makes extensive production process simulations. They study e.g. the shrink effects of the welds and can therefore chose materials, methods and assembly sequence to minimise the shape deviations of the components. However, these models are missing the causes of the variations in production. Constructing the response surfaces can therefore be a starting point of beginning to understand the actual case-effect relations.
The uniqueness of the proposed approach lies both in the visual evaluation method and in the concept of constructing responses based on human interaction. Here, a designer assesses the results by spotting defects or preferred shapes resulting from varying parameters. Traditional optimisation requires that mathematical objective functions and constraints can be developed that represent the quality of the result. In the case of visual evaluation, objective functions are not needed and the approach can therefore be used in cases where criteria for failure cannot be found or be sufficiently specified. The proposed approach can feed knowledge back to designers in the form of response surfaces and trade-off curves. It can thereby enable Set-based design where the response surfaces represent the solution space that enables the designers to make trade-offs between different design concepts or design parameters. To apply the first process, a design automation system has to be at place. That system has to be capable of generating all the design proposals as specified in the design of experiments step. Noteworthy is that the visual inspection method could be used as a part of developing the design automation system to make sure it is able to generate the desired design proposals. That would be more efficient than the normal trial and error process knowledge engineers often find themselves trapped in.
For the first process it is also needed to have simulation models at places that captures the phenomena at interest. These simulations should be able to predict that the manufactured part will end up as specified.
The creation of the response surface in the second case is much slower. All parts are finally inspected, but only a fraction of them is found to be out of specification. It will take far longer time to get a predicting response surface in place than if a simulation model was available so that actual design of experiments can be conducted.
Requirements on the usability of the system are depending on the product but also the scope of the system. Three ways of visual evaluation were tested: Static images, 3D-models displayed on 2D screens and 3D virtual reality. In many cases it might be sufficient to generate screen dumps of the model seen from one or several angles in order to do an assessment. In the case of rectangular tubes it was evident that static images was not enough, and a display window showing the results as a three-dimensional model was added, allowing the user to spin and pan the model. For complicated cases it might be necessary to use 3D virtual reality models to evaluate the geometry. A single human being can do the 2D evaluations quickly. When 3D virtual reality is used, two operators are required, one for the visual evaluation and one controlling the system and registering the scores.
To make the administration of the evaluations more efficient, a possible solution is automated digital correspondence. Engineers could receive emails containing screen dumps to which they reply in a standardised way or automated web-surveys where the engineers view images and give their feedback. The surveys questions can be absolute or relative, i.e. go/no-go or grading alternatives among each other. Some questions can also be open to allow qualitative feedback.
The evaluations are stored and incorporated into the response surface(s), which requires a database and response surface software. What type of information that is stored depends on the product data and on the organisations view of what is important. At least the parameters used to generate the design and the output from the engineers has to be stored but it can be valuable to store the identities of the enquired engineer, the design proposal/the scanned geometries, the simulations, and the presentations.
Due to complexity it may be impossible to apply the proposed process to an entire product, because that would yield almost an infinite number of design proposals to examine. The method should rather be applied to parts and sub-components commonly used on the company.
The proposed method can be used in both the design and manufacturing phases for visual evaluation of computer generated images. The results of the evaluation can be generalised in the form of trade-off curves or response surfaces thus representing a piece of company specific reusable knowledge. The process exploits the data generating capabilities of the KBS together with the human visual judgement ability to form an efficient system. The method is especially suitable for situations where the evaluation
criteria are hard to quantify in mathematical terms but easily spotted for a human operator. The research question put forth in the introduction can be answered by that the system must incorporate a limited number of parameters directly related to the end result. The results should be presented so that the expert can make a quick and accurate classification.
6. Conclusion
The proposed approach combine the computational power of design automation systems and the human visual intelligence. It utilizes knowledge based systems to generate a large set of design proposals that are subsequently simulated from a performance or production perspective. The simulation results are then processed to generate easy-to-access images or video clips that are presented to an expert panel. The resulting judgments from the experts are stored as response surfaces, which make up the repository of corporate tacit knowledge regarding its products. The response surfaces represent the feasible design space and can be used for trade-off between different alternatives, which is a core element of the Set Based Concurrent Engineering approach.
The method is illustrated by an industrial application of draw bending and of the assessment of production quality for turbine engines. These two diverse examples demonstrate the generality of the method: The first case exemplifies the application on virtual geometry and the second case illustrates the application on physical components. For future applications the approach could be used for other types of evaluation, involving other processes that can be simulated or 3d scanned. What is e.g. acceptable sink marks on injection moulded and die cast parts? This can involve the combination design parameters and simulation model or processing parameters and actual component.
Ultimately the design process can be automated through KBS to generate a large set of product variants. These could be assessed from an aesthetic point of view to determine how the design parameters should be chosen to yield the most beautiful design variant.
The results show that the visual evaluation can be used for different purposes in design and in manufacturing. The method is capable of re-creating similar values for the pipe bending process data that is currently used in industry, indicating that the approach is useful for real life applications. By incorporating human “soft” evaluation skills in an automated design loop, more diverse types of evaluations can be done. Thus, the available design space will be more thoroughly explored, potentially leading to better designs.
7. Future work
The work is in an early stage. The paper has presented an idea which has been developed into an approach. It remains to assess what effect this approach will have on the design process. The assumption is that it will contribute to mapping the feasible design space more accurately. This will increase the precision of the design suggestions so that a larger set may be evaluated in the same amount of time leading to an increased SBCE capability of the company. The future work should consequently be directed towards using the approach in actual examples to evaluate if the constraints it will impose on the design space are accurate.
References
Hvam, L., Mortensen, N. H., Riis, J., "Product customization", Product Customization, 2008, pp. 1-283.
Johansson, J., "A Feature and Script Based Integration of CAD and FEA to Support Design of Variant Rich Products", Computer-Aided Design and Applications, Vol.11, No.5, 2014, pp. 552-559.
Johansson, J., "Automated Computer Systems for Manufacturability Analyses and Tooling Design : Applied to the Rotary Draw Bending Process", Chalmers Reproservice Göteborg, 2011.
Johansson, J., "How to build flexible design automation systems for manufacturability analysis of the draw bending of aluminum profiles", Journal of Manufacturing Science and Engineering, Transactions of the ASME, Vol.133, No.6, 2011, pp. 061027
Kennedy, M., "Ready, set, dominate: implement Toyota's set-based learning for developing products and nobody can catch you", Harmon, K. (Ed.), Oaklea Press Richmond, Va, 2008.
Polacsek, T., "A process to support and to report collaborative decision", Proceedings of the 2015 IEEE 19th International Conference on Computer Supported Cooperative Work in Design, CSCWD 2015, 2015.
Raudberget, D., "Practical Applications of Set-Based Concurrent Engineering in Industry", Journal of Mechanical Engineering- Strojniški vestnik, Vol.56, No.11, 2010, pp. 685-695.
Raudberget, D., Levandowski, C., Isaksson, O., Kiopuros, T., Johannesson, H., Clarkson, J., "Modelling and Assessing Platform Architectures in Pre-Embodiment Phases through Set-Based Evaluation and Change Propagation", Journal of Aerospace Operations, Vol.3, No.10, 2015.
Rosén, B. G., Eriksson, L., Bergman, M., "Affective Surface Engineering : the art of creating emotional response from surfaces", 15th International Conference on Metrology and Properties of Engineering Surfaces, Charlotte, March 2-5, 2015.
Sobek, D. K., Ward, A. C., Liker, J. K., "Toyota's principles of set-based concurrent engineering", Sloan Management Review, Vol.40, No.2, 1999, pp. 67-83.
Stolt, R., André, S., Elgh, F., Andersson, P., "Manufacturability assessment in the conceptual design of aircraft engines – building knowledge and balancing trade-offs", International Conference on Product Lifecycle Management, PLM15, Doha, Qatar, 2015.
TOICA, "Thermal Overall Integrated Conception of Aircraft", Available at: <http://www.toica-fp7.eu/>, 2015, [Accessed 01.12.2015].
Ward, A. C., "Lean product and process development", Mass.: Lean Enterprise Institute, Cambridge, 2007. Ward, A., Liker, J. K., Cristiano, J. J., Sobek, D. K., "The second Toyota paradox: How delaying decisions can make better cars faster", Sloan Management Review, Vol.36, No.3, 1995, pp. 43-61.
Whitcomb, P. J., Anderson, M. J., "RSM Simplified: Optimizing Processes Using Response Surface Methods for Design of Experiments", 2005, p. 32.
Yanhui, Y., Dong, L., Ziyan, H., Zijian, L., "Optimization of Preform Shapes by RSM and FEM to Improve Deformation Homogeneity in Aerospace Forgings", Chinese Journal of Aeronautics, Vol.23, No.2, 2010, pp. 260-267.
Dr. Joel Johansson, Assistant Professor
Jönköping University, School of Engineering, Department of Product Development Po. Box 1026, 55111 Jönköping, Sweden