Resource utilization and
per-formance
A comparative study on mobile
cross-platform tools
This final year project is implemented at Tekniska H¨ogskolan in J¨onk¨oping within the area Com-puter Engineering. The authors are solely responsible for their presented opinions, conclusions and results.
Examiner: Johannes Schmidt Supervisor: Linus Rudbeck Extent: 15 hp (basic level)
Date: 2020-05-23
Abstract
Purpose - To determine how Android applications generated by Flutter and Xamarin differ re-garding hardware resource usage and performance compared to native Android during execution of image classification algorithms. A comparison that gives developers a decision basis when choosing between cross-platform tools of the CC approach for mobile development.
Method - This is a quantitative experiment based study of a deductive approach. The study begins with a literature review leading to a body of theory and the study’s hypotheses. To confirm or deny the hypotheses empiric data collected from an executed experiment have been analysed.
Findings - The study shows how Flutter generates the fastest and least battery draining applica-tion of the three. While being on par with Flutter regarding CPU-usage and using less RAM than said tool, Xamarin show a significantly longer execution time. With an execution time close to the one of Flutters, the native Android implementation use the most CPU and least RAM of the three.
Implications - The study’s results help developers form a decision basis when deciding between developing with Flutter and Xamarin. It also broadens the knowledge of hardware utilization of cross-compiled cross-platform tools.
Limitations - The scope of this study only includes Android which means that no generaliza-tion can be done for any other operating system. The study only covers compiled cross-platform tools, this means that no generalization can be made for any cross-cross-platform tools of any other approach. Each cross platform tool and the libraries utilized in their development have been used without any prior experience.
Keywords - Cross-compiled tools, cross platform, mobile development, Flutter, Xamarin, An-droid.
Contents
1 Introduction 7
1.1 Background . . . 7
1.2 Problem description . . . 8
1.3 Purpose and research questions . . . 8
1.4 Scope and limitations . . . 10
1.5 Disposition . . . 10
2 Theoretical framework 11 2.1 Research questions and theory . . . 11
2.2 Related studies . . . 11
2.3 Machine code compilation . . . 13
2.3.1 Ahead-of-time compilation . . . 13 2.3.2 Just-in-time compilation . . . 13 2.4 Android native . . . 14 2.5 CC Mobile Tools . . . 14 2.5.1 Xamarin.Android . . . 14 2.5.2 Flutter . . . 14 2.6 Image classification . . . 15 2.6.1 TensorFlow Lite . . . 15 2.6.2 Mobilenet . . . 15 2.6.3 Caltech 101 . . . 16
3 Method and process 17
3.1 Research questions and method . . . 17
3.2 Process . . . 17 3.3 Approach . . . 18 3.4 Experiment . . . 18 3.4.1 Hypothesis 1 . . . 18 3.4.2 Hypothesis 2 . . . 19 3.4.3 Implementation . . . 19 3.4.4 Development environment . . . 21 3.4.5 Devices . . . 21 3.4.6 Test process . . . 22 3.5 Data collection . . . 23 3.5.1 Android Profiler . . . 24
3.5.2 Android Debug Bridge . . . 24
3.5.3 Android WiFi ADB . . . 24
3.6 Data analysis . . . 24
3.6.1 Standard deviation . . . 25
3.6.2 Statistical significance . . . 25
3.7 Reliability and validity . . . 26
4 Empiricism 27 4.1 CPU average . . . 27
4.2 RAM average . . . 28
4.3 Battery drain average . . . 29
4.4 Execution time average . . . 30
5 Analysis 31 5.1 Research question 1 - Battery lifetime . . . 31
5.1.1 Average measurement . . . 31
5.1.2 Significance analysis . . . 31
5.2 Research question 2 - CPU usage, RAM usage and execution time . . . 32
5.2.1 CPU usage mean . . . 32
5.2.2 RAM usage mean . . . 33
5.2.3 Execution time mean . . . 33
5.2.4 Significance analysis . . . 33
5.3 Summary . . . 34
6 Discussion and Conclusions 36 6.1 Result . . . 36
6.1.1 Battery lifetime . . . 36
6.1.2 CPU usage, RAM usage and execution time . . . 37
6.2 Implications . . . 40
6.3 Limitations . . . 40
6.4 Conclusions and recommendations . . . 40
1
Introduction
The chapter gives a background to the study and the problem area that the study have been built upon. The study’s purpose and research questions are presented and the study’s scope and limitations are detailed. The chapter closes with a disposition of the report.
1.1 Background
Over the last three decades the world have experienced a great evolution of mobile phones. This evolution culminated with the so called smartphone, a type of device offering features such as mobile internet, geographical location, high data connectivity [1]. The smartphone and its applications are seen as possible candidates for the most impactful technological innovation of this century’s earlier years [2]. In recent years the every day use of smartphones have increased at a rapid rate [3][4]. This has led to an increased development of applications for such devices with a large economic and scientific interest [4][5].
As early as a decade back in time the phenomena of smartphone market fragmentation was mentioned by researchers. At this time the market was divided by several operating systems (OS), all having a significant market share. The OS’s Android, Symbian, iOS and Blackberry, each with at least 9% of market, were competing with the newcomer Windows Phone OS that was trying to break through [6]. In recent years the OS fragmentation have somewhat decreased. Statistics show that at the end of 2019 Android and iOS together made up for almost 99% of the market, this with Android as a clear leader at over 74% [7]. Smartphone-OS fragmentation have for almost two decades been described as a financial, technological and productive issue for the development community [8] [9] [6] [5] [3]. The financial issue of OS fragmentation was expressed by Google as early as two decades ago. Even a company of such magnitude did not have the funds to support the variety of at the time viable platforms [8].
In recent years tools for cross-platform development have increased in both popularity and matu-rity [10]. With a maturing technology there has been an increased variety of approaches to reach the ultimate goal of native performance [5]. These approaches are defined by technological characteristics such as compilation and transpilation steps, execution environment and interface rendering techniques [11]. Tools with the common approaches such as Web, Hybrid, Interpreted and Generated/Cross compilation (CC) all exist to achieve native application performance on as many platforms as possible [5].
Comparison studies of tools with different approaches have been done in the past. The CC ap-proach is presented as the most promising with high overall performance and low battery drain. [5][3]. The applications generated with the CC approach runs native code and can therefore in almost every respect be considered native. Though considered native the generated application comes with a performance penalty [3].
1.2 Problem description
Cross-platform tools are becoming more popular but choosing a tool is not an easy task. It is well known that these tools result in lowered performance, probably one of the factors leading to an existing scepticism [10]. With a rapidly maturing technology old options evolve and new ones appear which further increase the difficulty of the decision making.
A tool with the CC approach might be considered the best choice because of its native attributes and high overall performance. However, one aspect of CC tools not considered in previous comparison studies is the compilation method. The compilation to native code can be done in two ways, just in time (JIT) or ahead of time (AOT). Two of the most popular CC tools of today differ in this regard when generating applications for the Android platform.
One of these tools is Xamarin [12], developed by Microsoft as early as 2011 and positioned among the most popular cross-platform tools [13]. Xamarin has during its existence under-gone scrutiny and have been compared with multiple competitors [10][11]. However, not in any previous studies have Xamarin been compared to other CC tools with different compila-tion methods. When generating applicacompila-tions for the Android platform Xamarin utilizes the JIT method [14][10].
The newcomer Flutter is a tool that according to Google, the company developing the tool, is an answer to users expectations of excellent performance, elegant design and fluid animations [15]. Flutter, compared with Xamarin, makes use of a different method of compilation. The tool fully utilizes the AOT method, something that may have positive impact on performance [16].
1.3 Purpose and research questions
The tools Xamarin and Flutter are both of the CC approach but differs when it comes to compila-tion method. While Xamarin has undergone scrutiny in related work Flutter has not at the same extent. Their common approach, the difference in compilation method and the lack of research
in the context makes a comparison of such tools in relation to native Android interesting and relevant. This leads to the purpose of the study:
To determine how Android applications generated by Flutter and Xamarin differ regarding hardware resource usage and performance compared to native Android. A comparison that gives developers a decision basis when choosing between cross-platform tools of the CC approach for mobile development.
Two research questions have been formulated based on metrics describing the utilization of hardware. One of these metrics is battery lifetime, stated as one of the most important aspects when evaluation mobile computations [3]. Increased battery lifetime can have a positive impact on user satisfaction, another motivation for the importance of scrutinizing tools impact on this metric [17]. To generate metric data the technology machine learning and image classification is executed. This leads to the first research question of the study:
• How do Android applications generated by Flutter and Xamarin differ regarding battery lifetime compared to native Android during execution of an image classification algo-rithm?
Two additional metrics that describes hardware utilization are the hardware central processing unit (CPU) and the random access memory (RAM) in relation to execution time. Machine learning technology and image classification is executed to generate metric data from these hardware components as well. This leads to the second research question of the study:
• How do Android applications generated by Flutter and Xamarin differ regarding CPU usage, RAM usage and execution time compared to native Android during execution of an image classification algorithm?
Today more and more mobile applications run machine learning algorithms locally on the device. Popular applications such as Instagram, which at the time of writing has a user base of over 98 million on Android alone [18], uses these kinds of algorithms for computer vision [19].
1.4 Scope and limitations
This study evaluates utilization of hardware resources during image classification. The study is exclusively performed on the Android OS using the CC cross-platform tools Flutter and Xa-marin. The decision of Android exclusivity is grounded in the fact that no iOS hardware was available for running applications specific for the platform. No generalization can be done for other operating systems given potential hardware differences. Generalization can also not be done for other cross-platform tools because of differences in approach and code compilation. The study utilizes multiple code libraries, especially for image classification functionality, with-out prior experience. The applications are also built using the two cross-platform tools withwith-out any prior experience of either Flutter or Xamarin.
1.5 Disposition
Continued reading will in Chapter 2 present the theoretical framework. The framework includes the theoretical foundation of which the study is based on.
In Chapter 3 the choice of method and process is presented. This includes how the method is composited to answer the previously defined research questions as well as the decided approach and design. Finally Chapter 3 describes the process of collecting data, how it’s analysed and a justification of reliability and validity connected to the method.
Chapter 4 describes the empiricism of the study including the empirical data collected and the facts connected to this.
The analysis of the study is presented in Chapter 5. In this chapter the empirical data is analysed and the statistical significance analysis together with mean values are presented.
Finally Chapter 6 presents the conclusions and discussions of the study. The result, implications and limitations are discussed and possible further research is described.
2
Theoretical framework
The chapter gives a theoretical reason for the study and purpose and research questions that have been formed.
2.1 Research questions and theory
To strengthen the theoretical reason for the research questions, How do Android applications generated by Flutter and Xamarin differ regarding battery lifetime compared to native Android during execution of an image classification algorithm, and, How to Android applications gen-erated by Flutter and Xamarin regarding CPU usage, RAM usage and execution time differ to native Android during execution of an image classification algorithm, the following sections are detailed in the theoretical framework.
Section 2.2 Related studies contains a summary of related studies with focus on their purpose and conclusions. Section 2.3 Machine code compilation to 2.5 CC Mobile Tools are treated to provide a theoretical foundation of the platform development, cross-platform tools and compi-lation techniques covered in this study. Section 2.6 Image classification is treated to present the framework, model and dataset utilized in this study.
2.2 Related studies
Several studies have been made on cross-platform tools with different purposes and methods. Most common are studies where the authors evaluate and compare tools with focus on funda-mental attributes or performance [9].
Biørn-Hansen et al. [11] did an empirical study on three different cross-platform tools in the context of transition and animation functionality. The authors questioned the suitability of the chosen performance metrics, the quality of official profiling tools and which of the platforms required the least amount of hardware resources. They found that CPU and RAM were insightful when evaluating possible performance penalties by cross-platform tools while frames per second (FPS) did not. Regarding profiling tools the study showed that for Android the need to use many tools lead to an increased overhead, but they provided granular data which suited their needs. On Android the tool React Native with the interpreted approach performed best, better than Xamarin which is of the more promising CC approach. React Native showed the least amount
of performance penalty compared to a native solution.
Ciman and Gaggi [3] compares cross-platform tools within the context of energy consumption, one of the most important aspects of mobile application performance. They evaluate how these tools impact energy consumption in comparison to their equivalent native solutions. With empir-ical data the authors created a ranking of the tools approaches and pointed out future necessary improvements to reach native performance. Results show that the MoSync tool using the CC ap-proach preformed best with focus on energy consumption. MoSync offers two implementations in two different languages which give entirely different results. While the Javascript implemen-tation tops the charts the C++ one does not. Ciman and Gaggi highlights that the compilation process is highly impactful on energy consumption, shown by the difference between the two MoSync implementations.
In earlier studies Ciman et al. [20] compared tools with focus on external factors such as API availability, IDE usability, community size, required technologies within the context of anima-tions. This study did not evaluate performance which Ciman and Gaggi [3] did. Results showed that Titanium was the best tool suited for animations according to their specific criteria.
In [21], Mercado et al. evaluated the correlation between user perception of application quality and the approaches of cross-platform tools. By classifying user reviews with the help of machine learning technology user perceived drawbacks could be identified. With focus on performance, usability, security and reliability the authors states that the drawbacks of cross-platform tools is perceivable by users.
Willcox et al. [10] targeted two cross-platform tools, PhoneGap with the Web approach and Xamarin with the CC approach, for a performance analysis. With focus on the metrics response time, start time, RAM usage, CPU usage, disk space and energy consumption guidelines for tool selection are presented. The study concludes that while performance depends on architectural decisions and implementations of functionality favored by a specific platform there are still aspects favoring different tool approaches. The authors state that when developing applications with high CPU usage the CC approach is favorable while if focus is on advanced graphical interfaces the Web approach is a better choice.
In the study of Heitkotter et al. [6] the authors conduct a comparison study on Web applications and applications generated by cross-platform tools of both the hybrid and interpreted approach. These applications were in turn scrutinized and compared to baseline native applications. A criteria list covering aspects of infrastructure and development perspective was created with the help of practitioners and domain experts. A narrow view of the authors conclusion states that
the cross-platform tool with a hybrid approach is preferred if a native looking interface can be excluded.
Xanthopoulos et al. [5] is well cited in related studies. In their paper the authors classifies cross-platform tools resulting with a distinction of approaches. The key issues of each approach is then highlighted followed by a breakdown of advantages and disadvantages. Lastly Xanthopoulos et al. identifies the most promising approach and evaluates how effective it is in practice. The study concludes that the CC approach was most promising but with a lack of non commercial tools.
2.3 Machine code compilation
To increase the efficiency of bytecode to machine code translation, tools make use of compilation methods such as JIT and AOT which both introduces advantages and disadvantages.
2.3.1 Ahead-of-time compilation
The compilation of bytecode to machine code can be done at different times. By compiling be-fore runtime, AOT circumvents the energy and RAM overhead as well as runtime translations of its JIT counterpart [22] [23]. Since AOT compiles before runtime, it can employ time consuming techniques to further optimize the code [22].
2.3.2 Just-in-time compilation
JIT, which during startup and execution compiles an intermediate language in memory to ma-chine code [24], does not have the advantage of applying consuming techniques to optimize the code ahead of runtime. JIT is however applicable to dynamically loaded classes [22]. One ad-vantage of using a JIT compiler is the ability to identify the machine used and can make use of that information in code scheduling and generation [25].
2.4 Android native
When developing applications for Android phones, there is a variety of development environ-ments available to choose from. Android Studio alongside the Android software development kit (SDK) [26] is the most commonly known and used integrated development environment, IDE [27]. Android Studio offers the developer a variety of standard Java libraries as well as performance profilers such as Android Profiler [28].
2.5 CC Mobile Tools
Cross-platform tools make us of different approaches for generating platform specific applica-tions. One such approach is called CC, which this study focuses on. CC is an approach that compiles the framework code of a tool into platform specific bytecode. This method elimi-nates the interstage of communications with the unit that is found in solutions like Hybrid and Interpreted approaches [11].
2.5.1 Xamarin.Android
Xamarin.Android [29], which allows .NET developers to build fully native applications using the Android SDK with the programming language C#, is of the CC approach. Xamarin.Android does however not fully support AOT compilation and instead makes use of JIT compilation.
2.5.2 Flutter
Flutter, which also uses the CC approach, provides developers with low level rendering support using the Google Skia graphics library engine [30] [31]. Flutter applications are written in the programming language Dart which fully supports AOT compilation [32]. Flutter applications can be developed in either Visual Studio Code [33] or Android Studio and requires the Android SDK when developing towards Android devices. Flutter supplies developers with basic classes and functions needed to produce applications through the foundation library [34].
2.6 Image classification
Image classification, a subsection of computer vision is a technology employed in several popu-lar applications.
2.6.1 TensorFlow Lite
Libraries utilizing TensorFlow Lite (TFL) were used during the implementation of image clas-sification on the three different applications. TFL is a deep learning framework intended for on-device inference, often used in embedded systems and devices such as smartphones [35]. TFL utilizes either a 32-bit float point model or a 8-bit quantized model [36]. During this study, a pre trained 32-bit float point model was used. Float point models contributes with better ac-curacy than quantized models at the cost of size and performance. The quantized models are instead smaller and offer the fastest performance [37].
2.6.2 Mobilenet
The study utilizes the pre-trained 32-bit float point model 1.0 MobileNet-224 version 1 [38] that is optimized for TFL and embedded systems such as smartphones. While the study utilized the model for image classification, Mobilenet also presents models for the purpose of object detection.
This particular model expects input images of the resolution 224x224 pixels, an attribute that is displayed in the name of the model. The model expects processed image data controlled by a given image mean and image standard deviation.
The image mean is used to subtract the mean value from the pixel values. This approach is also called pixel centering because of the pixel value being centered to the value of zero. This mean value is divided by the image standard deviation and results in something akin to a Gaussian curve centered at zero. This process is important to ensure that each pixel input has similar data distributions [39].
2.6.3 Caltech 101
Caltech 101 is a data set of natural object images of 101 categories that contains about 40 to 800 images per category [40]. Each image has a size of roughly 300 x 200 pixels, which has to be resized for the Mobilenet model. During the study, a hundred images were at random picked out from the Caltech-101 data set.
3
Method and process
The purpose of this chapter is to provide an overall description of the study’s work process. The chapter further describes the study’s approach, design, data collection and data analysis. The chapter ends with a discussion of reliability and validity.
3.1 Research questions and method
To answer the research questions introduced in 1.3 Purpose and research questions identical experiments have been performed for native Android, Xamarin and Flutter to collect quantitative data. One application per development environment have been built, each with the purpose of collecting data to answer each research question. The applications are developed following the available documentation and examples as closely as possible. The development of a native Android application is a recurring and important factor in related studies [11] [3]. As in related studies the native solution is used as a baseline for the comparison between the tool generated applications.
During the experiment, data has been collected using various tools which are further detailed in 3.5 Data collection. The data was later analyzed to answer each research question.
• To answer the first research question, if Xamarin and Flutter differs regarding battery lifetime, images of the format Joint Photographic Experts Group (JPEG) is fed to an image classifier for execution. During execution metric data have been collected and later analysed.
• To answer the second research question, if Xamarin and Flutter differs regarding CPU usage, RAM usage and execution time, images of the format JPEG is fed to an image clas-sifier for execution. During execution metric data have been collected and later analysed.
3.2 Process
The foundation of the study process is formed by an initial gathering of relevant research and a review of this literature. The review resulted in a body of knowledge and understanding of the problem area of which the purpose and research questions are based.
To increase research novelty and the contribution to the developer community modern technol-ogy libraries were chosen. With a dominant amount of previous scrutiny connected to GUI rendering and data parsing the focus ended up on image classification. Implementations and execution of such technologies and libraries generates novel data in a research context.
Finally the construction of the experiment was carried out based on techniques and ideas from previous research as well the documentation of chosen libraries.
3.3 Approach
Since both the purpose, research questions and the theoretical framework are based on previous studies and theory, a deductive approach has been adopted. The hypothesises of this study have been formed based upon the theoretical framework detailed in Chapter 3. Following the deductive approach, a experiment used to verify or refute the hypothesises have been designed.
3.4 Experiment
This chapter presents implementation details of the study’s experiment and the hypotheses that the experiment will verify or refute.
3.4.1 Hypothesis 1
Previous studies suggest that the AOT approach used by Flutter circumvents the energy overhead that comes with the JIT approach [23]. It is also difficult for a cross-platform tool to outperform native applications in performance and previous studies have suggested that cross-platform tools at best perform at par with native solutions. These two reasons shapes the hypothesis for the first research question:
The generated Android application by Flutter has a longer battery lifetime during execution of an image classification algorithm compared to Xamarin and is more closely comparable to native Android.
3.4.2 Hypothesis 2
Xamarin utilizes the JIT approach which in theory should lead to a RAM overhead in generated applications which Flutters utilization of AOT in theory circumvents. The fact that Flutter with an AOT approach can optimize and translate the code pre-runtime leads to what could be a more resource efficient runtime. These statements shapes the hypothesis for the second research question:
The generated Android application by Flutter has a faster execution time, less CPU usage and RAM usage during execution of an image classification algorithm compared to Xamarin and is more closely comparable to native Android.
3.4.3 Implementation
Each of the applications are implemented with image classification functionality provided by third party sources. In the native Android implementation the official TFL-API by Google is im-plemented [35], which is different from the cross-platform implementations where no options by Google exist. For the Xamarin implementation a library provided by Micrsoft was implemented [41]. Since Microsoft develops the Xamarin tool this is the closest option to an official Google alternative. For an implementation in Flutter there is only one option available, a library which is community created [42]. Even though the implementations for both Xamarin and Flutter require unofficial libraries provided by others than Google, these libraries implement the TFL-API for it’s generation of Android code.
In the implementations for native Android and Xamarin the images classified are extracted from the application assets as recommended by the documentation and examples. The library utilized for the Flutter implementation handles images in a different way. This library expects images to be stored in the system storage, a consequence of non-generic code. To be able to classify the image assets added to the implementation of Flutter the images was copied and written as a Dart File-object to the system storage.
Each application have been implemented as a developer without previous experience of neither tools nor libraries and no code optimizations have been done. Documentations and examples have been studied which leads to the most likely implementations if creating a new project. As in the work of Biørn-Hansen et al. [11], the focus is on performance provided out of the box. To run classification on images with TFL a model along with labels are required. The model
and labels are in each implementation stored in the application assets and loaded in to memory prior to classification. Mobilenet, the model utilized during this study, is further detailed in 2.6.2 Mobilenet. With the model and labels loaded an iteration of image loading, processing and classification begins. See an overview of the run process in figure 1
Each iteration begins by loading an image from the application assets. The image is then specif-ically processed to match the expectations of the model, previously mentioned in 2.6.2. The processed image data is then fed to a so called interpreter for classification.
When the classification is completed the interpreter returns a list of probabilities matching the labels. These probabilities are then mapped to it’s respective label and stored in an array of maps. This mapping is implemented in each library example to connect related data in preparation for further use. In this study the mapped data is never displayed nor applied to any other parts of the application.
Figure 1: An overview of the main components of the run process.
As image data a set of 100 different images have been select from the the Caltech-101 dataset previously described in 2.6.3. The labels of this dataset is not fully matching the labels of the used model, something not deemed as a problem. The scope of this study do not include scrutiny of model classification accuracy and what the images are actually portraying is therefore
irrelevant. This dataset is chosen since it consists of images portraying common real life objects. The same dataset was used in each implementation to ensure validity in a comparative analysis. Graphical user interface (GUI) is outside the scope of this study. Therefore, every graphical element have been stripped away so that no graphical process contributes to a decreased battery lifetime. The applications all have the same white background colour, since difference in colour also can affect the battery lifetime [3].
The application automatically starts the image classification process once the startup function is called and completely terminates the applications as soon as the set amount of classifications are processed.
3.4.4 Development environment
The native android application as well as each tool-generated application have been developed on Windows 10. The development environments differ when it comes to IDE, SDK and languages. The native android application was developed in the integrated development environment (IDE) Android Studio with the Android SDK 29.
The Xamarin application was developed in the IDE Visual Studio 2019 using the Android SDK 29 and Xamarin.Android SDK version 10.2.0.100. During development, Xamarin utilized C# version 8.
Flutter was also developed in the IDE Android Studio utilizing Android SDK 29. During devel-opment, Flutter was of version 3.9.1 and utilized Dart version 3.9.1.
3.4.5 Devices
The experiment is executed on the same device for each application. The device model and hardware specifications are detailed in table 1.
Device: OS: RAM: CPU:
OnePlus 6T Android 8GB Snapdragon 845
3.4.6 Test process
Prior to the experiment, all of the devices applications were terminated and airplane mode was enabled. Before each run in the experiment, a cache run was done to eliminate any unaccounted for anomalies connected to first time execution. The device’s screen brightness was set to 100% each run for each implementation. The device was fully charged and the charging cable was disconnected to ensure that the battery drain measured was connected to the batteries and not an external power source. To use Android Profiler, the android debug bridge have to have a connection with the device. To achieve this with the charging cable disconnected, WiFi was enabled and the Android WiFi ADB plugin for Android Studio was utilized. The extra battery drain from the WiFi was irrelevant since Android Debug Bridge (adb) which is further detailed in 3.5.2 Android Debug Bridge provides application specific battery drain.
To ensure that each experiments generated battery data was isolated to a specific run the battery statistics were reset using the following adb command.
$ adb shell dumpsys batterystats --reset
With an isolated log of data and a finished run process the data was dumped to a text file. The following terminal command executes adb and saves the file containing data of battery drain and execution time.
$ adb shell dumpsys batterystats > { path /} batterystats . txt To get the RAM statistics, the following adb command was used to log the data for each run. The command requires a time frame of how far back to grab data to be specified. Three hours is the lowest time frame that can be used, but does not impact the data gathered since each application restart resets the RAM statistics.
$ adb shell dumpsys procstats --hours 3 > { path /} memory . txt A related study measuring energy consumption performs their experiments 3 times for each im-plementation [3]. To increase validity and the sample size for analysis, the amount of runs were decided to be double that of the related study’s. Each application performed each experiment on the same images in the same order.
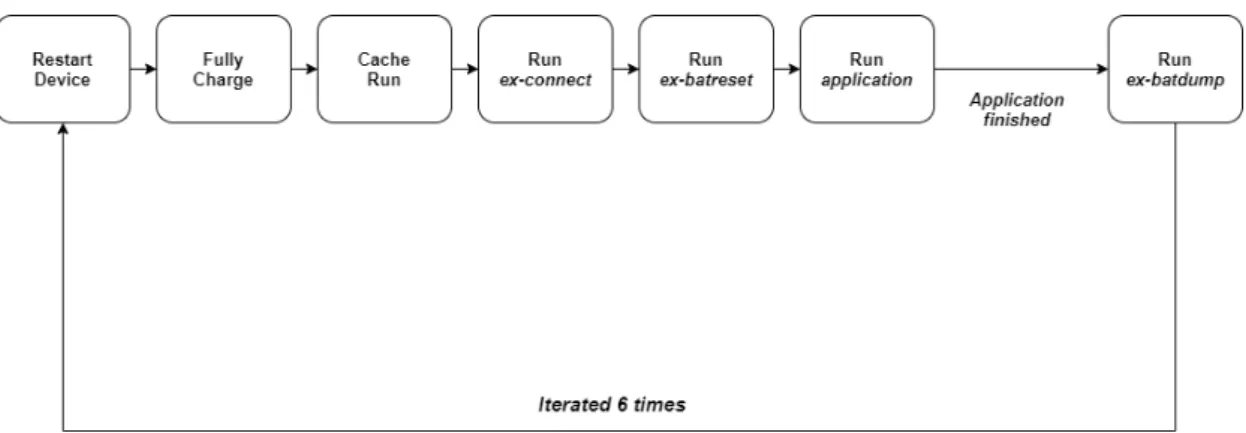
The test process was executed with the help of shell scripts to ensure the most consistency each time the experiment was performed. Three main shell scripts were developed for this purpose and can be viewed in the appendix. The shell script ex-connect automate the process
of connecting the Android WiFi ADB plugin, ex-batreset resets the cached battery statistics and ex-batdumpgrabs all necessary resource specifics for later analysis. For the shell scripts order during the test process see figure 2.
Figure 2: Test process utilizing shell scripts.
3.5 Data collection
During experimentation empirical data was collected for qualitative analysis. With the help of collection tools in both the command line and Android Studio metrics for battery drain, CPU usage and RAM usage was accessed. The generated data was either visually identified and manually recorded in Microsoft Excel or read from collected data files. The data points with name and units are displayed in Table 2.
Name Unit
RAM mean megabyte (MB)
CPU mean %
Battery drain Milliampere Hour (mAh)
Execution time m:s:ms
3.5.1 Android Profiler
Android Profiler presents profiling data that enables developers to measure the applications im-pact on performance [28]. The profiler provides information of CPU activity, memory allo-cations and network traffic. In this study the profiler was used to measure CPU mean values only.
3.5.2 Android Debug Bridge
The command-line tool adb enables developers to communicate with the mobile device [43]. The adb houses actions such as installing, but more importantly debugging applications. With the help of the command-line interface (CLI) command batterystats a battery statistics log was generated. From this log the data point battery drain was collected. The tool adb also enabled the usage of the CLI command procstats which generated a log containing RAM related statistics. From this log, the average RAM usage was collected.
3.5.3 Android WiFi ADB
The Android Studio plugin Android WiFi ADB developed by Pedro Vicente Gomez Sanchez provides the developer with the ability to install, debug and run an application on a device without being physically connected to the device [44]. Android WiFi ADB version 2.4 was during this study utilized to debug the applications without the use of a charging cable, since having a external power supply could impact the battery drain measurements.
3.6 Data analysis
To get conclusions about the sample data collected, analytical statistics is generated through a statistical significance test. To gain more information about specific data, descriptive statistics are generated with the help of mean and standard deviation.
3.6.1 Standard deviation
Standard deviation is a statistical measurement for how much values of a population deviates from the mean. Values amassed near the mean indicates a low standard deviation, while the opposite indicates a high standard deviation. This study utilized the standard deviation seen in equation 1 for statistical significance analysis.
σ = s 1 N N
∑
i=1 (xi− µ)2 where µ = 1 N N∑
i=1 xi (1) · N = Sample size 3.6.2 Statistical significanceInferential statistics is based on the premise that that you cannot prove that something is true. There is instead the possibility of disproving something by finding a exception. When perform-ing a statistical significance analysis, in most cases at least two hypothesises are formed. The alternative hypothesis is the hypothesis that evidence is gathered for. The null hypothesis is the opposite of the alternative hypothesis and evidence is gathered to disprove it.
The t-test, see equation 2, also called student’s t-test is a method of testing hypotheses of samples from a normally distributed population where the standard deviation is unknown.
t=x− µs √ n (2) · n = Sample size · s = Standard deviation · x = Mean · µ = theoretical mean
Before performing the analysis α , the level of significance, has to be decided on. The level of significance is the probability that the null hypothesis is said to be true even though it is false. This is also known as a type 1 error.
The p-value is used to decide if the results are statistically significant and to determine if the effect shown from the sample indicates to be true for the population as well or if it is simply
by chance or by sample error. Generally, the effect is accepted to be statistically significant if p < α, when α = 0.05, which also indicates that there is evidence that the effect exists in the population [45]. A p-value that is lower than the level of significance rejects the null hypothesis. In this study, Microsoft Excel will be utilized to calculate the p-value.
In this study a two-sample t-test are performed on the following hypothesises which in turn is applied to each research question:
Null hypothesis: There is no difference between the two implementations. Alternative hypothesis: There is a difference between the two implementations.
This results in a null hypothesis as: H0: µ1= µ2and the alternative hypothesis as Ha: µ16= µ2.
A two-sample t-test, see equation 3, is a variation of the students t-test that instead conducts a hypothesis test for the difference between two sample means [46].
t=qxx− xf s2 x+s2f n (3) · n = Sample size · s = Standard deviation · x = Mean · x = Xamarin · f = Flutter
3.7 Reliability and validity
To achieve reliability all of the source code is made publicly available and the experiment envi-ronment, workflow and variable elimination is defined. To strengthen the validity of the study the experiments have been conducted under constant conditions and a significance analysis have been performed and taken into account. A threat against the study’s validity is the use of a sin-gle device during experiment runs. The high device fragmentation of Android devices makes ensuring validity of this kind a challenging task.
4
Empiricism
The chapter provides a general description of the empirical domain that underlies this study. Furthermore, the collected empirical data is described to answer the study’s research questions. The data needed to answer the study’s research questions is divided into the four parts average CPU usage, average RAM usage, average battery drain and average execution time. Figure 3 to 6 presents the average data over each experiment run for each implementation. The data is later analysed and put into context in chapter 5 Analysis.
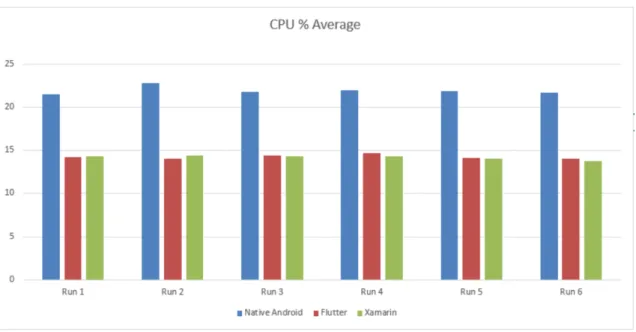
4.1 CPU average
Figures 3 presents the average CPU usage data gained from the experiment.
Figure 3: Average CPU usage for each run.
While native Android utilizes considerably more CPU than both of the cross-platform tools, there is minimal difference between Flutter and Xamarin for each run. Native Android saw larger fluctuations between each experiment than both Flutter and Xamarin.
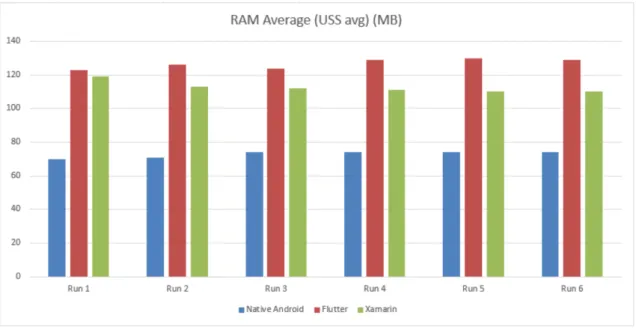
4.2 RAM average
Figures 4 presents the average RAM usage data gained from each experiment.
Figure 4: Average RAM usage for each run.
Flutter utilizes more RAM on average per experiment than Xamarin. For each experiment, native Android uses considerably less RAM than both the of the cross-platform tools. Flutter presents small fluctuations between each experiment, while native Android and Xamarin had minimal fluctuations.
4.3 Battery drain average
Figures 5 presents the average battery drain per second data gained from each experiment.
Figure 5: Average battery drain for each experiment.
For nearly every run, Xamarin has the highest battery drain. Xamarin is followed by native Android which on every occasion drained more battery than Flutter. Every implementation saw fluctuations in battery drain between each experiment.
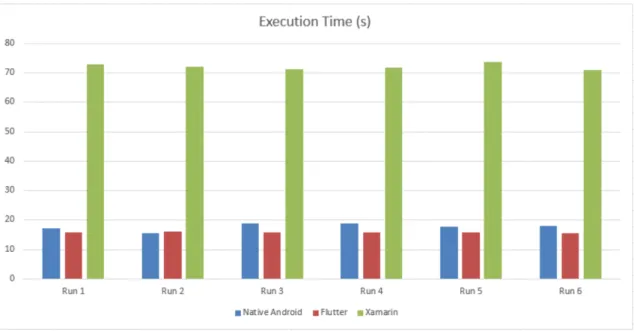
4.4 Execution time average
Figures 6 presents the average execution time for each implementation during the experiments.
Figure 6: Average execution time for each experiment.
Although native Android and Flutter showed difference in execution time, Xamarin greatly over-shadowed that difference with almost a fivefold increase compared to Native Android and Flut-ter. Both native Android and Xamarin had small fluctuations while Flutter showed minimal fluctuations.
5
Analysis
This chapter answers the study’s research questions by processing the theoretical framework and the collected empirical data.
5.1 Research question 1 - Battery lifetime
To answer the first research question: How do Android applications generated by Flutter and Xamarin differ regarding battery lifetime compared to native Android during execution of an image classification algorithm, an experiment was performed to generate measurements of bat-tery drain. The hypothesis formed for the first research question resulted in following: The generated Android application by Flutter has a lower battery drain during execution of an im-age classification algorithm compared to Xamarin and is more closely comparable to native Android. A statistical significance test was performed to detail any difference of significance. To verify the null hypothesis, the p-value gained through the students t-test was used. The null hypothesis for the first research question was as follows: there is no difference between the two implementations.
5.1.1 Average measurement
As seen in table 3, the average measurement over all experiment runs indicate that Xamarin drains the most battery, followed closely by native Android. Flutter showed an average battery drain half of what Xamarin did.
Implementation Native Android Flutter Xamarin
Battery drain per second (mAh/s):
0,054701622 0,034959556 0,062015072
Table 3: A table of the total average battery drain per second for each implementation.
5.1.2 Significance analysis
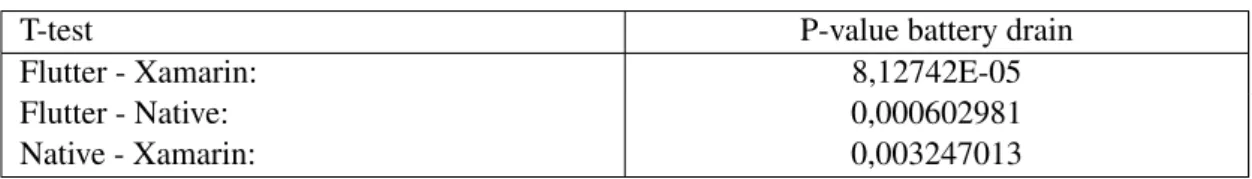
The average measurements of battery drain presented indicates that there is a difference between each tool and native Android. This is supported by the statistical significance analysis where the
p-value is less than 0.05 for each t-test. This meant that the null hypothesis could be rejected in favor of the alternative hypothesis for each tool and native Android. See table 4.
T-test P-value battery drain
Flutter - Xamarin: 8,12742E-05
Flutter - Native: 0,000602981
Native - Xamarin: 0,003247013
Table 4: A table presenting the P-values of the battery drain t-tests.
5.2 Research question 2 - CPU usage, RAM usage and execution time
To answer the study’s second research question: How do Android applications generated by Flutter and Xamarin differ regarding CPU usage, RAM usage and execution time compared to native Android during execution of an image classification algorithm, experiments were per-formed in the same way as previously. The hypothesis per-formed for the second research question resulted in following: The generated Android application by Flutter has a faster execution time, less CPU usage and RAM usage during execution of an image classification algorithm compared to Xamarin and is more closely comparable to native Android. A statistical significance test and null hypothesis verification have been performed as with the first research question. The null hypothesis for the second research question was as follows: there is no difference between the two implementations.
5.2.1 CPU usage mean
The results in table 5 shows native Android using considerably more CPU than both Flutter and Xamarin. The results suggest that the two tools have remarkably similar CPU usage with little to no difference.
Implementation Native Android Flutter Xamarin
CPU mean (%): 22,02156 14,25969 14,20084
5.2.2 RAM usage mean
In terms of average RAM usage, the results show a difference between all implementations. Flutter uses the most RAM closely followed by Xamarin. The mean RAM-usage values of native Android were far lower than that of both tools. See table 6.
Implementation Native Android Flutter Xamarin
RAM mean (MB): 72,833333 126,8333333 112,5
Table 6: A table presenting the total RAM mean for each implementation.
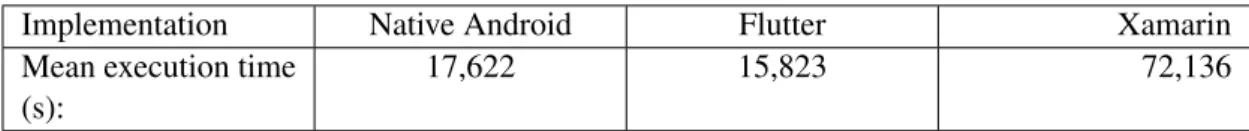
5.2.3 Execution time mean
The average execution time of native Android and Flutter were only seconds apart with Flutter outperforming native Android. Xamarin however had considerably longer execution time on average with an almost fivefold increase compared to native Android and Flutter. See table 7
Implementation Native Android Flutter Xamarin
Mean execution time (s):
17,622 15,823 72,136
Table 7: A table presenting the total mean execution time for each implementation.
5.2.4 Significance analysis
The mean values suggest there to be a difference between each tool and native Android when comparing CPU usage, RAM usage and execution time. The same can be said about the dif-ference between Flutter and Xamarin when comparing RAM usage and execution time, but not CPU usage. The results of the t-test supports this with the p-value being below 0.05 when com-paring RAM usage and execution time, while being above 0.05 when comcom-paring CPU usage. This means that the null hypothesis can be rejected in favor of the alternative hypothesis when comparing CPU usage, RAM usage and execution time between each tool and native Android, but not CPU usage between Flutter and Xamarin. See table 8.
T-test P-value CPU P-value RAM P-value Execution time
Flutter - Xamarin: 0,672707934 1,59627E-05 8,7253E-11
Flutter - Native: 9,64823E-10 9,94514E-11 0,017775924
Native - Xamarin: 8,23602E-10 1,12605E-08 9,77383E-15
Table 8: A table presenting a summary of the t-tests for CPU, RAM and execution time.
5.3 Summary
When comparing Xamarin with native Android, the latter relies more heavily on CPU usage. The results shows native Android consuming 7.8% more CPU than Xamarin. However, Xamarin uses 113,0 MB RAM while native Android only uses 72,8MB. This trend of native Android consuming more CPU but less RAM than Xamarin is something that is echoed in related studies [11]. Xamarin showed a slight increase in battery drain and a massive increase in execution time compared to native Android.
Xamarin and Flutter showed the same behaviour when comparing CPU usage and RAM usage with native Android. Flutter consumed 7.8% less CPU but 54 MB more RAM than native Android. Flutter did however not see the same trend with battery drain and execution time as Xamarin. The results suggest that Flutter on average performed better than native Android in both categories with a 0,0197 mAh lower battery drain per second and a 1.8 seconds faster execution time than native Android.
When comparing Flutter and Xamarin, the t-tests result show no difference in CPU usage but a difference in RAM usage where Flutter used 14,3 MB more RAM than Xamarin. Flutter did however show a slightly lower battery drain per second and a massive decrease in execution time compared to Xamarin.
These results means that the hypothesis, The generated Android application by Flutter has a longer battery lifetime during execution of an image classification algorithm compared to Xam-arin and is more closely comparable to native Android, is indeed correct.
The hypothesis, The generated Android application by Flutter has a faster execution time, less CPU usage and RAM usage during execution of an image classification algorithm compared to Xamarin and is more closely comparable to native Android, can not be called entirely correct. Flutter did indeed present a faster execution time than Xamarin did in comparison with native Android. Flutter did however not demonstrate a lower CPU and RAM usage.
6
Discussion and Conclusions
The chapter gives a summary of the study’s results. Furthermore, the study’s implications and limitations are detailed. The study’s conclusions and recommendations are also detailed. The chapter ends with a suggestion for further research.
6.1 Result
The study aims to fulfill the purpose: To determine how Android applications generated by Flutter and Xamarin differ regarding hardware resource usage and performance compared to native Android. A comparison that gives developers a decision basis when choosing between cross-platform tools of the CC approach for mobile development. To achieve this two research questions were constructed. The following subsections discusses the research question specific results that the analysis produced.
6.1.1 Battery lifetime
Analysing the empiricism for the first research question defined in chapter 1.3 Purpose and re-search questionssuggests a interesting result. As hypothesised because of JIT’s energy overhead [23], Flutter performed better than Xamarin when comparing battery drain, as seen in figure 7 Xamarin had double the battery drain compared to Flutter. Surprisingly and interestingly, Flutter didn’t just drain more battery than Xamarin, it also outperformed native Android with a lower battery drain per second.
Figure 7: Total battery drain mean value.
Although Flutter draining less battery than Xamarin was expected, Flutter draining less than native Android was not. This can potentially be explained by the library utilized for Flutter being more efficiently implemented than the library used for native Android. There is also a possibility that the documentation and examples followed during the implementation introduced more efficient solutions on Flutter than on native Android. The study’s results are however still interesting and relevant since the study’s purpose are to help give developers a decision basis when choosing between CC cross-platform tools for mobile development.
This results leads to the answer for the first research question: there is a clear difference in battery drain between Flutter and Xamarin compared to native Android. Flutter in fact performs better than Xamarin and native Android in terms of battery drain.
6.1.2 CPU usage, RAM usage and execution time
The analysis result for the second research question defined in chapter 1.3 Purpose and research questionsalso shows interesting results. Since AOT theoretically circumvents the overhead that comes with JIT, Flutter was hypothesised to consume less CPU and RAM while still having a faster execution time than Xamarin when comparing against native Android. The analysis
results instead showed Flutter consuming more RAM than Xamarin and no difference in CPU usage, as seen in figure 8 and 9.
Figure 8: Total average RAM usage.
The tools also saw a difference in terms of execution time. Although Flutter didn’t use less CPU and RAM than Xamarin, as seen figure 10 it still outperformed Xamarin with a large margin in terms of execution time. Flutters CPU usage, RAM usage and execution time could point towards Flutter better utilizing the hardware resources available.
Figure 10: Total average execution time.
The fact that Flutter used the same CPU and more RAM compared to Xamarin even though Flutter utilizes AOT could be the result of the libraries that was used for the experiment. Once again, the implementations were also done as instructed by official documentation or the only available examples and therefore, there is a possibility that the one implementation was more efficient than the others. This could explain why Flutter consumed the same CPU and more RAM than Xamarin when AOT should help reduce the resource overhead.
The massive increase in execution time for Xamarin compared to the other two implementations is identified to be connected with the ByteBuffer class in the Java.Nio namespace. This class is utilized in the Xamarin implementation to convert images to ByteBuffers in preparation for classification. This massive increase in execution time may point towards Xamarin not being the best choice when utilizing Java.nio namespace ByteBuffers.
These results lead to the answer for the second research question: there is a clear difference in RAM usage and execution time but not in CPU usage.
6.2 Implications
The results presented by the study could help companies and private developers form a deci-sion basis when deciding between developing with Flutter and Xamarin. Further, if developing image classification utilizing TensorFlow lite on Xamarin is considered, the study could help re-evaluate the decision in favor of Flutter for better performance
This study also helps broaden the knowledge available of hardware utilization on CC cross-platform tools and the empiricism and analysis results could also be utilized in further research.
6.3 Limitations
The study have faced several limitations because of it’s naturally limited scope. The decision to only perform experiments on applications developed for a single Android device results in no generalization being possible for other operating systems such as iOS. This also means that no conclusion can be made on whether the hardware have had any impact on the performance or not, since the applications only were run on a single set of hardware.
Flutter and Xamarin are both CC cross-platform tools. This means that the results can not be generalized for other cross-platform approaches such as hybrid or the interpreted approach.
6.4 Conclusions and recommendations
Although a higher RAM usage, the results indicates that Flutter has a lower execution time than both Xamarin and native Android when performing image classification. These conclusions motivates our recommendation of using Flutter when choosing between CC cross-platform tools, especially if the use case requires the developer to utilize the Java.Nio namespace ByteBuffer class if Xamarin is chosen.
The results also shows Flutter being superior to both Xamarin and native Android in terms of battery drain. The importance of battery life time for user experience in addition to Flutters advantage of energy efficiency further motivates our recommendation of choosing Flutter over Xamarin.
Although fairly limited, the quality of documentation and examples was also in favor of Flutter compared to Xamarin. The fact that Flutter is relatively new is something that us as developers
however noticed. Flutter could at times be less intuitive and require non official libraries and the entire debugging process for mobile was less intuitive and more difficult compared to Xa-marin. Even with these factors in consideration, we still feel like the quality and performance of the resulted code outweighed the negatives and therefore still recommend using Flutter over Xamarin.
6.5 Further research
There are several interesting areas for further research to extend or alternate this study. As previously stated, the execution time by the Xamarin implementation stands out and the specific section of the source code responsible was identified. The usage of the Java.Nio.ByteBuffer class is signifcantly slower than in the other implementations, a fact that makes a scrutiny of Xamarins Java bindings in comparison to native Java an interesting topic.
This study limits it’s scope to the Android OS which opens up for further research including iOS. A comparison study between Xamarin iOS and Xamarin Android is specifically interesting since they differ in compilation method similar to Xamarin Android and Flutter Android. A comparison between Flutter iOS and Xamarin iOS is interesting aswell since they share both approach and compilation method.
As previously mentioned the device fragmentation of Android makes scrutinizing software tools a challenging task. Scrutinizing performance of tools running on specific hardware architectures would be of interest. While its not feasible to evaluate performance on thousands of different devices the scope could for example include different categories of modern hardware solutions. Extending this study to generate metric data with other technologies than image classification would as well be of interest. Another resource heavy technology that Flutter and Xamarin could be compared running is 3D rendering.
References
[1] G. P. Perrucci, F. H. P. Fitzek, and J. Widmer, “Survey on energy consumption entities on the smartphone platform”, in 2011 IEEE 73rd Vehicular Technology Conference (VTC Spring), 2011, pp. 1–6.
[2] J. Berrocal, J. Garcia-Alonso, C. Vicente-Chicote, J. Hern´andez, T. Mikkonen, C. Canal, and J. M. Murillo, “Early analysis of resource consumption patterns in mobile applica-tions”, Pervasive and Mobile Computing, vol. 35, pp. 32–50, 2017, ISSN: 1574-1192.
DOI: https : / / doi . org / 10 . 1016 / j . pmcj . 2016 . 06 . 011. [Online]. Available: http://www.sciencedirect.com/science/article/pii/S1574119216300797. [3] M. Ciman and O. Gaggi, “An empirical analysis of energy consumption of cross-platform
frameworks for mobile development”, Pervasive and Mobile Computing, vol. 39, pp. 214– 230, 2017,ISSN: 1574-1192. DOI: https://doi.org/10.1016/j.pmcj.2016.10. 004. [Online]. Available: http : / / www . sciencedirect . com / science / article / pii/S1574119216303170.
[4] A. Ahmad, K. Li, C. Feng, S. M. Asim, A. Yousif, and S. Ge, “An empirical study of in-vestigating mobile applications development challenges”, IEEE Access, vol. 6, pp. 17 711– 17 728, 2018.
[5] S. Xanthopoulos and S. Xinogalos, “A comparative analysis of cross-platform develop-ment approaches for mobile applications”, in Proceedings of the 6th Balkan Conference in Informatics, ser. BCI ’13, Thessaloniki, Greece: Association for Computing Machinery, 2013, pp. 213–220,ISBN: 9781450318518.DOI: 10.1145/2490257.2490292. [Online]. Available: https://doi.org/10.1145/2490257.2490292.
[6] H. Heitk¨otter, S. Hanschke, and T. A. Majchrzak, “Evaluating cross-platform develop-ment approaches for mobile applications”, in Web Information Systems and Technologies, J. Cordeiro and K.-H. Krempels, Eds., Berlin, Heidelberg: Springer Berlin Heidelberg, 2013, pp. 120–138,ISBN: 978-3-642-36608-6.
[7] (2020). Mobile operating systems’ market share worldwide from january 2012 to july 2019, Statista, [Online]. Available: https : / / www . statista . com / statistics / 272698/global-market-share-held-by-mobile-operating-systems-since-2009/ (visited on 01/19/2020).
[8] A. Charland and B. Leroux, “Mobile application development: Web vs. native”, Commun. ACM, vol. 54, no. 5, pp. 49–53, May 2011,ISSN: 0001-0782.DOI: 10.1145/1941487.
[9] M. Palmieri, I. Singh, and A. Cicchetti, “Comparison of cross-platform mobile develop-ment tools”, in 2012 16th International Conference on Intelligence in Next Generation Networks, 2012, pp. 179–186.
[10] M. Willocx, J. Vossaert, and V. Naessens, “A quantitative assessment of performance in mobile app development tools”, in 2015 IEEE International Conference on Mobile Services, 2015, pp. 454–461.
[11] A. Biørn-Hansen, T.-M. Grønli, and G. Ghinea, “Animations in cross-platform mobile applications: An evaluation of tools, metrics and performance”, English, Sensors, vol. 19, no. 9, Jan. 2019. [Online]. Available: http://proxy.library.ju.se/login?url= https://search-proquest-com.proxy.library.ju.se/docview/2301614100? accountid=11754.
[12] (2020). Xamarin framework, Microsoft, [Online]. Available: https://dotnet.microsoft. com/apps/xamarin (visited on 05/13/2020).
[13] Statista. (2019). Most used libraries, frameworks, and tools among developers, world-wide, as of early 2019, [Online]. Available: https://www.statista.com/statistics/ 793840 / worldwide - developer - survey - most - used - frameworks/ (visited on 01/19/2020).
[14] (2017). Xamarin platforms, Microsoft, [Online]. Available: https://docs.microsoft. com/en- us/xamarin/ platform/app- fundamentals/building- cross-platform-applications/understanding-the-xamarin-mobile-platform (vis-ited on 05/13/2020).
[15] (2020). Flutter framework, Google, [Online]. Available: https : / / flutter . dev / ?gclid=CjwKCAjwte71BRBCEiwAU_V9h3AwOhIl8YENqf32-cfPWzUdCL2MaR7Nb1Q7pr-qW7GznMcCK7L5nxoCHdwQAvD_BwE%5C&gclsrc=aw.ds (visited on 05/13/2020).
[16] (2020). Dart platforms, Google, [Online]. Available: https://dart.dev/platforms (visited on 05/13/2020).
[17] S. Hao, D. Li, W. G. J. Halfond, and R. Govindan, “Estimating mobile application energy consumption using program analysis”, in 2013 35th International Conference on Software Engineering (ICSE), 2013, pp. 92–101.
[18] (2020). Instagram, Google, [Online]. Available: https://play.google.com/store/ apps/details?id=com.instagram.android (visited on 05/08/2020).
[19] (2018). Improved accessibility through alternative text support, Facebook, [Online].
Avail-able: https://about.instagram.com/blog/announcements/improved-accessibility-through-alternative-text-support (visited on 05/22/2020).
[20] M. Ciman, O. Gaggi, and N. Gonzo, “Cross-platform mobile development: A study on apps with animations”, in Proceedings of the 29th Annual ACM Symposium on Applied Computing, ser. SAC ’14, Gyeongju, Republic of Korea: Association for Computing Ma-chinery, 2014, pp. 757–759,ISBN: 9781450324694.DOI: 10.1145/2554850.2555104. [Online]. Available: https://doi.org/10.1145/2554850.2555104.
[21] I. T. Mercado, N. Munaiah, and A. Meneely, “The impact of cross-platform development approaches for mobile applications from the user’s perspective”, in Proceedings of the International Workshop on App Market Analytics, ser. WAMA 2016, Seattle, WA, USA: Association for Computing Machinery, 2016, pp. 43–49, ISBN: 9781450343985. DOI: 10 . 1145 / 2993259 . 2993268. [Online]. Available: https : / / doi . org / 10 . 1145 / 2993259.2993268.
[22] D.-H. Jung, S.-M. Moon, and S.-H. Bae, “Evaluation of a Java Ahead-of-Time Compiler for Embedded Systemsˆa C ”, The Computer Journal, vol. 55, no. 2, pp. 232–252, Oct. 2011,ISSN: 0010-4620.DOI: 10.1093/comjnl/bxr100. eprint: https://academic.
oup.com/comjnl/article-pdf/55/2/232/978730/bxr100.pdf. [Online]. Avail-able: https://doi.org/10.1093/comjnl/bxr100.
[23] A. W. Wade, P. A. Kulkarni, and M. R. Jantz, “Aot vs. jit: Impact of profile data on code quality”, SIGPLAN Not., vol. 52, no. 5, pp. 1–10, Jun. 2017,ISSN: 0362-1340.DOI: 10 . 1145 / 3140582 . 3081037. [Online]. Available: https : / / doi . org / 10 . 1145 / 3140582.3081037.
[24] (2017). Xamarin.ios ahead of time compilation, Microsoft, [Online]. Available: https: / / docs . microsoft . com / en - us / xamarin / mac / internals / aot (visited on 04/14/2020).
[25] T. Suganuma, T. Ogasawara, M. Takeuchi, T. Yasue, and e. al et, “Overview of the ibm java just-in-time compiler”, English, IBM Systems Journal, vol. 39, no. 1, pp. 175–193, 2000, Copyright - Copyright International Business Machines Corporation 2000; Last up-dated - 2012-02-17; CODEN - IBMSA7. [Online]. Available: http://proxy.library. ju.se/login?url=https://search- proquest- com.proxy.library.ju.se/ docview/222423803?accountid=11754.
[26] (2020). Android developers, Google, [Online]. Available: https://developer.android. com/studio (visited on 04/14/2020).
[27] (2019). Stackoverflow survey 2019, Stackoverflow, [Online]. Available: https://insights. stackoverflow.com/survey/2019#technology-_-most-popular-development-environments (visited on 04/14/2020).
[28] (2020). Measure app performance with android profiler, Google, [Online]. Available: https://developer.android.com/studio/profile/android-profiler (visited on 04/14/2020).
[29] (2020). Xamarin android, Microsoft, [Online]. Available: https://docs.microsoft. com/en-us/xamarin/android/ (visited on 05/22/2020).
[30] (2020). Skia in flutter & fuchsia, Google, [Online]. Available: https : / / skia . org / dev/flutter (visited on 04/14/2020).
[31] (2019). Improving rendering performance, Google, [Online]. Available: https://flutter. dev/docs/perf/rendering (visited on 04/14/2020).
[32] (2020). Frequently asked questions, flutter, Google, [Online]. Available: https://flutter. dev/docs/resources/faq#how-does-flutter-run-my-code-on-ios (visited on 04/14/2020).
[33] (2020). Visual studio code, Microsoft, [Online]. Available: https://code.visualstudio. com/ (visited on 04/14/2020).
[34] (2019). Foundation library - dart api, Google, Flutter, [Online]. Available: https : / / api.flutter.dev/flutter/foundation/foundation-library.html (visited on 04/14/2020).
[35] (2020). Get started with tensorflow lite, Google, [Online]. Available: https : / / www . tensorflow.org/lite/guide/get_started (visited on 04/14/2020).
[36] J. Park, Y. Kwon, Y. Park, and D. Jeon, “Microarchitecture-aware code generation for deep learning on single-isa heterogeneous multi-core mobile processors”, IEEE Access, vol. 7, pp. 52 371–52 378, 2019.
[37] (2020). Hosted models, Google, [Online]. Available: https://www.tensorflow.org/ lite/guide/hosted_models#floating_point_models (visited on 05/08/2020). [38] A. G. Howard, M. Zhu, B. Chen, D. Kalenichenko, W. Wang, T. Weyand, M. Andreetto,
and H. Adam, “Mobilenets: Efficient convolutional neural networks for mobile vision ap-plications”, CoRR, vol. abs/1704.04861, 2017. arXiv: 1704.04861. [Online]. Available: http://arxiv.org/abs/1704.04861.
[39] N. B, “Image data pre-processing for neural networks”, Becoming Human Exploring Ar-tificial Intelligence & What it Means to be Human, 2017. [Online]. Available: https : //becominghuman.ai/image- data- pre- processing- for- neural- networks-498289068258.
[40] L. Fei-Fei, R. Fergus, and P. Perona, “Learning generative visual models from few training examples: An incremental bayesian approach tested on 101 object categories”, IEEE, 2004. [Online]. Available: http : / / www . vision . caltech . edu / feifeili / Fei -Fei_GMBV04.pdf.
[41] (2020). Xamarin.tensorflow.lite, Microsoft, [Online]. Available: https://www.nuget. org/packages/Xamarin.TensorFlow.Lite (visited on 05/22/2020).
[42] (2020). Tflite, Google, [Online]. Available: https://pub.dev/packages/tflite/ (visited on 04/28/2020).
[43] (2019). Android debug bridge (adb), Google, Inc, [Online]. Available: https://developer. android.com/studio/command-line/adb (visited on 01/19/2020).
[44] (2020). Android wifi adb, Pedro Vicente Gomez Sanchez, [Online]. Available: https: / / plugins . jetbrains . com / plugin / 7983 - android - wifi - adb (visited on 05/07/2020).
[45] (1997). Significance tests for unknown mean and unknown standard deviation, Michelle Lacey, [Online]. Available: http://www.stat.yale.edu/Courses/1997-98/101/ sigtest.htm (visited on 05/06/2020).
[46] (2018). E-handbook of statistical methods, NIST/SEMATECH, [Online]. Available: https: //www.itl.nist.gov/div898/handbook/eda/section3/eda353.htm (visited on 05/06/2020).
Appendix
Appendix 1
The implementation source code of the native Android application can be found at https: //github.com/LucasArvid/android-ml.
The implementation source code of the Flutter application can be found at https://github. com/LucasArvid/ml-flutter.
The implementation source code of the Xamarin application can be found at https://github. com/maxbekkhus/xamarin-android-tensorflow-lite.
All empiricism, analysis data, shell scripts and experiment results can be found at https:// github.com/maxbekkhus/fyp-experiment.